







Nowadays, every business works on numbers, and converting such numbers into decisions is where Python Data Analysis proves to be valuable. Irrespective of whether it a retail company tracking sales patterns or a startup evaluating user behavior, Python has become a preferable language that makes sense of all the raw data. Its straightforward syntax, integrated with a rich environment of libraries, enables developers and analysts to move away from chaotic spreadsheets to a clear business knowledge in a matter of steps. In this blog, let us walk through what Python Data Analysis really means, the tools that make it possible, and how a novice can begin applying the knowledge with total confidence.
Python Data Analysis can be defined as the process of collecting, cleaning, converting, and assessing data with the help of Python programming to find patterns, trends, and relationships within it. Instead of sorting through rows or columns in a spreadsheet, analysts generate code that automates repetitive tasks and scale large datasets easily.
Mainly, this process involves:
Python is preferred for data analysis mainly due to its readable syntax and mature set of open-source libraries specifically built for tabular and numerical data. Developers who are at the beginner stage with the language can go through our guide on top programming tutorials to improve their Python fundamentals before delving into analysis work.
No discussion on data analysis with Python can ever be complete without its supporting libraries. Each one plays a different role in the workflow:
When used together, such tools lay the foundation for Python Data Analysis, allowing a single script to manage everything from raw import of data to a completed visualization. For readers who need a wider view of how these libraries align into the broader programming environment, check out our detailed guide on best coding practice websites.
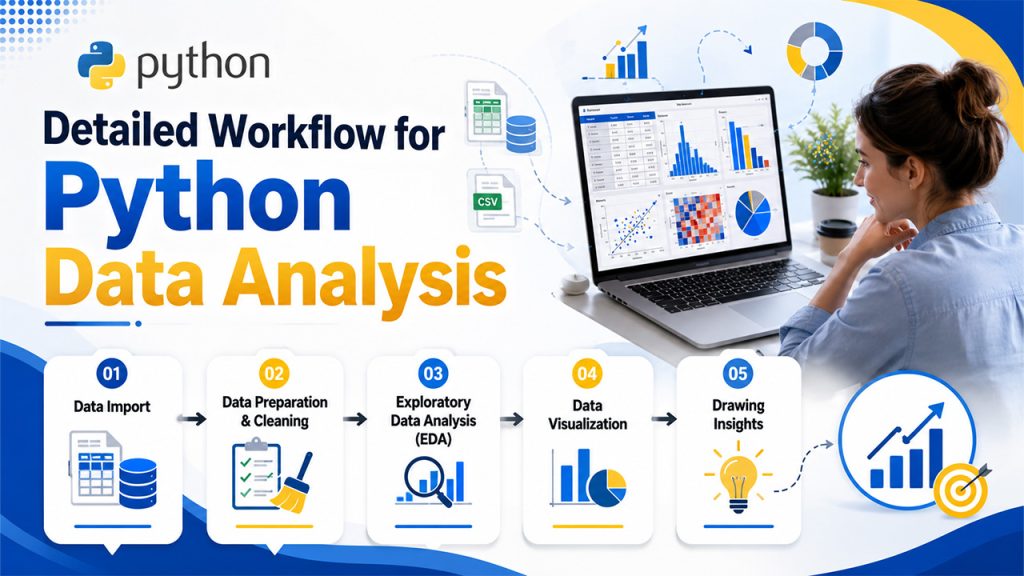
An organized workflow makes Python Data Analysis far less overwhelming, specifically for beginners managing their first real dataset:
Data is often processed from Excel sheets, CSV files, or SQL databases utilizing Panda’s function like read_sql or read_csv. This step centralizes raw data into a DataFrame that Python can directly work with.
Real-world datasets arrive rarely with perfect formatting. Analysts look for missing values, inconsistent data types, and remove duplicate rows before going forward. Skipping this step generally leads to inaccurate results later.
This stage pertains to summarizing the dataset via functions such as info and describe, checking value counts, and recognizing outliers through methods like interquartile range. EDA is precisely where the main concept obscured in the data begins to surface.
Charts reveal findings more effectively than raw numbers. Histogram reveals distribution, bar charts compare different categories, and correlation heatmaps showcase relationships between different variables, all providing support to clearer Python Data Analysis conclusions.
The final step combines everything together, converting trends and patterns into suggestions that a research or business team can work on. Readers creating a wider technical foundation along with this process may also consider referring to our blog coding challenges for beginners, which enhances logical thinking that can help them in their data analysis work.

Python Data Analysis is not restricted to a specific industry. It provides support to:
Some practices continuously enhance the reliability and quality of the analysis work:
Analysts launching Python scripts in local environments must also understand how the interpreter processes code behind the scenes; refer to our dedicated guide on runtime environments to understand it in simple terms.
Python Data Analysis has become an essential skill for anyone working with data, from marketing teams tracking campaign performance to developers building data-driven applications. With libraries like Pandas, NumPy, and Matplotlib handling the heavy lifting, beginners can move from raw datasets to meaningful insights in a structured, repeatable way. Understanding Data Lineage also helps track where data comes from, how it changes, and how it reaches its final destination, making analysis more reliable and transparent.
Python manages repetitive tasks and bigger datasets more efficiently than Excel, and it provides support to sophisticated statistical processes that spreadsheets cannot perform easily.
No. Core data analysis emphasizes exploring, cleaning, and visualizing information. Machine learning is a more sophisticated and separate skill that creates such fundamentals.
Pandas is typically the first stop that a beginner has to learn because it handles the routine tasks of cleaning, loading, and organizing data before visualization or modeling begins.
Most beginners with standard Python knowledge can understand the core workflow, including simple visualizations and Pandas, within the first four-to-six hours of continuous practice. However, including more real-world and complex datasets often take a few months longer.
Previous experience with Python syntax is valuable. However, the main operations in NumPy and Pandas are sufficiently readable that beginners with minimum coding background can choose quickly through hands-on practice.
此内容由惯性聚合(RSS阅读器)自动聚合整理,仅供阅读参考。 原文来自 — 版权归原作者所有。