







Essential productivity kit for .NET and game developers
If you’ve ever debugged your own C++ containers, strings, or hash tables on Linux or macOS, you know the deal: to see anything useful in the debugger, you have to write a custom data formatter. And writing a good data formatter is genuinely painful. Often, the formatter ends up longer and harder to follow than the class it’s supposed to explain.
Starting in Rider 2026.2, you no longer have to. Natvis now works on Linux and macOS, not just Windows. You describe how your type should look in a few lines of XML, and Rider’s debugger does the rest.
Let us show you why that matters.
A class, and the formatter it deserves
Here’s a simple stack. Nothing exotic – a size, a capacity, and a pointer to some data:
template <class T>
class MyStack {
public:
    MyStack() = default;
    MyStack(const MyStack&) = delete;
    MyStack& operator=(const MyStack&) = delete;
    ~MyStack() { delete[] m_data; }


    void Add(T value) {
        if (m_data == nullptr) {
            m_capacity = 4;
            m_data = new T[m_capacity];
        } else if (m_size >= m_capacity) {
            m_capacity *= 2;
            T* new_data = new T[m_capacity];
            for (size_t i = 0; i < m_size; ++i) {
                new_data[i] = m_data[i];
            }
            delete[] m_data;
            m_data = new_data;
        }
        m_data[m_size++] = value;
    }

private:
    size_t m_size{0};
    size_t m_capacity{0};
    T* m_data{nullptr};
};
Let’s add some elements to see what the debugger shows.
MyStack<int> stack;
stack.Add(1);
stack.Add(2);
stack.Add(3);
Out of the box, the debugger will show you something like this:
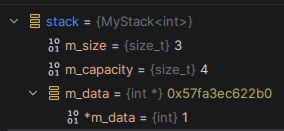
You get the size, the capacity, and exactly one element. The other two are out there in memory somewhere, but the debugger has no idea they exist.
To see the whole stack, you need a data formatter. It looks like this… 🫠
import lldb

# ---------------------------------------------------------------------------
# MyStack<T>
# ---------------------------------------------------------------------------

class MyStackSyntheticProvider:
    def __init__(self, valobj, internal_dict):
        self.valobj = valobj.GetNonSyntheticValue()
        self.size = 0
        self.capacity = 0
        self.data = None
        self.element_type = None
        self.element_size = 0

    def update(self):
        try:
            self.size = self.valobj.GetChildMemberWithName('m_size').GetValueAsUnsigned(0)
            self.capacity = self.valobj.GetChildMemberWithName('m_capacity').GetValueAsUnsigned(0)
            self.data = self.valobj.GetChildMemberWithName('m_data')

            ptr_type = self.data.GetType()
            self.element_type = ptr_type.GetPointeeType()
            self.element_size = self.element_type.GetByteSize() or 1

            if self.data.GetValueAsUnsigned(0) == 0:
                self.size = 0
        except Exception:
            self.size = 0
            self.capacity = 0
            self.data = None
        return False

    def num_children(self):
        return 2 + int(self.size)

    def get_child_index(self, name):
        if name == '[size]':
            return 0
        if name == '[capacity]':
            return 1
        if name.startswith('[') and name.endswith(']'):
            try:
                return 2 + int(name[1:-1])
            except ValueError:
                return -1
        return -1

    def get_child_at_index(self, index):
        if index < 0 or index >= self.num_children():
            return None

        if index == 0:
            return self.valobj.CreateValueFromExpression('[size]', str(self.size))
        if index == 1:
            return self.valobj.CreateValueFromExpression('[capacity]', str(self.capacity))

        elem_index = index - 2
        offset = elem_index * self.element_size
        return self.data.CreateChildAtOffset('[{}]'.format(elem_index), offset, self.element_type)

    def has_children(self):
        return True


def my_stack_summary(valobj, internal_dict):
    non_synth = valobj.GetNonSyntheticValue()
    size = non_synth.GetChildMemberWithName('m_size').GetValueAsUnsigned(0)
    capacity = non_synth.GetChildMemberWithName('m_capacity').GetValueAsUnsigned(0)

    if size == 0:
        return 'empty stack'
    return 'size={}, capacity={}'.format(size, capacity)

# ---------------------------------------------------------------------------
# Registration
# command script import MyTypesDataFormatters.py
# ---------------------------------------------------------------------------

def __lldb_init_module(debugger, internal_dict):
    cat = 'my_types'
    mod = __name__

    debugger.HandleCommand('type category define {}'.format(cat))

    # MyStack<T>
    debugger.HandleCommand(
        'type summary add -x "^MyStack<.+>$" '
        '-F {mod}.my_stack_summary -w {cat}'.format(mod=mod, cat=cat))
    debugger.HandleCommand(
        'type synthetic add -x "^MyStack<.+>$" '
        '-l {mod}.MyStackSyntheticProvider -w {cat}'.format(mod=mod, cat=cat))

    debugger.HandleCommand('type category enable {}'.format(cat))
    print('[{}] formatters loaded'.format(mod))
Click here to unfold You’ve seen enough. You can close it now.
That’s about 70 lines of Python to explain a class that’s barely longer than that. Load it into LLDB, and the debugger finally shows everything:
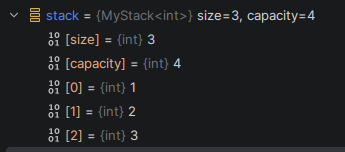
It works. But at what cost? You now own and maintain a formatter that’s harder to read than the type it describes – and that’s for one class. Multiply it across the dozens of types in a real project and the math gets bleak fast.
Natvis to the rescue
If you build with the MSVC toolchain on Windows, none of this is news – Natvis is the standard way to visualize types there, and Rider and CLion have supported it for years. What’s new is that the same files now work on Linux and macOS too. The Natvis you already have now works in more places.
Just take a look at how simple and easy Natvis for the MyStack<T> looks:
<?xml version="1.0" encoding="utf-8"?>
<AutoVisualizer xmlns="http://schemas.microsoft.com/vstudio/debugger/Natvis/2010">
<Type Name="MyStack<*>">
<DisplayString Condition="m_size == 0">empty stack</DisplayString>
<DisplayString Condition="m_size != 0">size={m_size}, capacity={m_capacity}</DisplayString>
<Expand>
<Item Name="[size]">m_size</Item>
<Item Name="[capacity]">m_capacity</Item>
<ArrayItems>
<Size>m_size</Size>
<ValuePointer>m_data</ValuePointer>
</ArrayItems>
</Expand>
</Type>
</AutoVisualizer>
Much easier, right? Just a little XML.
And if you run the debug session with this Natvis, you’ll see this:
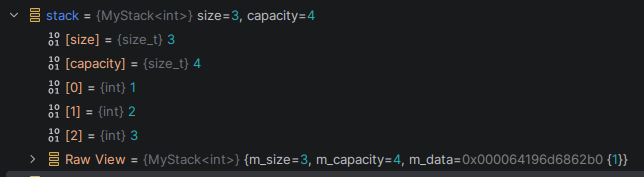
Exactly the same (plus Raw View, but you may always remove it using the HideRawView attribute)!
What Natvis can describe
The stack above uses <ArrayItems>, but that’s one tool of many. Natvis covers most of the data structures you actually write:
- <ArrayItems> – contiguous arrays and pointers
- <IndexListItems> – array-like containers in packed or non-contiguous memory (
std::deque,std::bitset) - <LinkedListItems> – linked lists
- <TreeItems> – tree structures
- <CustomListItems> – anything else, including hash tables, using small expressions to walk the structure
There’s plenty more in the official Natvis documentation, and a complete schema if you want to know exactly what’s valid.
Turning it on
Three steps to get Natvis working on Linux and macOS:
- Use LLDB. Natvis only works with LLDB. Go to File | Settings | Build, Execution, Deployment | Toolchains and confirm the Debugger setting is Bundled LLDB.
- Enable Natvis rendering. it’s off by default. Go to File | Settings | Build, Execution, Deployment | Debugger | Data Views | C/C++ and turn on Enable Natvis renderers for LLDB.
- Point Rider at your Natvis files. The cleanest way is to add them to your CMake project, either as a source on an existing target:
add_executable(example main.cpp src1.cpp MyNatvis.Natvis)
Or you can create a new custom target specifically for Natvis files
add_custom_target(MyVisualizers SOURCES MyNatvis.Natvis)
If you’d rather not touch CMake, add a folder under Additional Directories in the same Data Views | C/C++ settings page.
If everything’s set up but nothing renders, the debugger most likely hit a syntax error in a Natvis file and silently gave up. Turn on Natvis diagnostics (same settings page) and check the Debugger Output (LLDB) tab — the parse error will be there.
You probably already use Natvis
This isn’t a feature you have to start from scratch with. A lot of the C++ ecosystem already ships Natvis, much of it in game development:
- Godot Engine and the godot-cpp extension
- Flax Engine
- JoltPhysics – physics and collision detection
- Box2D – 2D physics
- Dear ImGui – immediate-mode GUI
- Bgfx – cross-platform rendering
- EnTT – entity component system
- Magnum – graphics middleware for games and data visualization
If you depend on any of these, their visualizers now light up in Rider on Linux and macOS with no extra effort from you.
What works, and what’s still coming
Honesty about the edges. Under the hood, our Natvis support is itself a set of advanced LLDB data formatters that parse your .natvis files and lean heavily on LLDB’s expression evaluator to do it.
On Windows, that evaluator is ours. We maintain a custom fork of LLDB 9 with hundreds of patches, and in Rider 2026.1 we rewrote the expression evaluator specifically for Natvis from scratch – the same work that made Unreal Engine variable inspection up to 87 times faster.
On Linux and macOS, we’re on upstream LLDB 21 which means none of those improvements are there yet. Natvis on these operating systems uses the standard LLDB expression evaluator instead.
For most types, that works fine. The special cases are the Natvis files that push into the most advanced features, and Unreal Engine is the prime example: its Natvis is complex enough that it doesn’t work flawlessly on Linux and macOS yet. Bringing the new Windows LLDB 9 evaluator over to LLDB 21 is on the roadmap, but it’s a big piece of work. For now, you’re welcome to try Unreal Engine Natvis on those platforms – just expect some rough edges. And the existing Unreal Engine LLDB data formatters still work there too, so if you enable Natvis on an Unreal Engine project, the two run side by side.
Already have your own data formatters? Keep them.
If you’ve written LLDB data formatters that work well for you, Natvis won’t step on them. Natvis has the lowest priority of any user-defined formatter — wherever one of your formatters already handles a type, Natvis stays out of the way. You can adopt it gradually, type by type, without throwing anything away.
Try it
Natvis on Linux and macOS is available in Rider 2026.2. Point it at the Natvis files you already have, flip the two settings discussed above, and watch your types start making sense.
Helpful links
- CLion documentation for Natvis configuring
- Official Natvis documentation
- Complete Natvis file schema
Subscribe to a monthly digest curated from the .NET Tools blog: