

惯性聚合 高效追踪和阅读你感兴趣的博客、新闻、科技资讯
阅读原文 在惯性聚合中打开

推荐订阅源

A
About on SuperTechFans
G
Google Developers Blog
L
LangChain Blog
aimingoo的专栏
aimingoo的专栏
OSCHINA 社区最新新闻
OSCHINA 社区最新新闻
云风的 BLOG
云风的 BLOG
小众软件
小众软件
月光博客
月光博客
Recent Announcements
人人都是产品经理
人人都是产品经理
P
Proofpoint News Feed
博客园 - 聂微东
让小产品的独立变现更简单 - ezindie.com
雷峰网
雷峰网
The Cloudflare Blog
博客园_首页
美团技术团队
大猫的无限游戏
大猫的无限游戏
B
Blog
IT之家
IT之家
Jina AI
Jina AI
H
Hackread – Cybersecurity News, Data Breaches, AI and More
C
Check Point Blog
钛媒体:引领未来商业与生活新知
钛媒体:引领未来商业与生活新知

BloombergNEF

Japan's Energy Transition Enters New Phase Shaped by Rising Electricity Demand and Energy Security Needs, Per BloombergNEF's New Energy Outlook 2026: Japan | BloombergNEF Global Gas Turbine Manufacturing Outlook: Crunch, for Now | BloombergNEF Global Gas Turbine Manufacturing Outlook: Crunch, for Now | BloombergNEF BloombergNEF’s South Africa Transition Factbook: Power-Market Reform and Private Investments Drive Energy Transition | BloombergNEF test social MENA Clean Energy Market Outlook 2026 | BloombergNEF Six Months In: The Iran War’s Global Impact | BloombergNEF Renewable Energy Investments Show One Booming Sector | BloombergNEF Bank of America’s ‘Robust’ AI Data Center Deal Pipeline: Q and A | BloombergNEF test social Six Things to Know About BNEF’s New US Data Center Capacity Outlook | BloombergNEF Sustainable Aviation Fuel Price Outlook: Leveling Off | BloombergNEF Solar Set to Rule World’s Power Supply: Three Things to Know | BloombergNEF Energy Transition Impacts: Sector and Country Impacts from a Demand-Driven Model | BloombergNEF BloombergNEF Turkey Transition Factbook 2026: Clean Power Growth Positions Turkey for the Next Phase of Its Energy Transition | BloombergNEF Competitiveness, Cost and Climate: Five Themes From the BNEF Summit Amsterdam | BloombergNEF Electric Vehicle Outlook | BloombergNEF BloombergNEF’s Electric Vehicle Outlook 2026: Global EV Sales Set For Another Record-Breaking Year, But Growth in Some Major Markets Slows | BloombergNEF Mexico Transition Factbook 2026 Have Oil Prices Already Peaked? Three Things to Know Liebreich: The Great Clean Energy Acceleration 2.0 Global Clean-Energy Trade Rebounds to $479 Billion in 2025 Despite Tariffs and Geopolitical Turmoil: BloombergNEF New Energy Outlook 2026 New Energy Outlook 2026 BloombergNEF’s New Energy Outlook 2026: Transition to Newer Technologies, Expanded Electrification to Strengthen Nations’ Energy Security Energy Transition Bank Financing Struggles to Pull Ahead of Fossil Fuels in Asia Data Centers and the Future of Energy Storage Data Centers and the Future of Energy Storage Energy Storage Enters the 100-Gigawatt Era: Three Things to Know AI Data Centers, Energy and Finance: Dispatch from the BNEF Summit New York 2026
EU Carbon Border Tariff Is Reshaping Industrial Trade Flows
iterhorst · 2026-04-21 · via BloombergNEF

Importing emissions-intensive products into the European Union just got a lot more expensive.

The EU’s carbon market, known as the Emissions Trading System (ETS), is already forcing domestic producers to pay for the carbon they emit.

That could put them at a disadvantage compared with producers outside the bloc. In an effort to equalize this footing, the bloc has instated the Carbon Border Adjustment Mechanism, or CBAM, under which importers must purchase certificates reflecting the embedded emissions of their products.

The mechanism covers selected goods from six emissions-intensive sectors: iron and steel, aluminum, cement, fertilizers, hydrogen and electricity. Importers will face a phased exposure to these costs, aligned with the gradual reduction of free allowances for domestic producers under the ETS.

The policy entered its pricing phase on Jan. 1, 2026. But it remains unclear just how much many importers will need to pay.

Emissions intensity remains the key driver of CBAM costs

CBAM obligations depend on multiple factors, including embedded emissions of products, market of origin, EU ETS prices and production processes. Among these, emissions values – whether based on European Commission data or verified figures – are likely to be the most significant driver of cost differences across suppliers.

The figure below shows a simplified version of the equation that underpins obligation calculations.
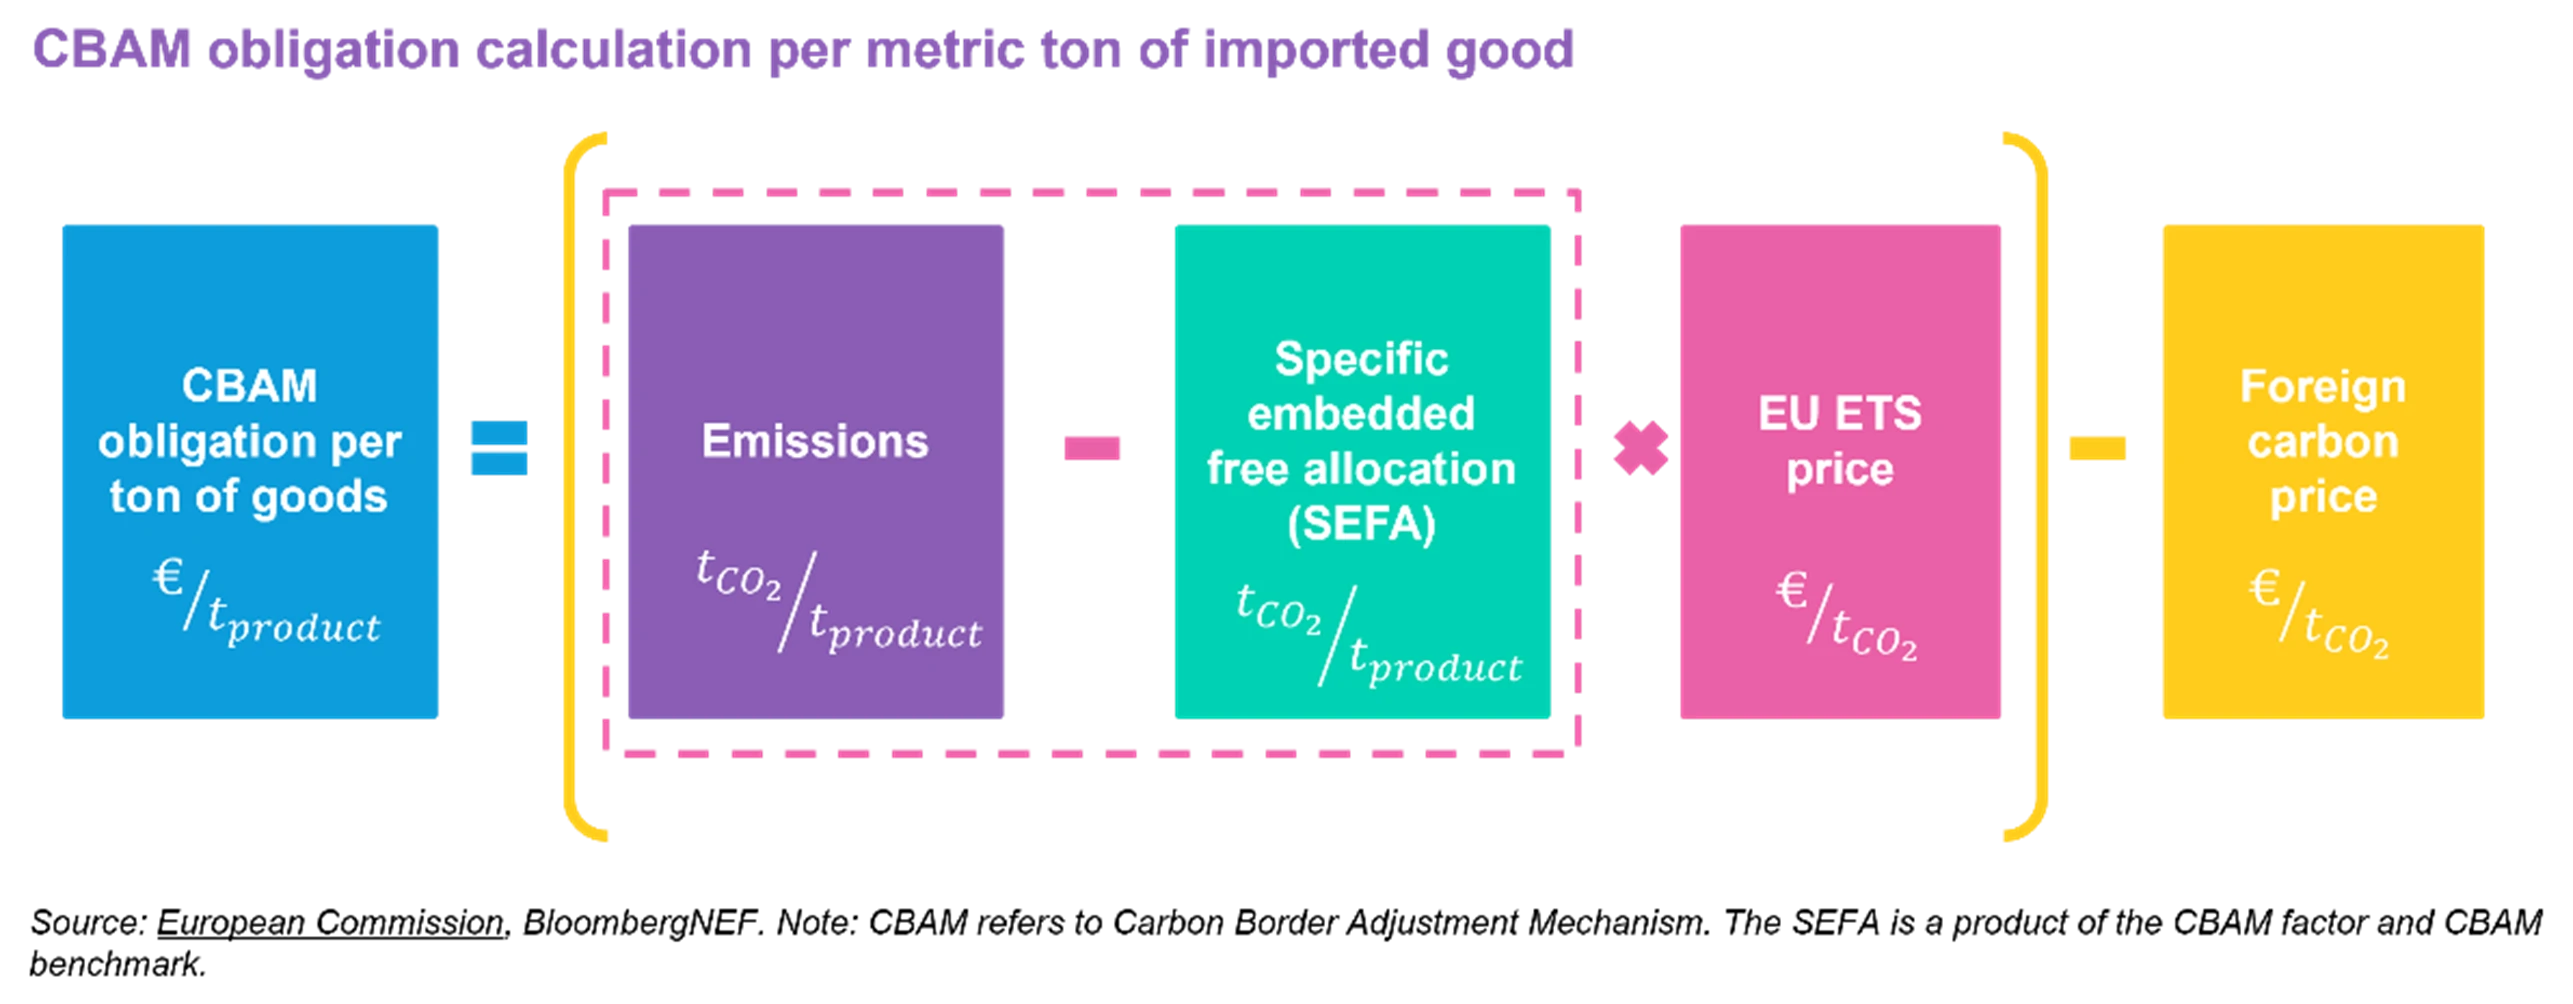
Importers unable to verify their own emissions data will be charged according to default values provided by the European Commission. These could prove to be punitively high – as much as 1.3 times the current import value for goods like cement and clinker. The idea is to encourage companies to report the actual emissions of their products, but it could create a new hierarchy for competitiveness, where verified low-carbon producers could displace unverified or highly polluting suppliers.

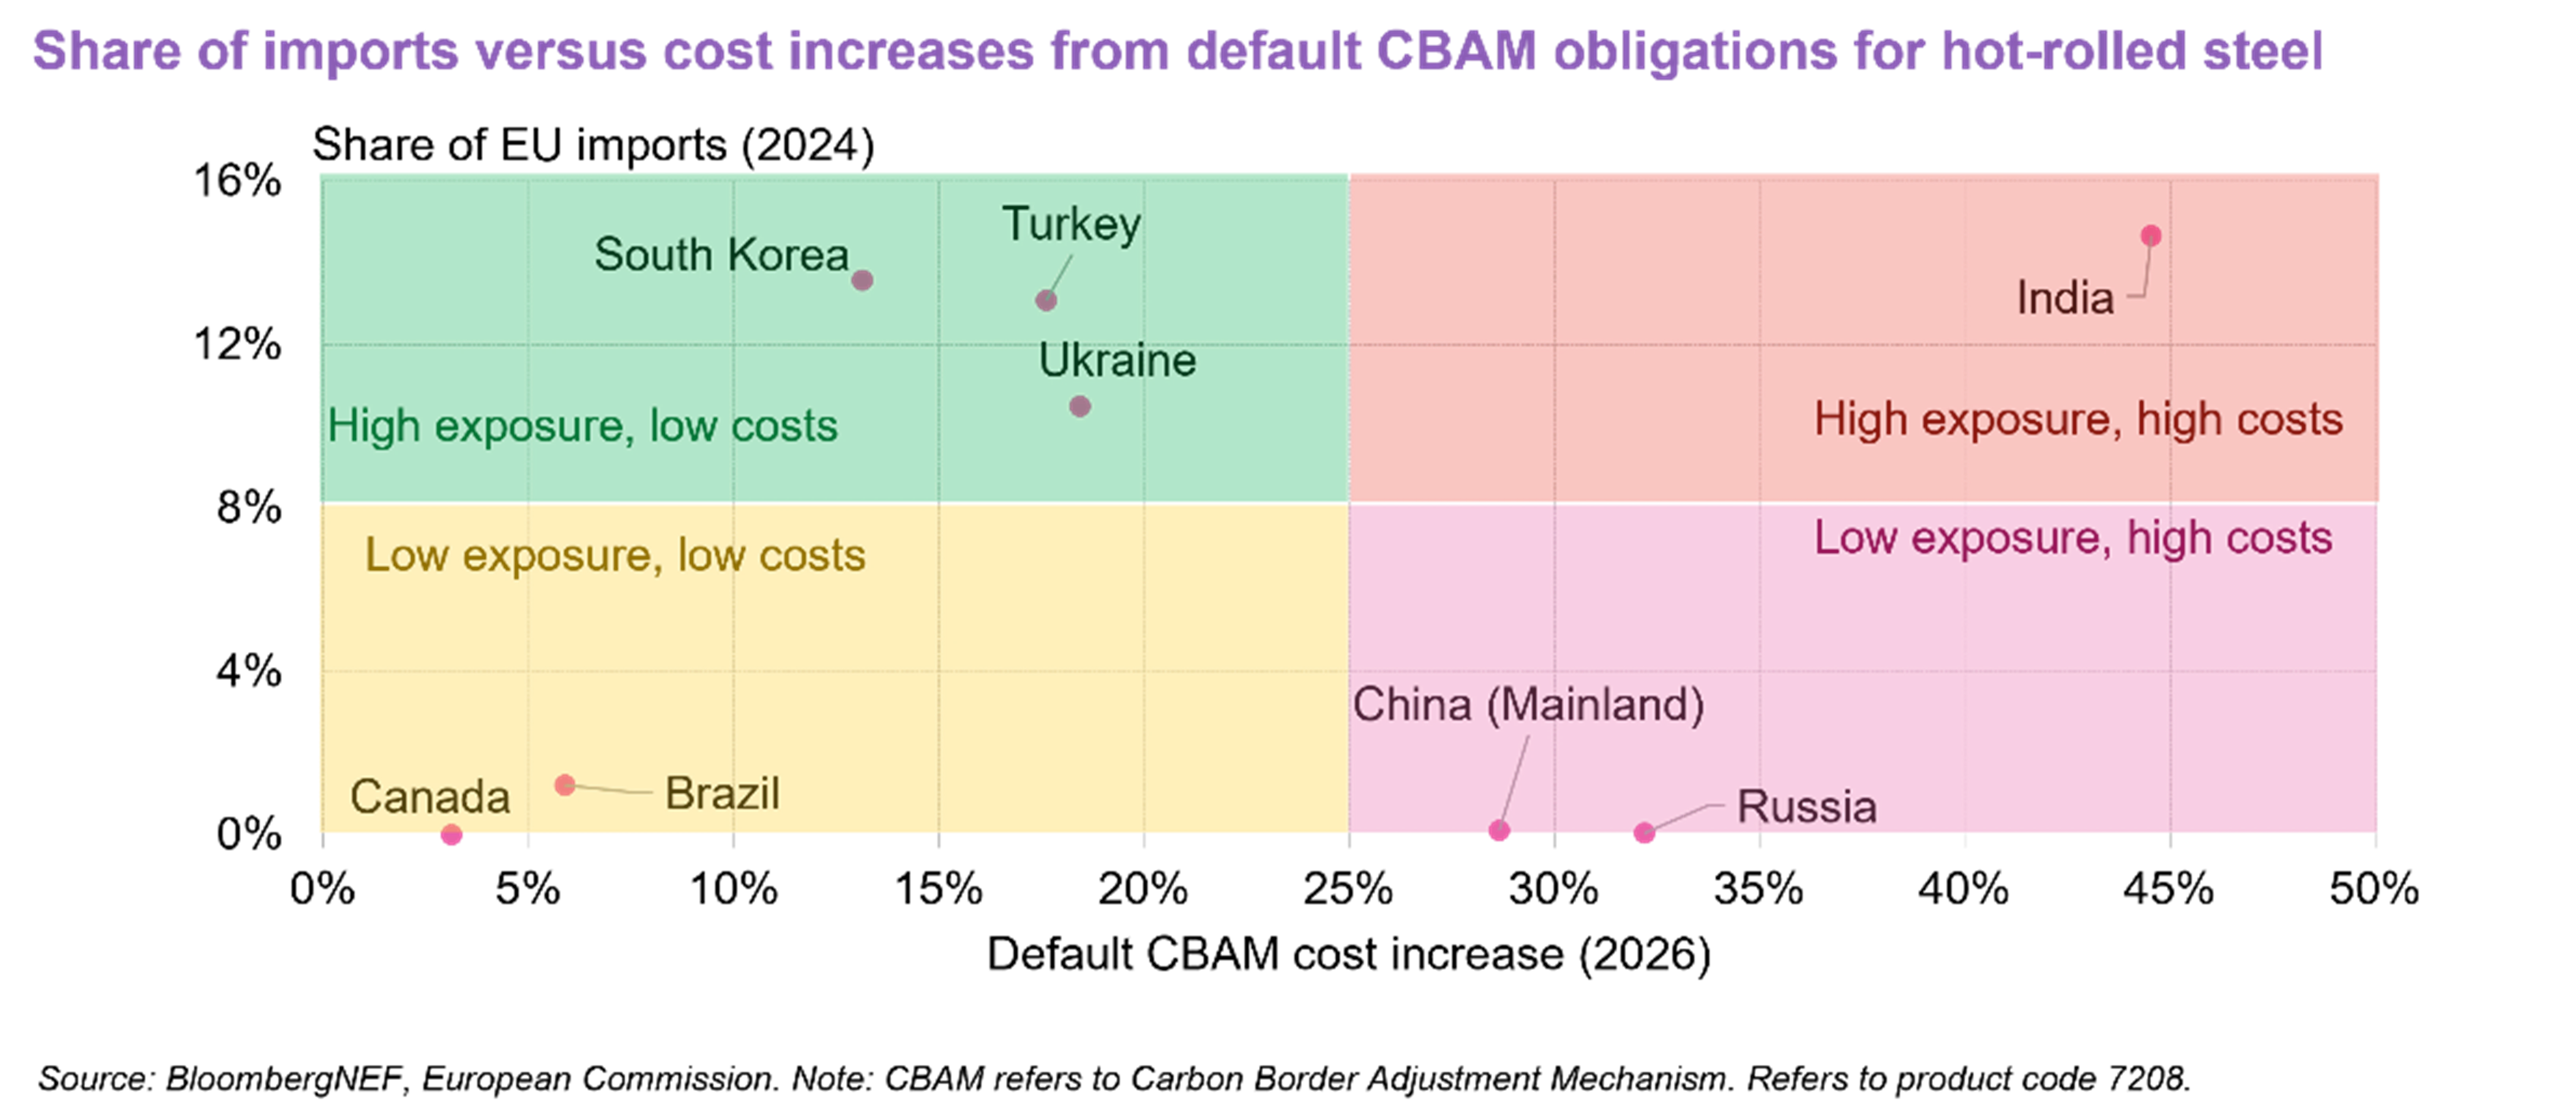
Default obligations also have an uneven impact across markets.

For example, India supplied about 15% of the hot-rolled steel products imported into the EU in 2024 but faces one of the highest default obligations, with costs up to €293 ($343) per metric ton in 2026. By contrast, markets such as South Korea and Turkey face lower default costs but hold similar export shares.
Clients can use BloombergNEF’s EU CBAM Obligation Calculator (EUCBAM 1.0.2) to estimate potential costs across affected products and markets. This Excel-based tool enables users to compare outcomes by market, product, year and carbon pricing scenario.

The video below provides a brief overview of how to use the tool.

Related Content

The latest from BloombergNEF delivered to your inbox

Sign up for BNEF’s free newsletter.