


 Had a pretty interesting case with monitoring LLM costs through LiteLLM when using multiple providers.
What we have:
The monitoring stack is VictoriaMetrics, VictoriaTraces and VictoriaLogs, so, of course, all query examples will use MetricsQL or LogsQL. Although the MetricsQL queries can be used with Prometheus as well – I don’t think I used any VictoriaMetrics-only functions here.
I wrote about LiteLLM monitoring in LiteLLM: monitoring with VictoriaMetrics – alerts and Grafana and LiteLLM: metrics, traces and integration with VictoriaMetrics Stack.
Now to the issue itself.
Contents
I started setting up LiteLLM Budgets (I’ll write about them separately), and while building a Grafana dashboard with spend graphs, I noticed a sharp spike for one of our services.
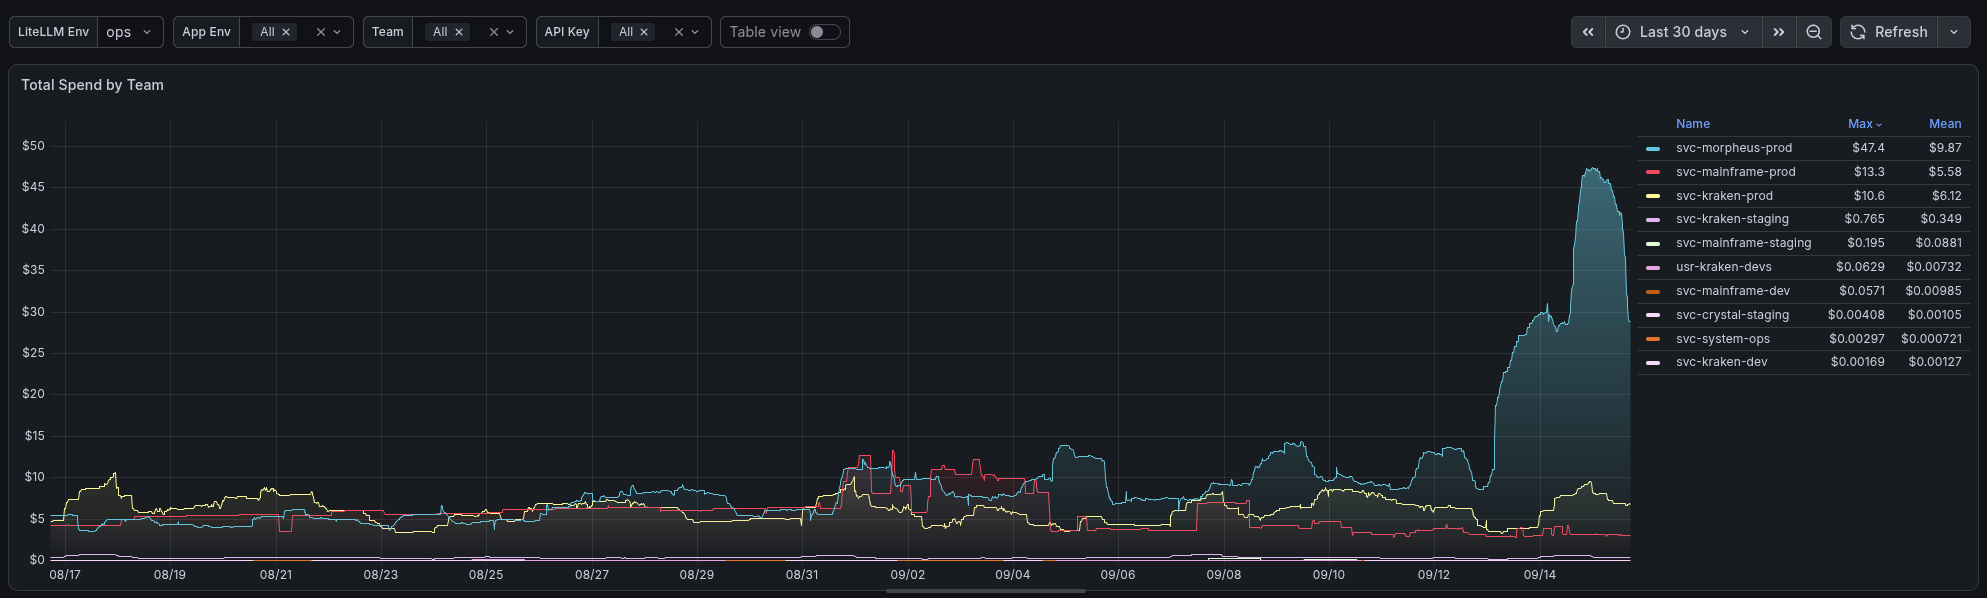
The query:
sum(increase(litellm_spend_metric_total{api_key_alias="svc-morpheus-prod"}[24h]))
So – how I debugged it and what I found.
With graphs and query examples for VictoriaMetrics and VictoriaTraces.
The first thing that comes to mind – a spike in requests or tokens, right?
Let’s check requests:
sum(
  increase(
    litellm_requests_metric_total{
      api_key_alias="svc-morpheus-prod"
    }[24h]
  )
)
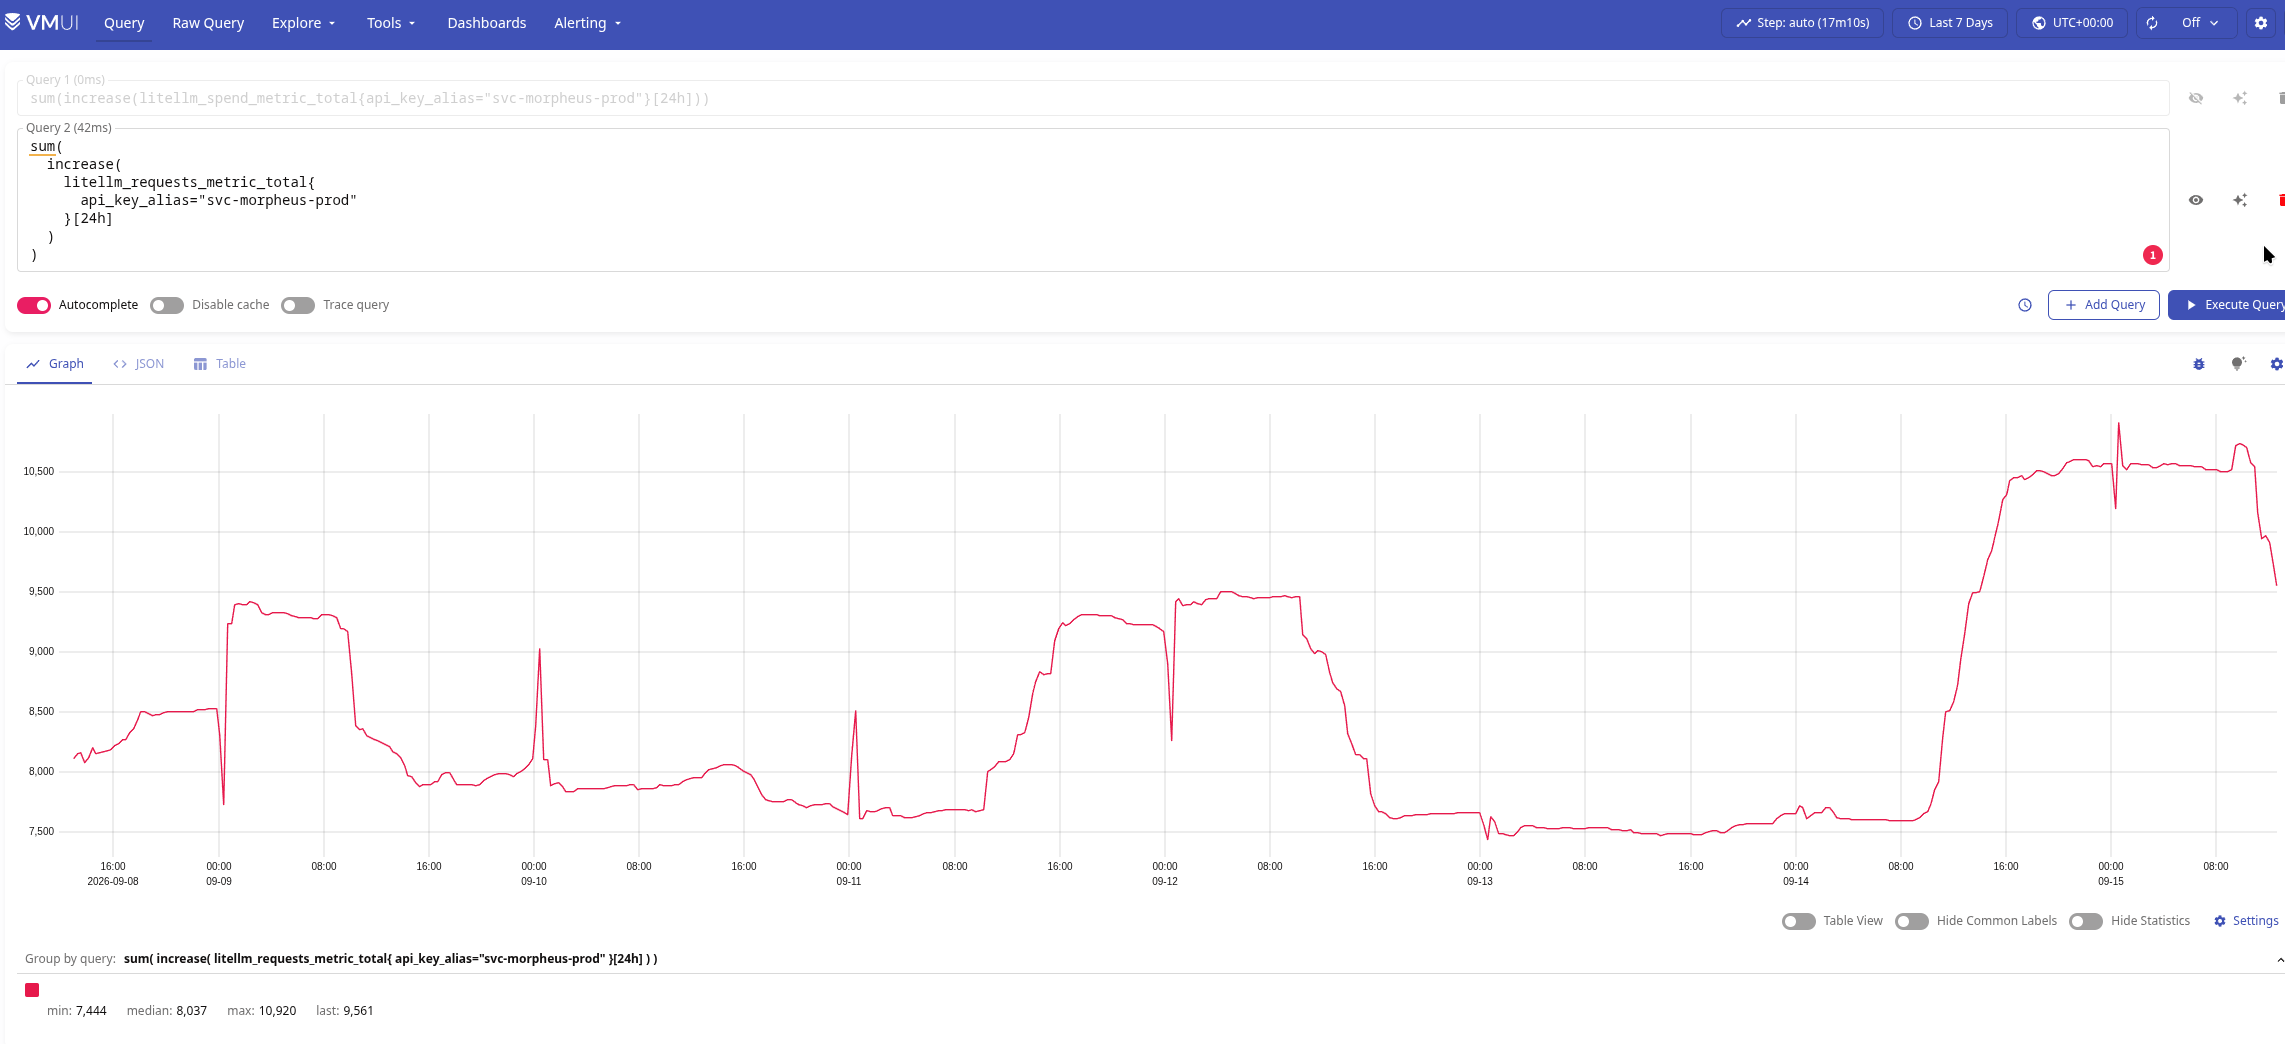
The number of requests is growing – but there is no several-times spike like on the spend graph.
Okay – tokens? Let’s check:
sum(
  increase(
    litellm_total_tokens_metric_total{
      api_key_alias="svc-morpheus-prod"
    }[24h]
  )
)
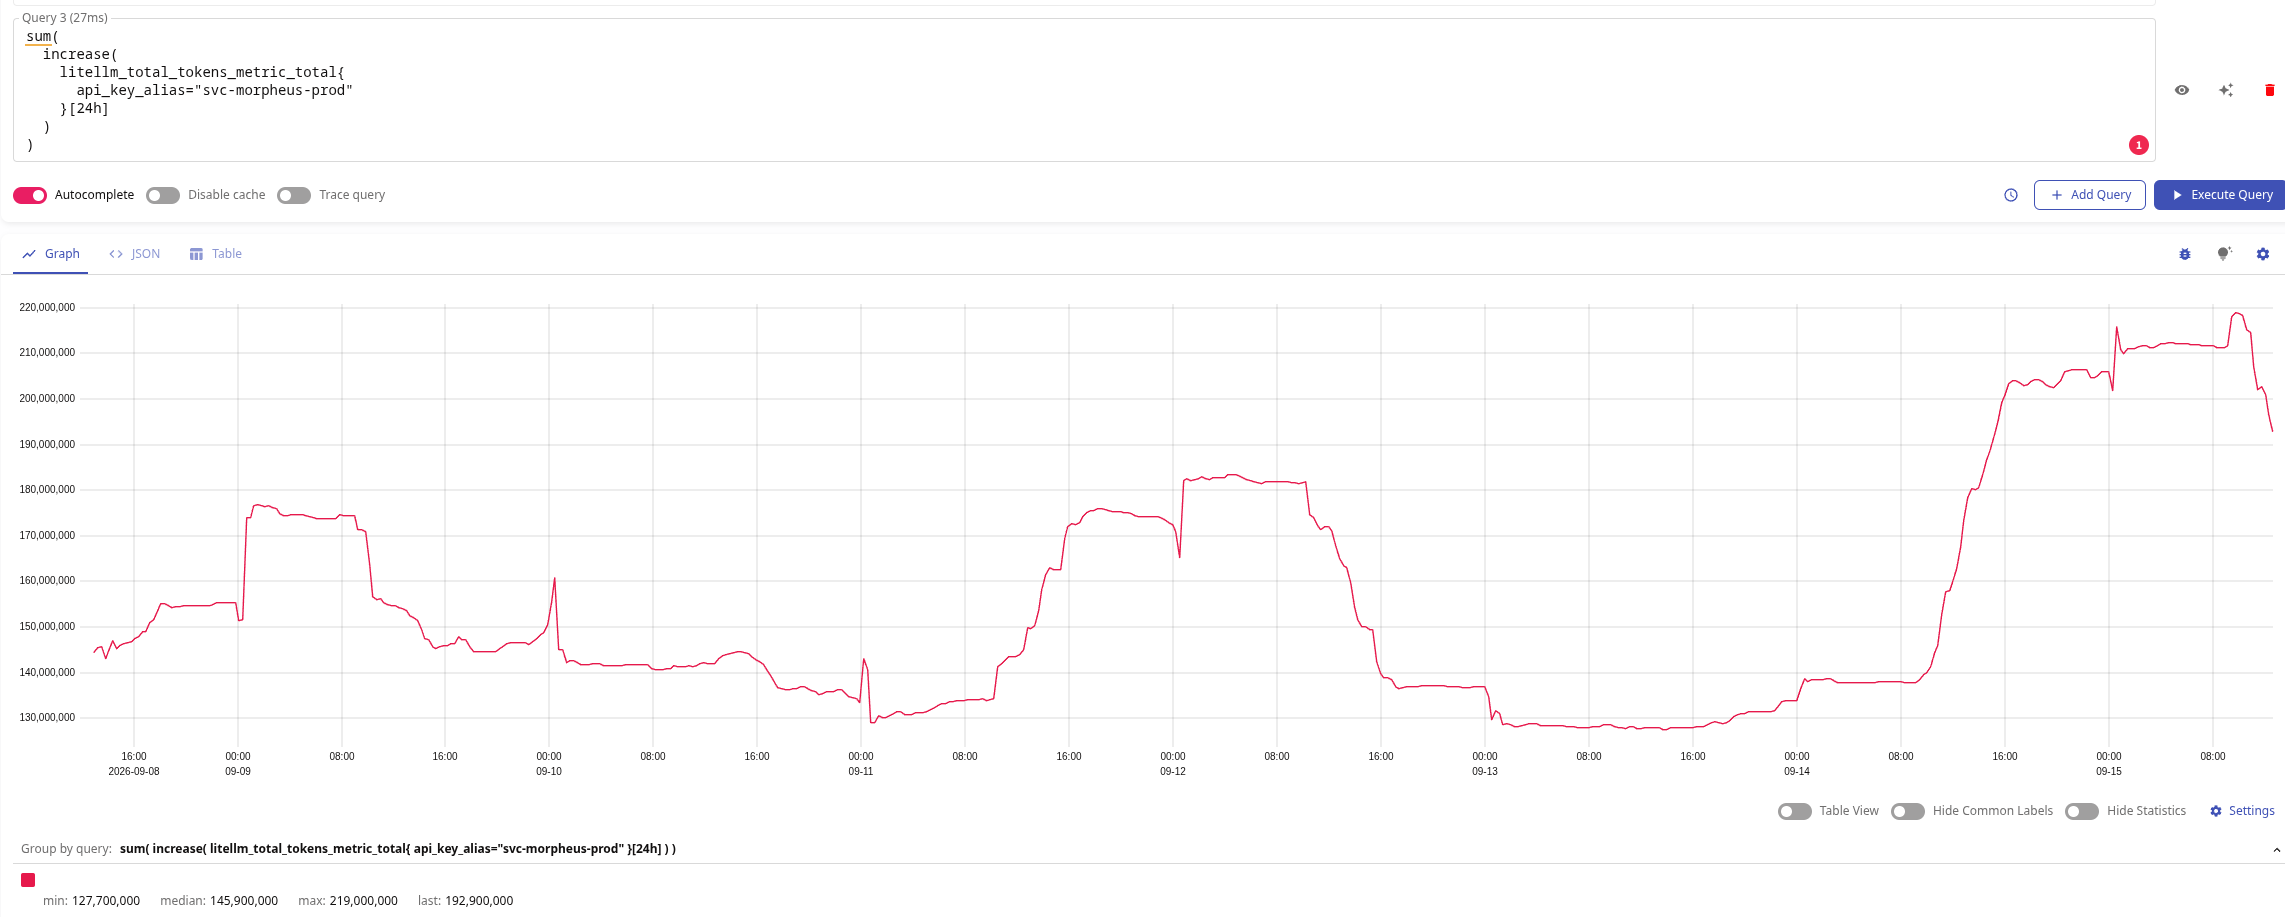
Nope.
Yeah – there is a spike over the last few days too, but not several times over like on the cost graph.
Maybe LiteLLM and the litellm_spend_metric_total metric are lying? I was getting close here – but didn’t know it yet 🙂
Let’s check data from our own exporter, which collects it directly from the OpenAI API, see Golang: creating an OpenAI Exporter for VictoriaMetrics (although now we already have another version in Python, but I haven’t written about it):
max(
  openai_cost_usd_today_total{
    project="litellm-prod"
  }
)
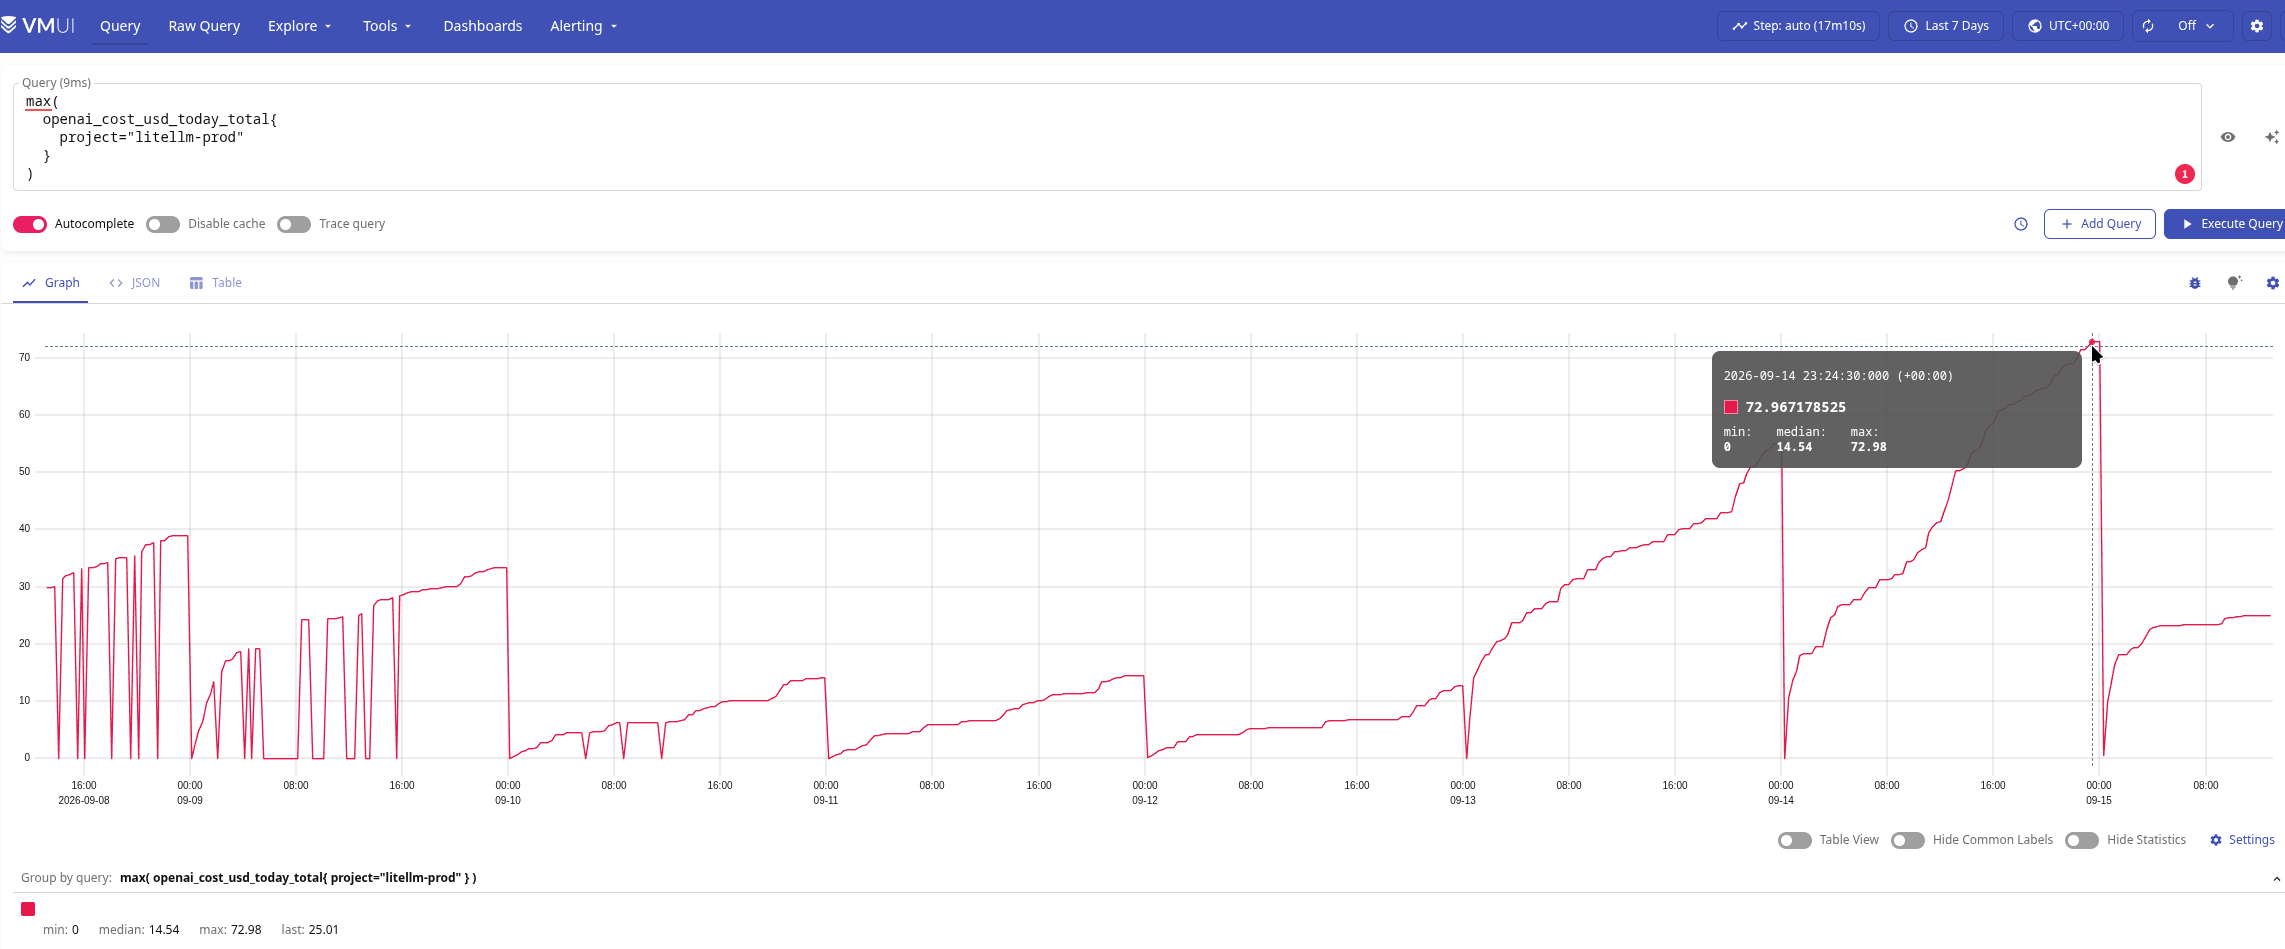
We see 72 for the 14th, while before that spending was around 30-40 dollars.
Let’s compare that with the OpenAI Platform Admin Page itself:
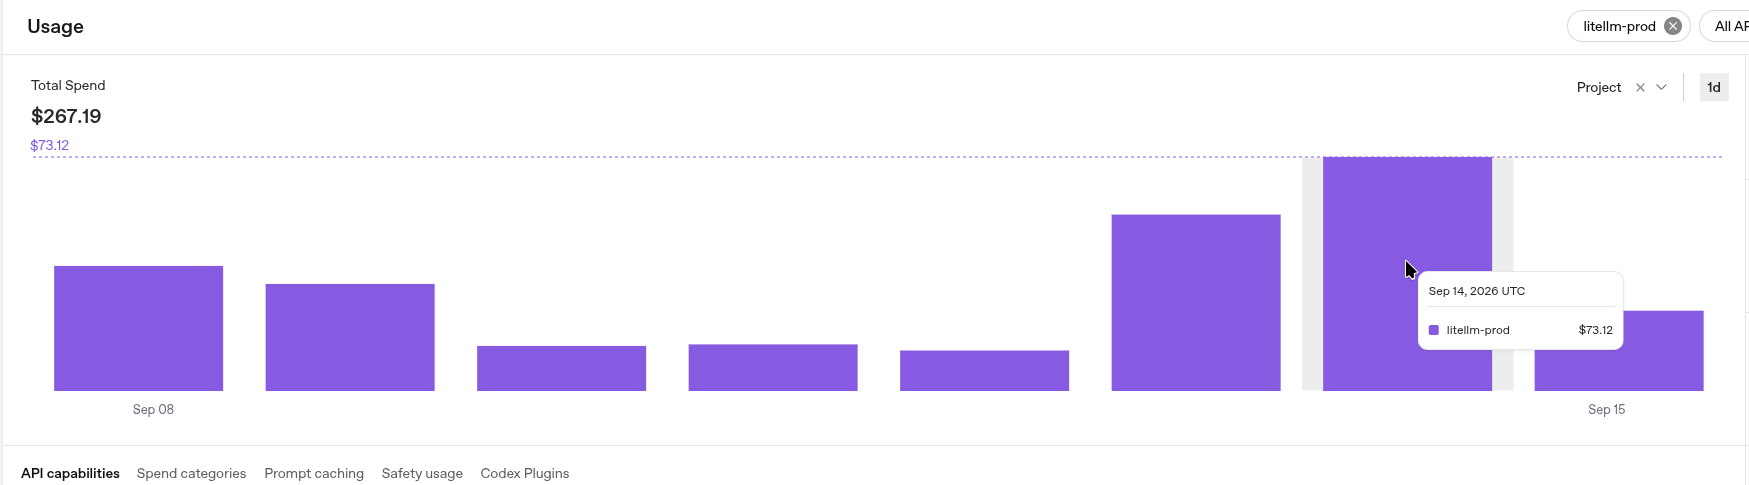
Everything matches the openai_cost_usd_today_total, and yes – OpenAI spending increased noticeably starting around the 13th-14th.
Why?
Next I thought the developers had switched the model and started using some very expensive one. That was actually true, but it wasn’t the problem – it was already a “side effect” affecting the spend graph.
Let’s check the model names used for Morpheus requests:
sum(
  increase(
    litellm_spend_metric_total{
      api_key_alias="svc-morpheus-prod"
    }[1h]
  )
) by (requested_model)
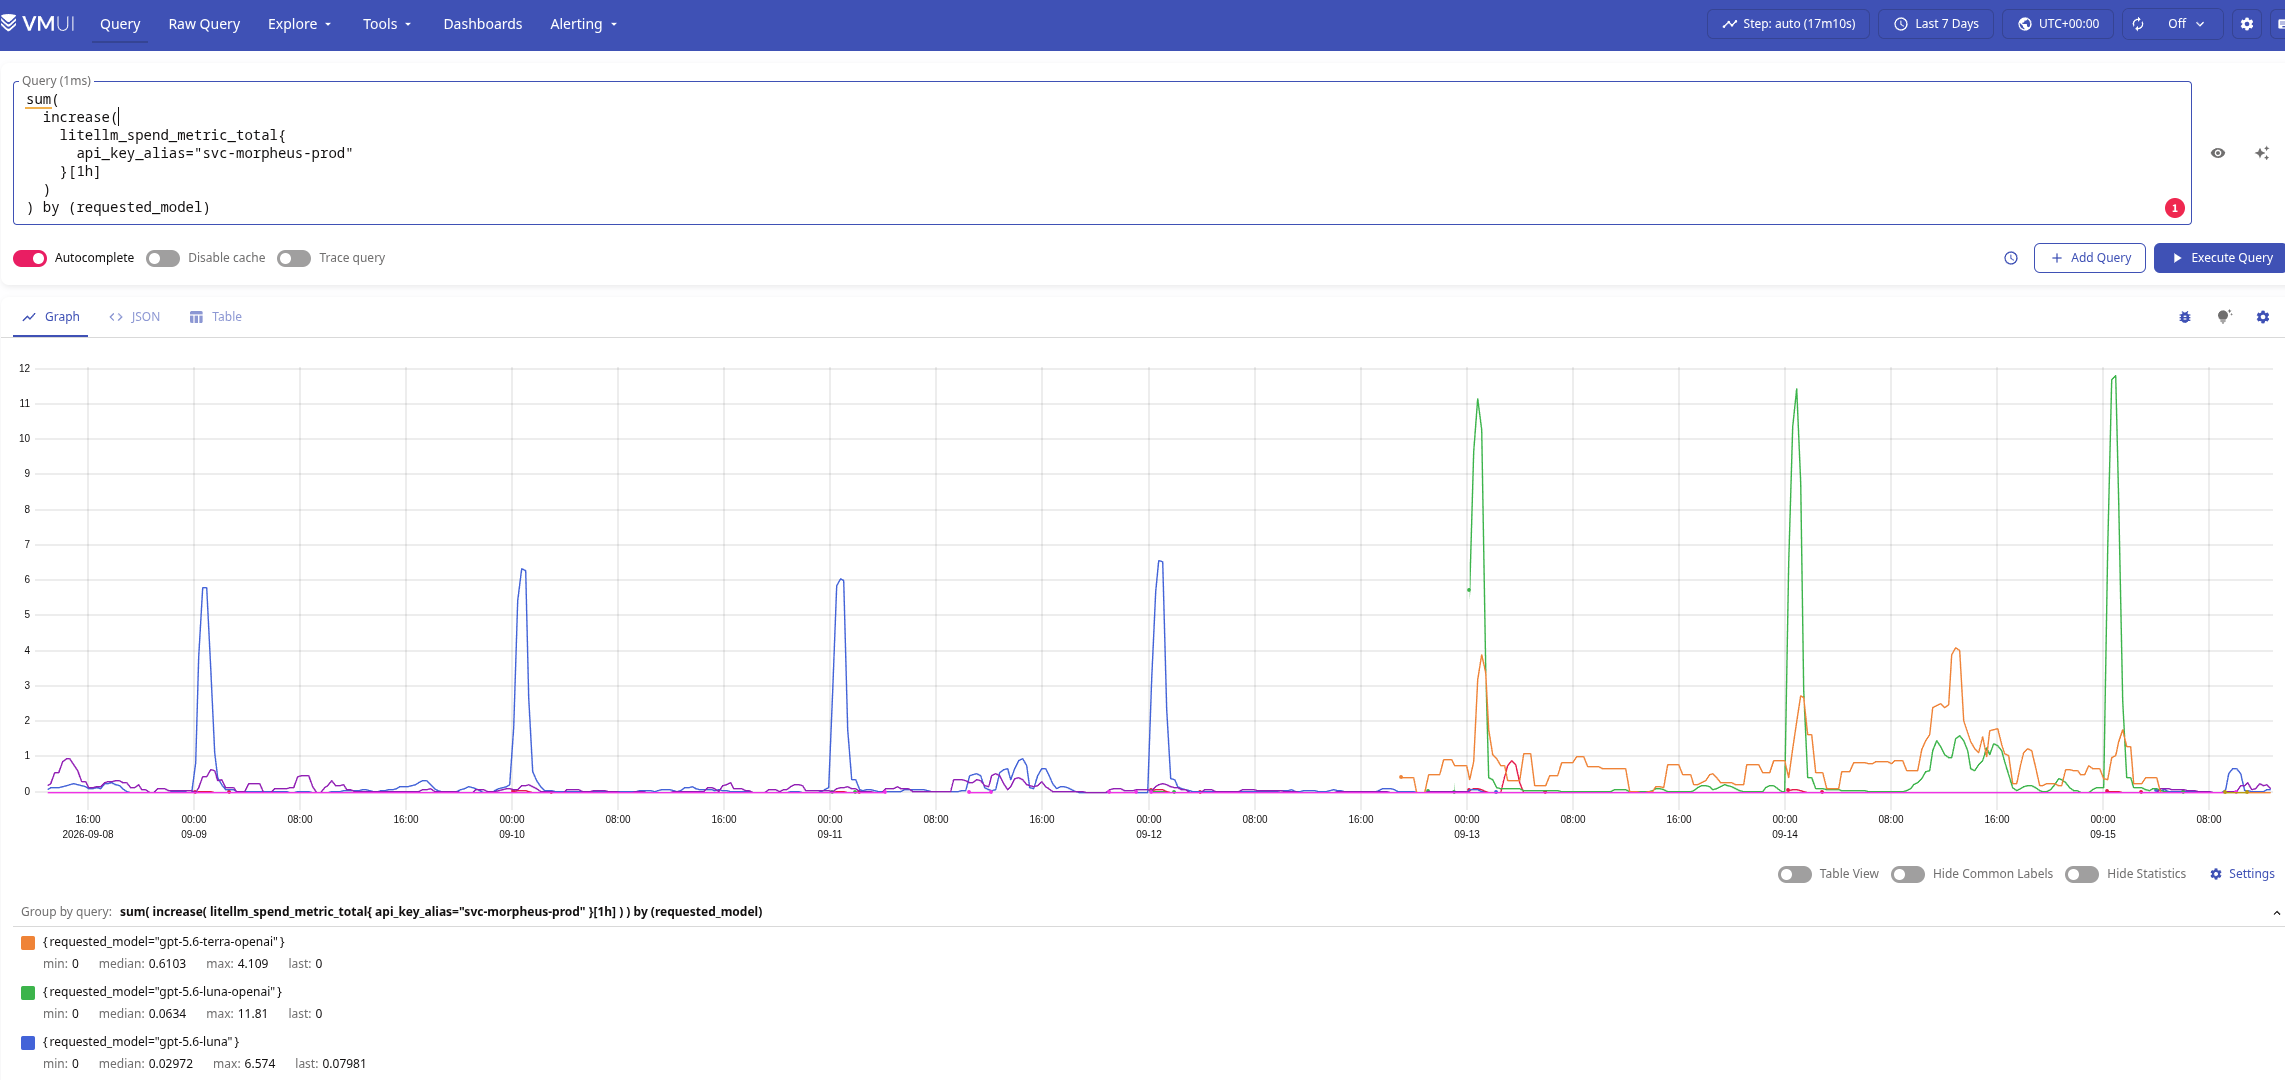
And here we already see something interesting:
The trick with the names here is that *-openai means fallback models in LiteLLM: gpt-5.6-luna is a request to OpenRouter, while gpt-5.6-luna-openai is a fallback to OpenAI:
...
    router_settings:
      enable_tag_filtering: true
      fallbacks:
        # OpenRouter primary → direct OpenAI
        - {"gpt-5.6-terra": ["gpt-5.6-terra-openai"]}
        - {"gpt-5.6-luna": ["gpt-5.6-luna-openai"]}
...
I wrote more about fallbacks in LiteLLM: OpenRouter and Fallbacks configuration.
So, it turns out that starting from the 13th, requests to OpenRouter began to be handled through the direct OpenAI fallback.
Let’s check by the api_provider:
sum(
  increase(
    litellm_requests_metric_total{
      api_key_alias="svc-morpheus-prod"
    }[24h]
  )
) by (api_provider)
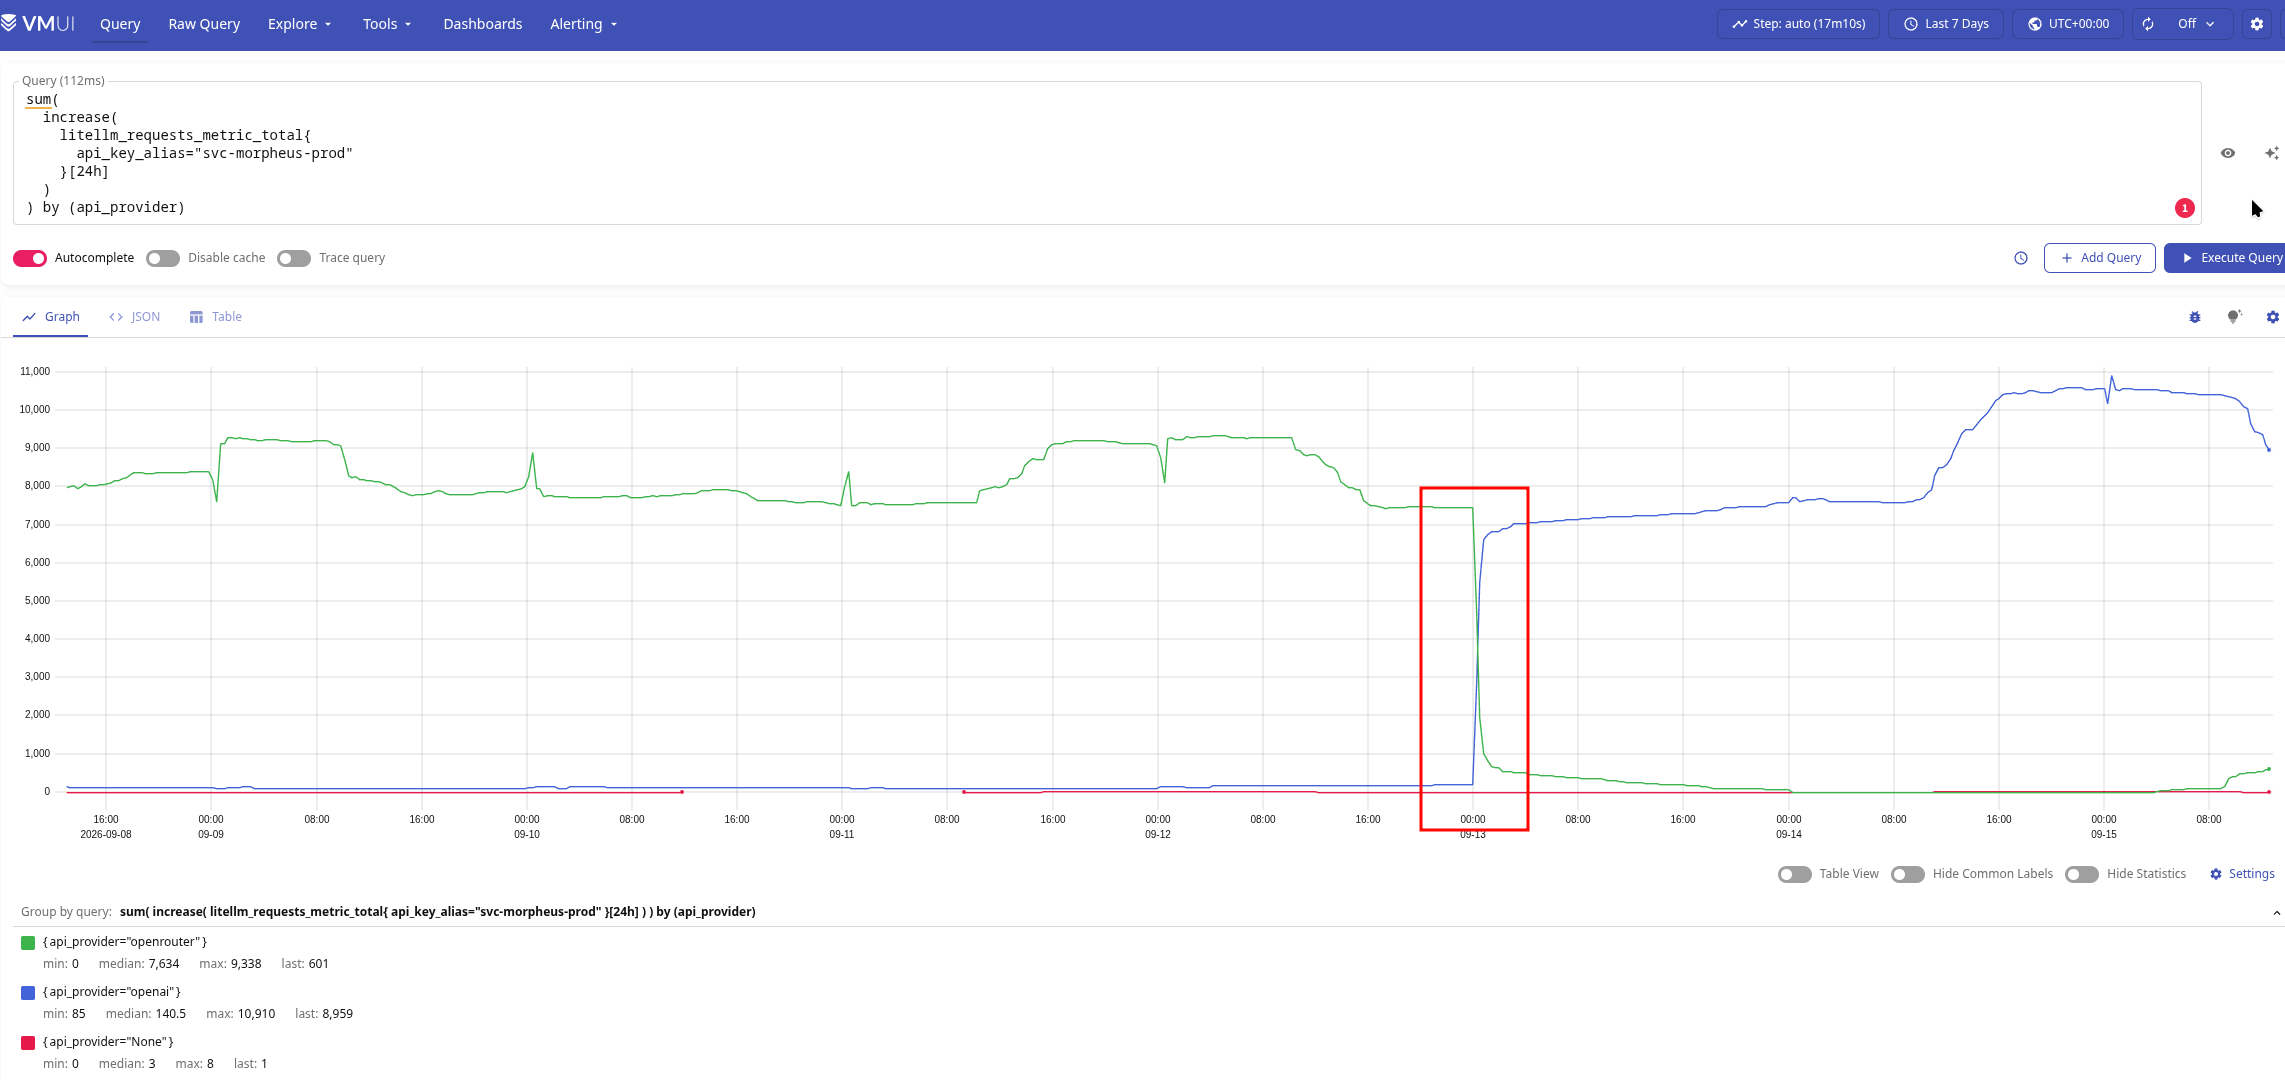
Surprise…
Let’s check fallback activations:
sum(
  increase(
    litellm_deployment_successful_fallbacks_total{
      api_key_alias="svc-morpheus-prod"
    }[24h]
  )
) by (
  requested_model,
  fallback_model,
  exception_class,
  exception_status
)
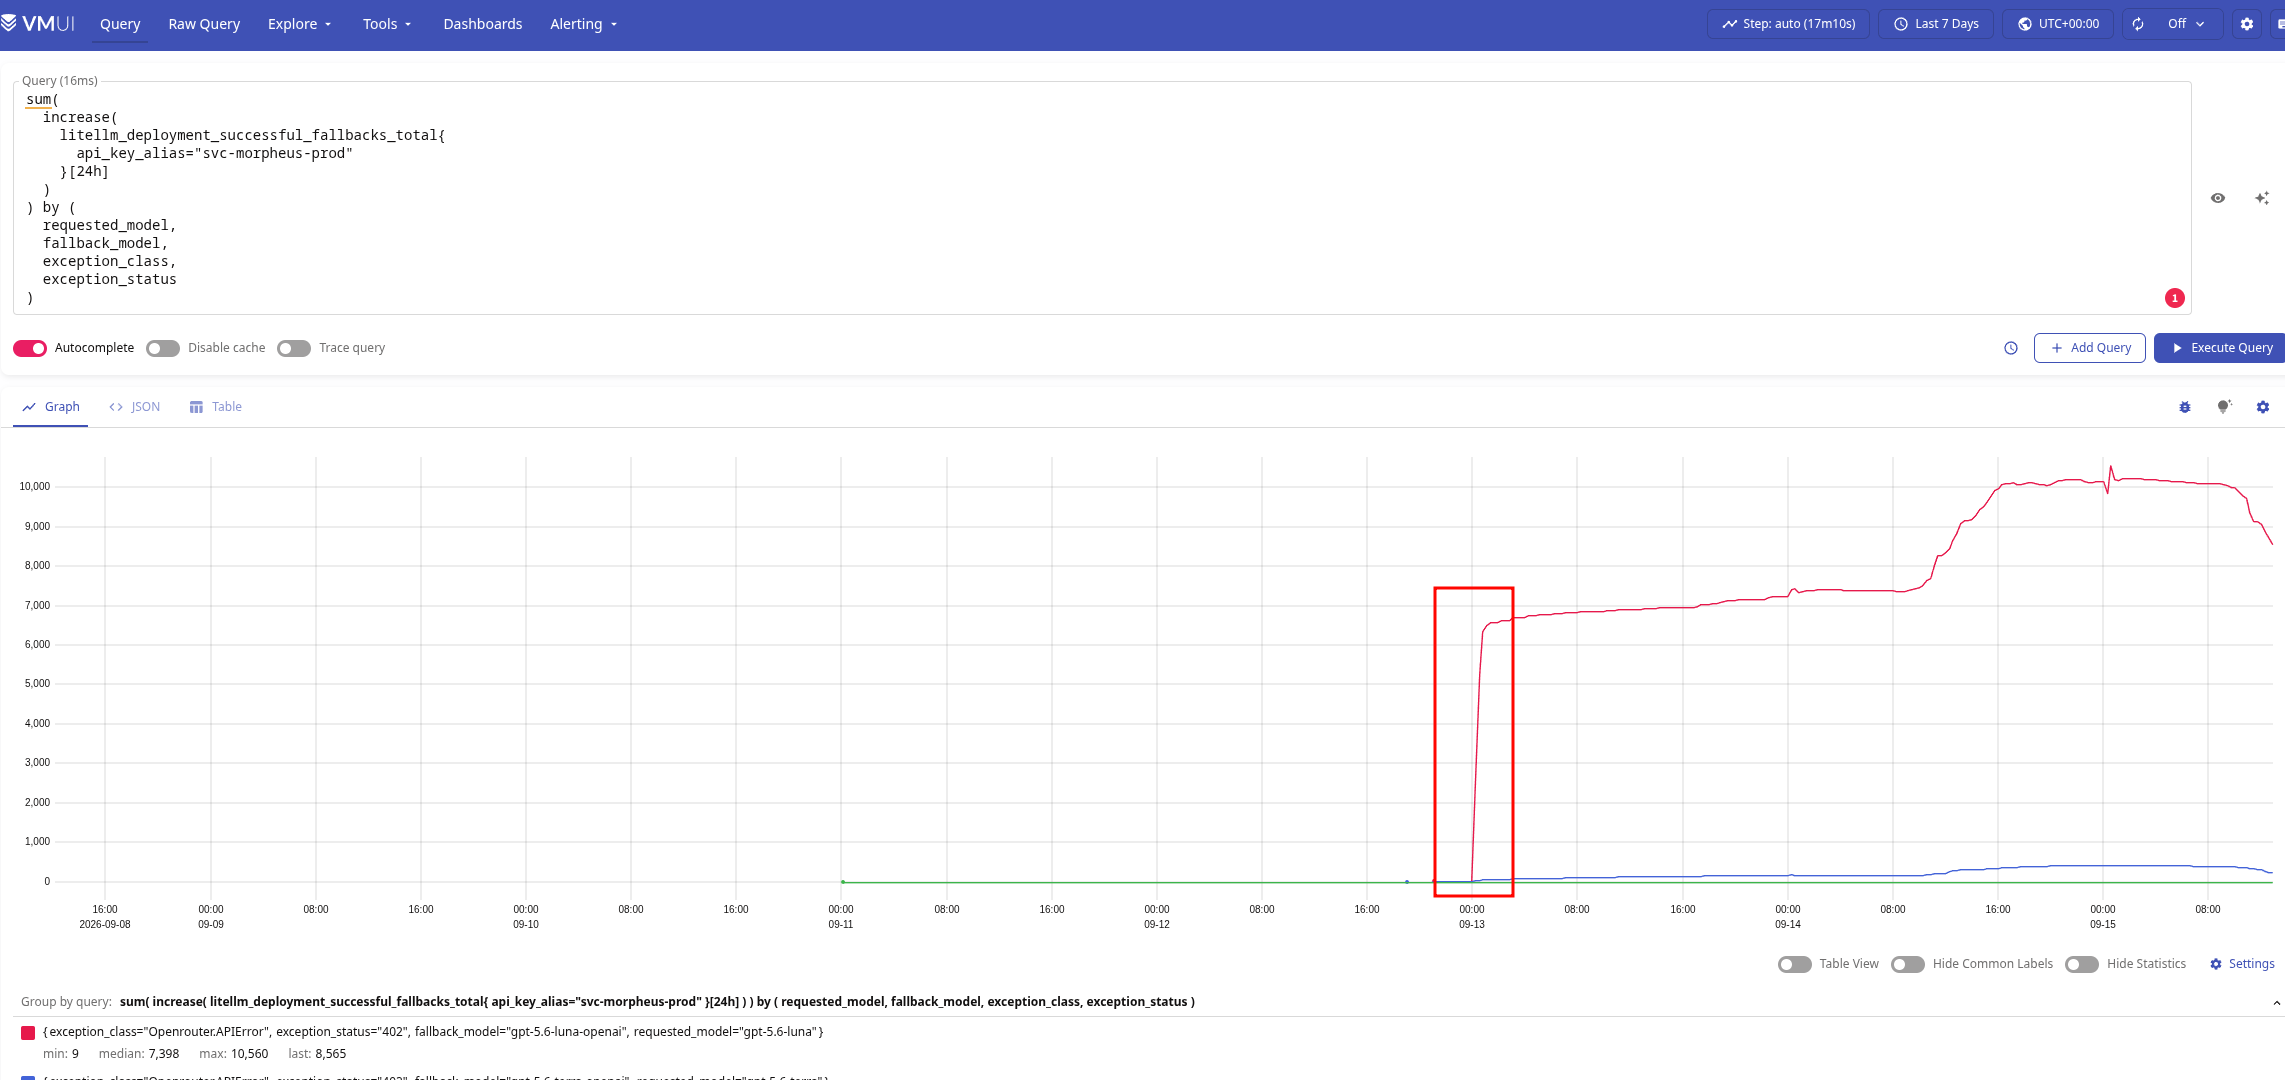
Yeah – starting from the 13th, we are constantly falling back.
Why exactly – we can check LiteLLM traces (VictoriaTraces query):
{
  resource_attr:service.name="litellm",
  name=~"^chat gpt-5.6-(luna|terra)$"
}
_time:4d
"span_attr:litellm.metadata.user_api_key_alias":="svc-morpheus-prod"
"event:event_attr:exception.message:0":*
| stats by (
    "event:event_attr:exception.type:0",
    "event:event_attr:exception.message:0"
  )
    count() as errors
| sort by (errors) desc
| limit 50
Where we can see the reason:
litellm.APIError: APIError: OpenrouterException – {“error”:{“message”:”This request requires more credits, or fewer max_tokens. You requested up to 16384 tokens, but can only afford 1549. To increase, visit https://openrouter.ai/settings/credits and add more credits”,”code”:402,”metadata”:{“limit_source”:”openrouter_credits”,”remedy_hint”:”Add credits at https://openrouter.ai/settings/credits, or lower max_tokens / prompt size to fit your remaining balance.”,”provider_name”:null}}
No money in the account?
So what do we have with credits?
For OpenRouter we have our own exporter, similar to the OpenAI one – let’s see what it says:
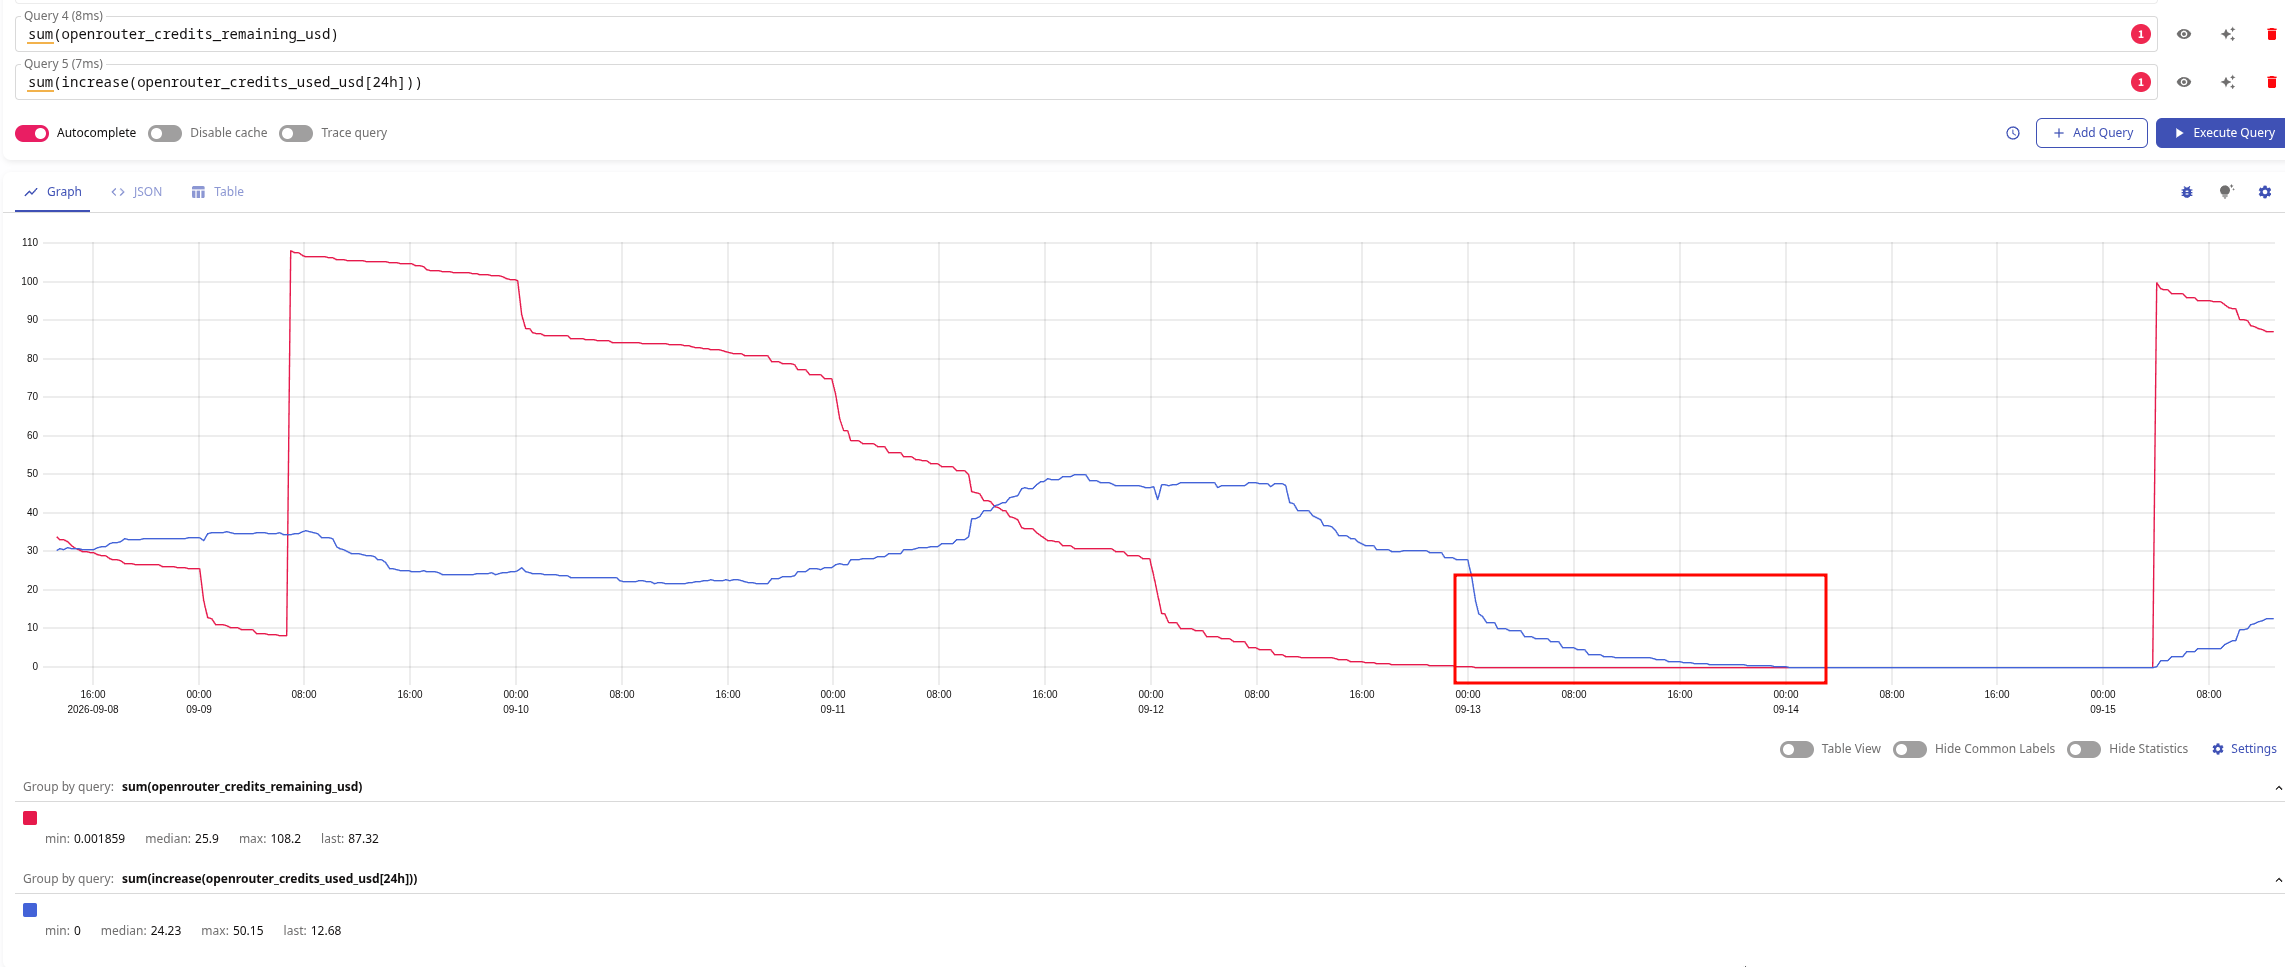
Indeed – our OpenRouter account simply ran out of money.
The funny thing is, the alerts were there – but we successfully f*cked them up.
Note: this is obviously not okay, but one of the perks of working at a startup that is not yet on the market is that critical Production alerts are not “real” critical alerts. We don’t even have a bot that calls the phone in such cases – only Slack alerts.
To make it easier to move on – a summary of what we have found so far:
Moving on.
First question: is this really some unexpected spike in LLM provider usage – or were we already spending this much before?
It doesn’t look like a usage spike, because we already checked requests and tokens – everything looks reasonable there.
Second question: why do we see the LiteLLM spend spike specifically starting from the 13th-14th?
We already did this above, but this is where I actually got to the question “is this really some unexpected spike in LLM provider usage – or were we already spending this much before?” – and put everything together.
So, we have spend data from LiteLLM itself, and we have data from OpenAI and OpenRouter – both what we collect with our own exporters through their APIs and what we can simply see in the providers’ admin panels.
Let’s check OpenAI:
max(
  max_over_time(
    openai_cost_usd_today_total{
      project="litellm-prod"
    }[1d]
  )
)
Let’s check OpenRouter:
max(
  increase(
    openrouter_credits_used_usd[1d]
  )
)
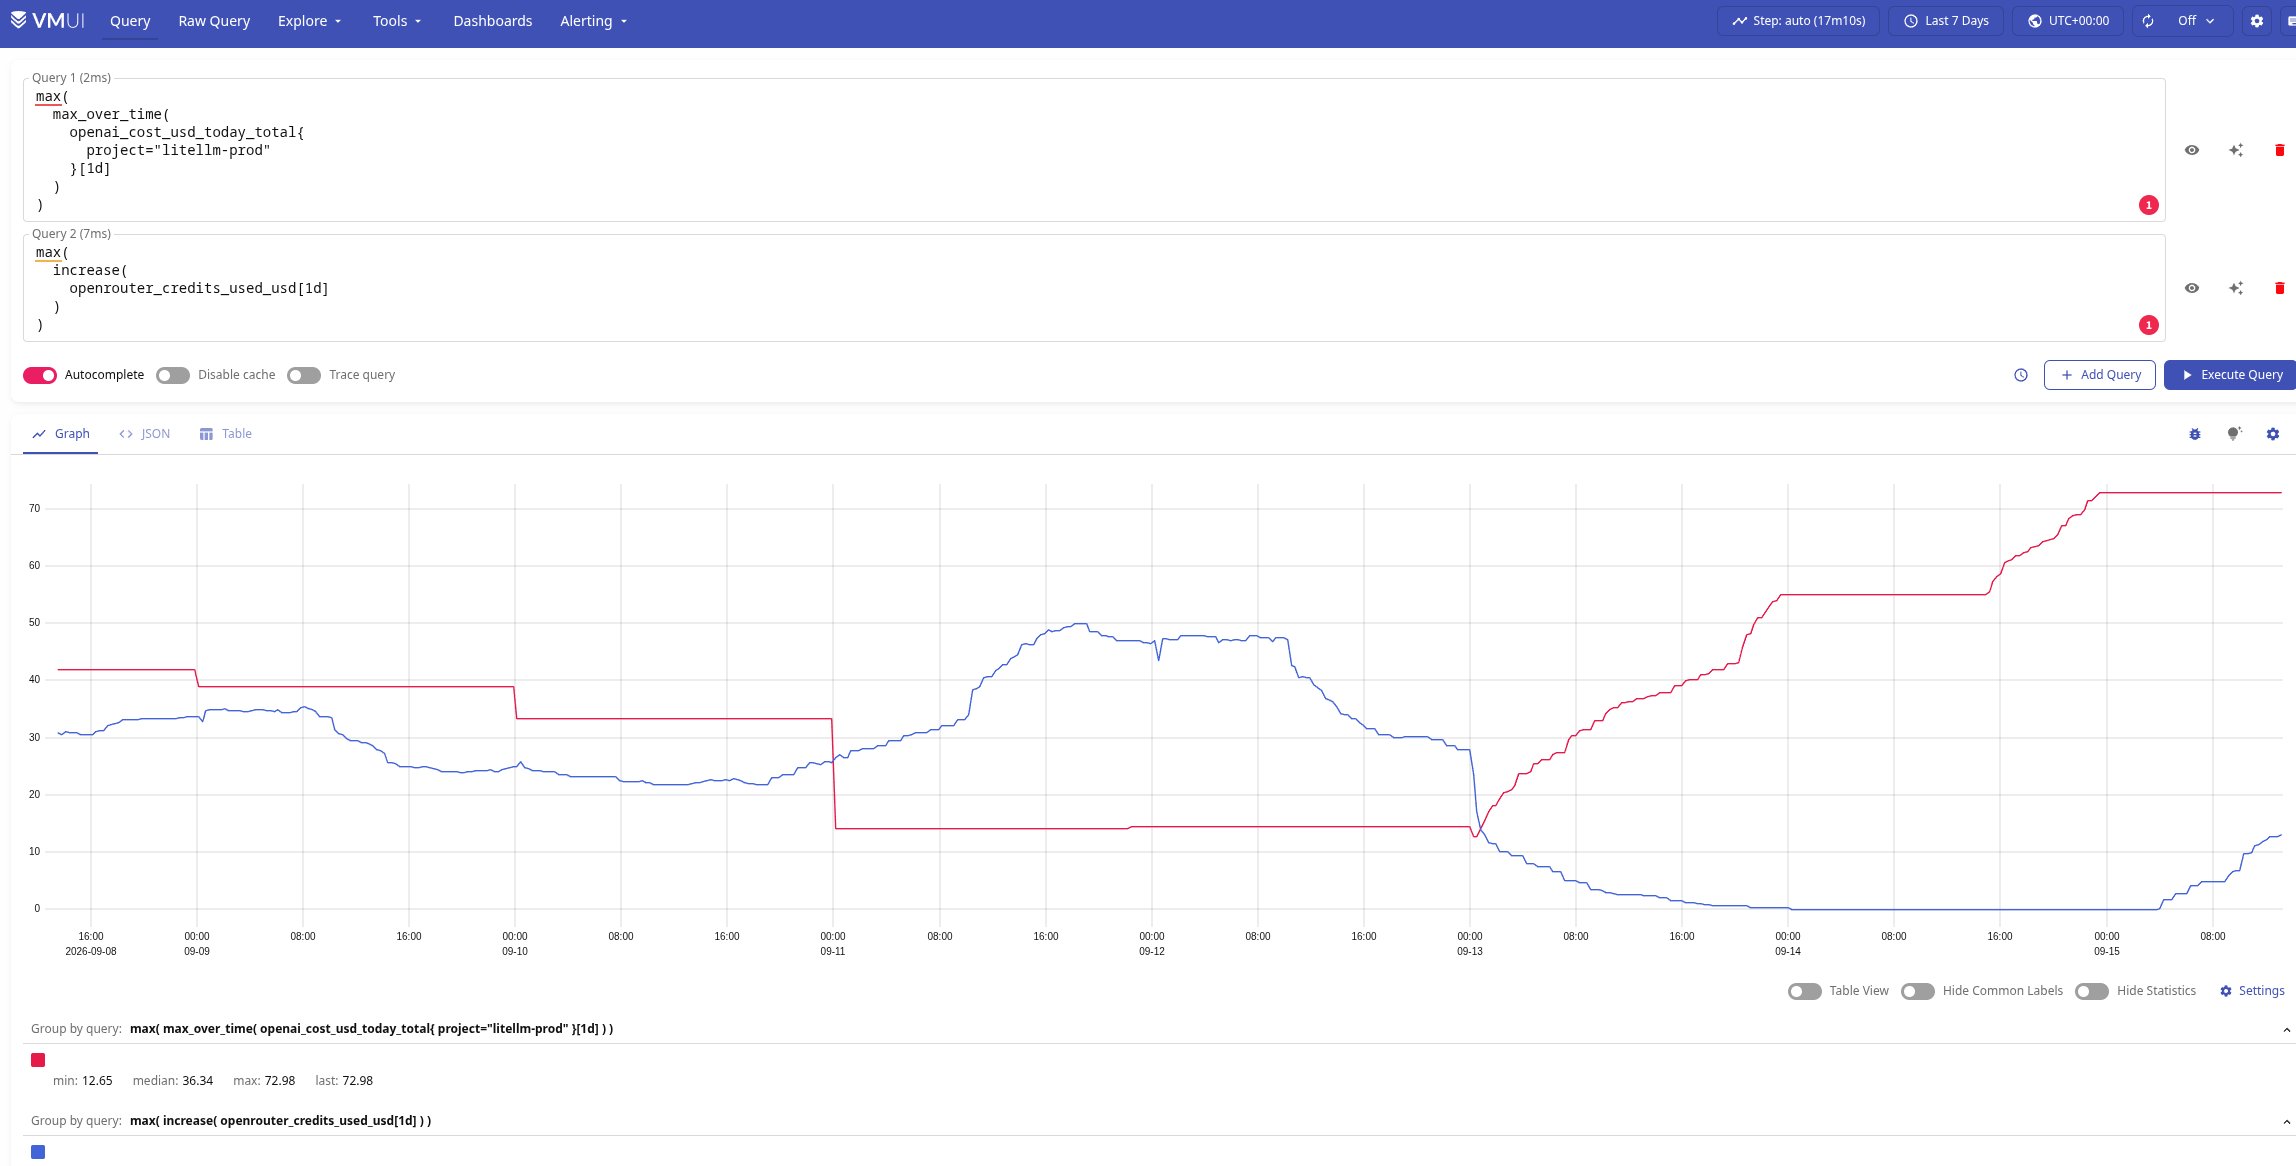
We don’t trust ourselves and our monitoring – maybe the exporters are collecting something incorrectly? – so we go and “see with our own eyes” in the providers’ admin panels.
We already saw OpenAI above:
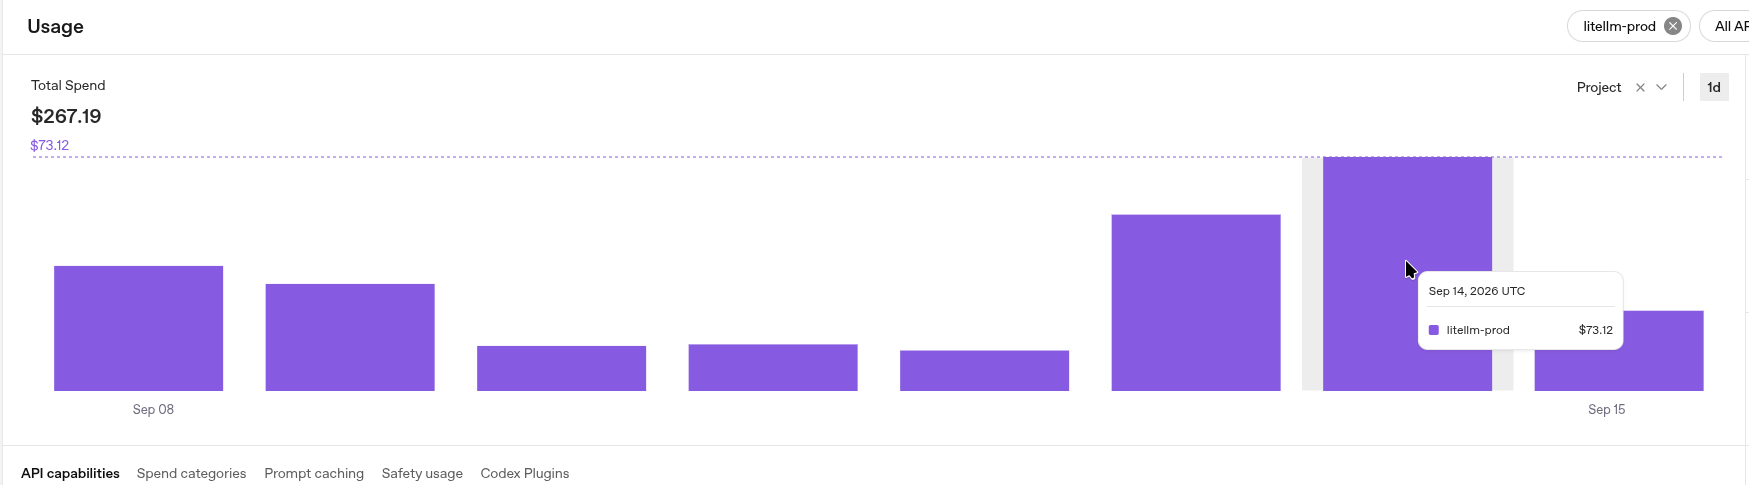
There was already spending on OpenAI before, for example on September 8-9 – because some of our services went there directly. But starting around the 13th-14th, clients that previously used OpenRouter were added as well – and spending almost doubled.
Let’s check the OpenRouter data:
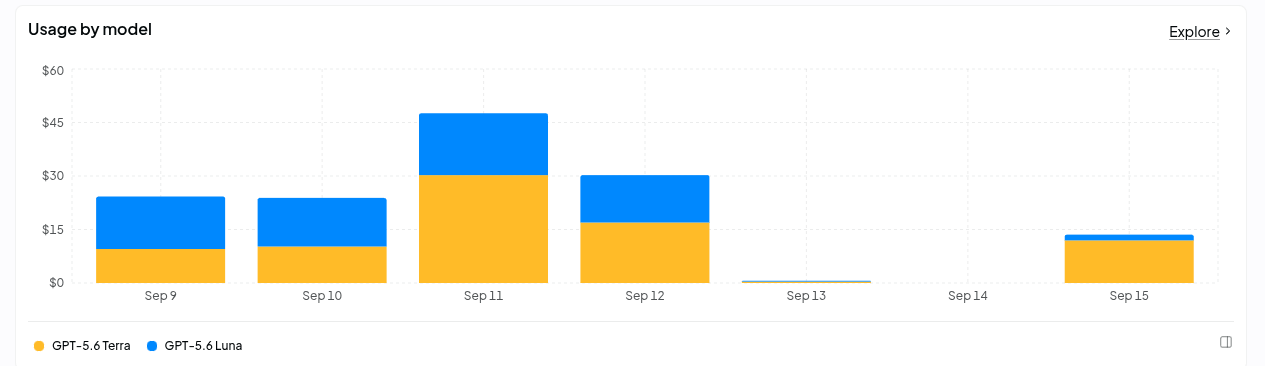
Everything here matches what we saw in our metrics (the colors are excellent, by the way 🙂 )
But in LiteLLM we see a completely different picture:
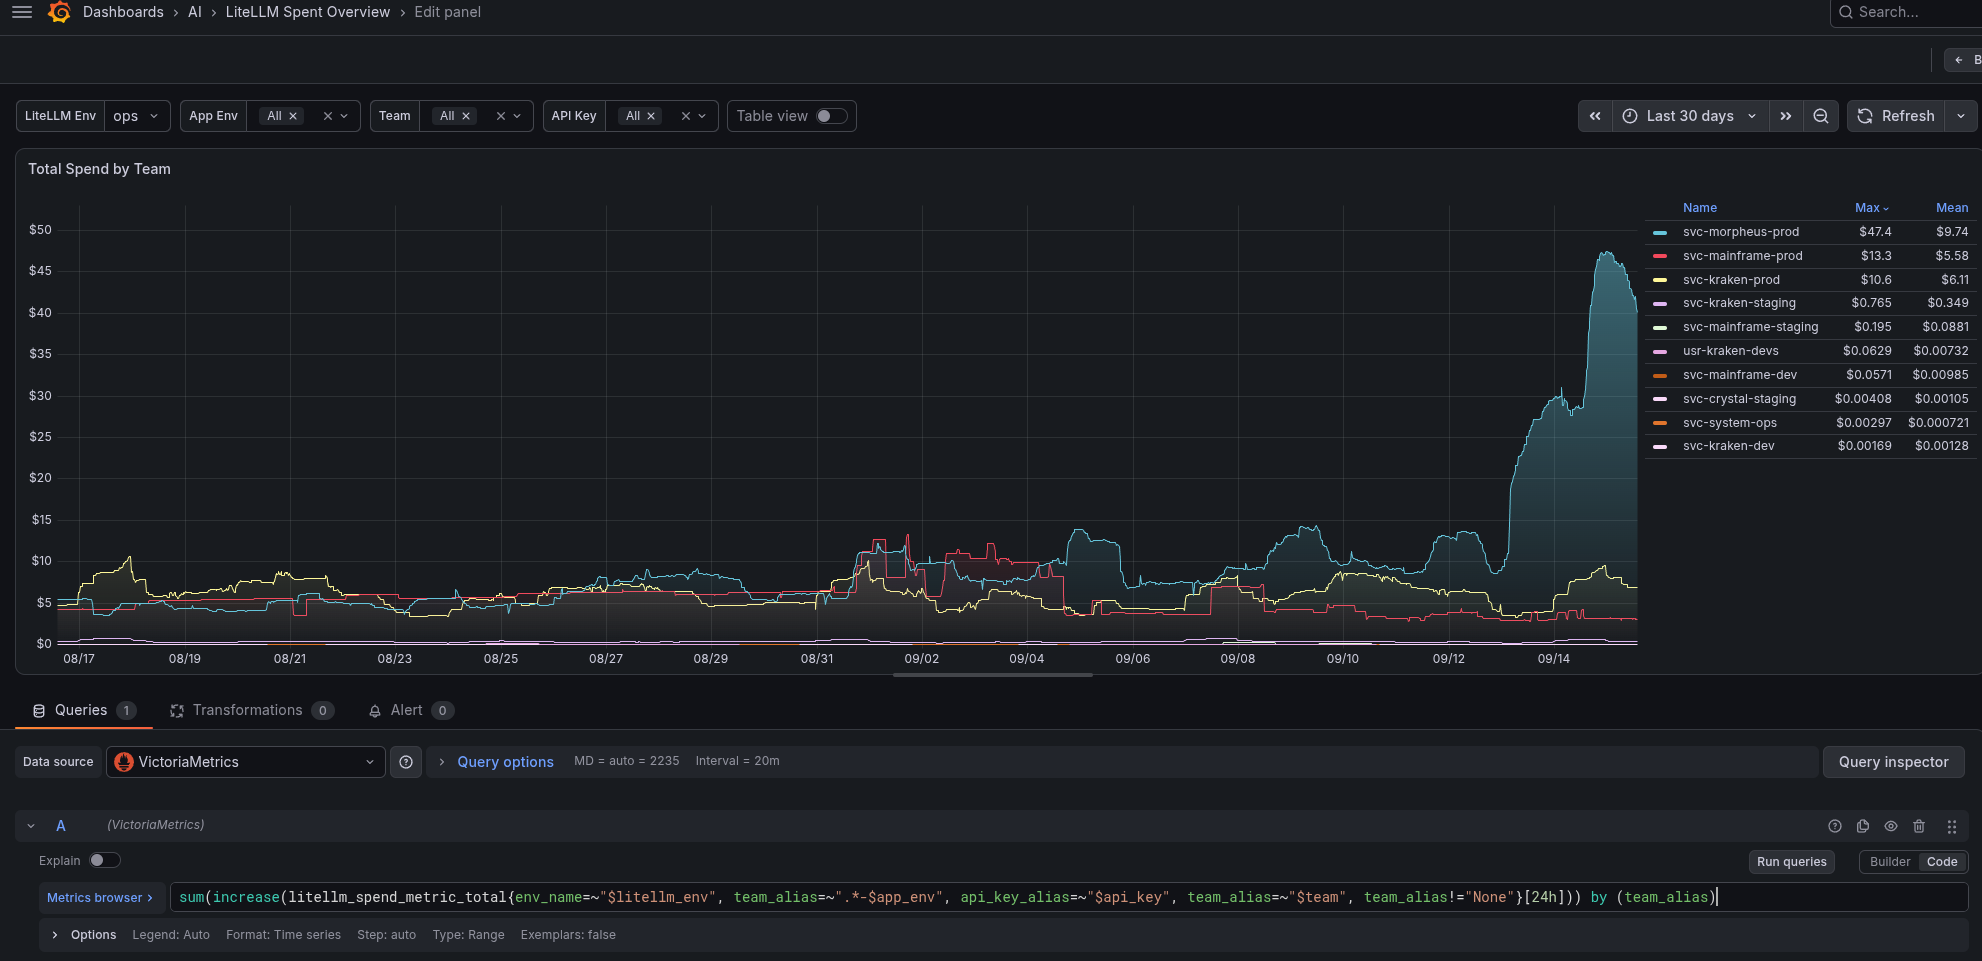
A very sharp spike – almost 5x!
And since we already confirmed that our provider metrics return correct values – let’s look at all three graphs together:
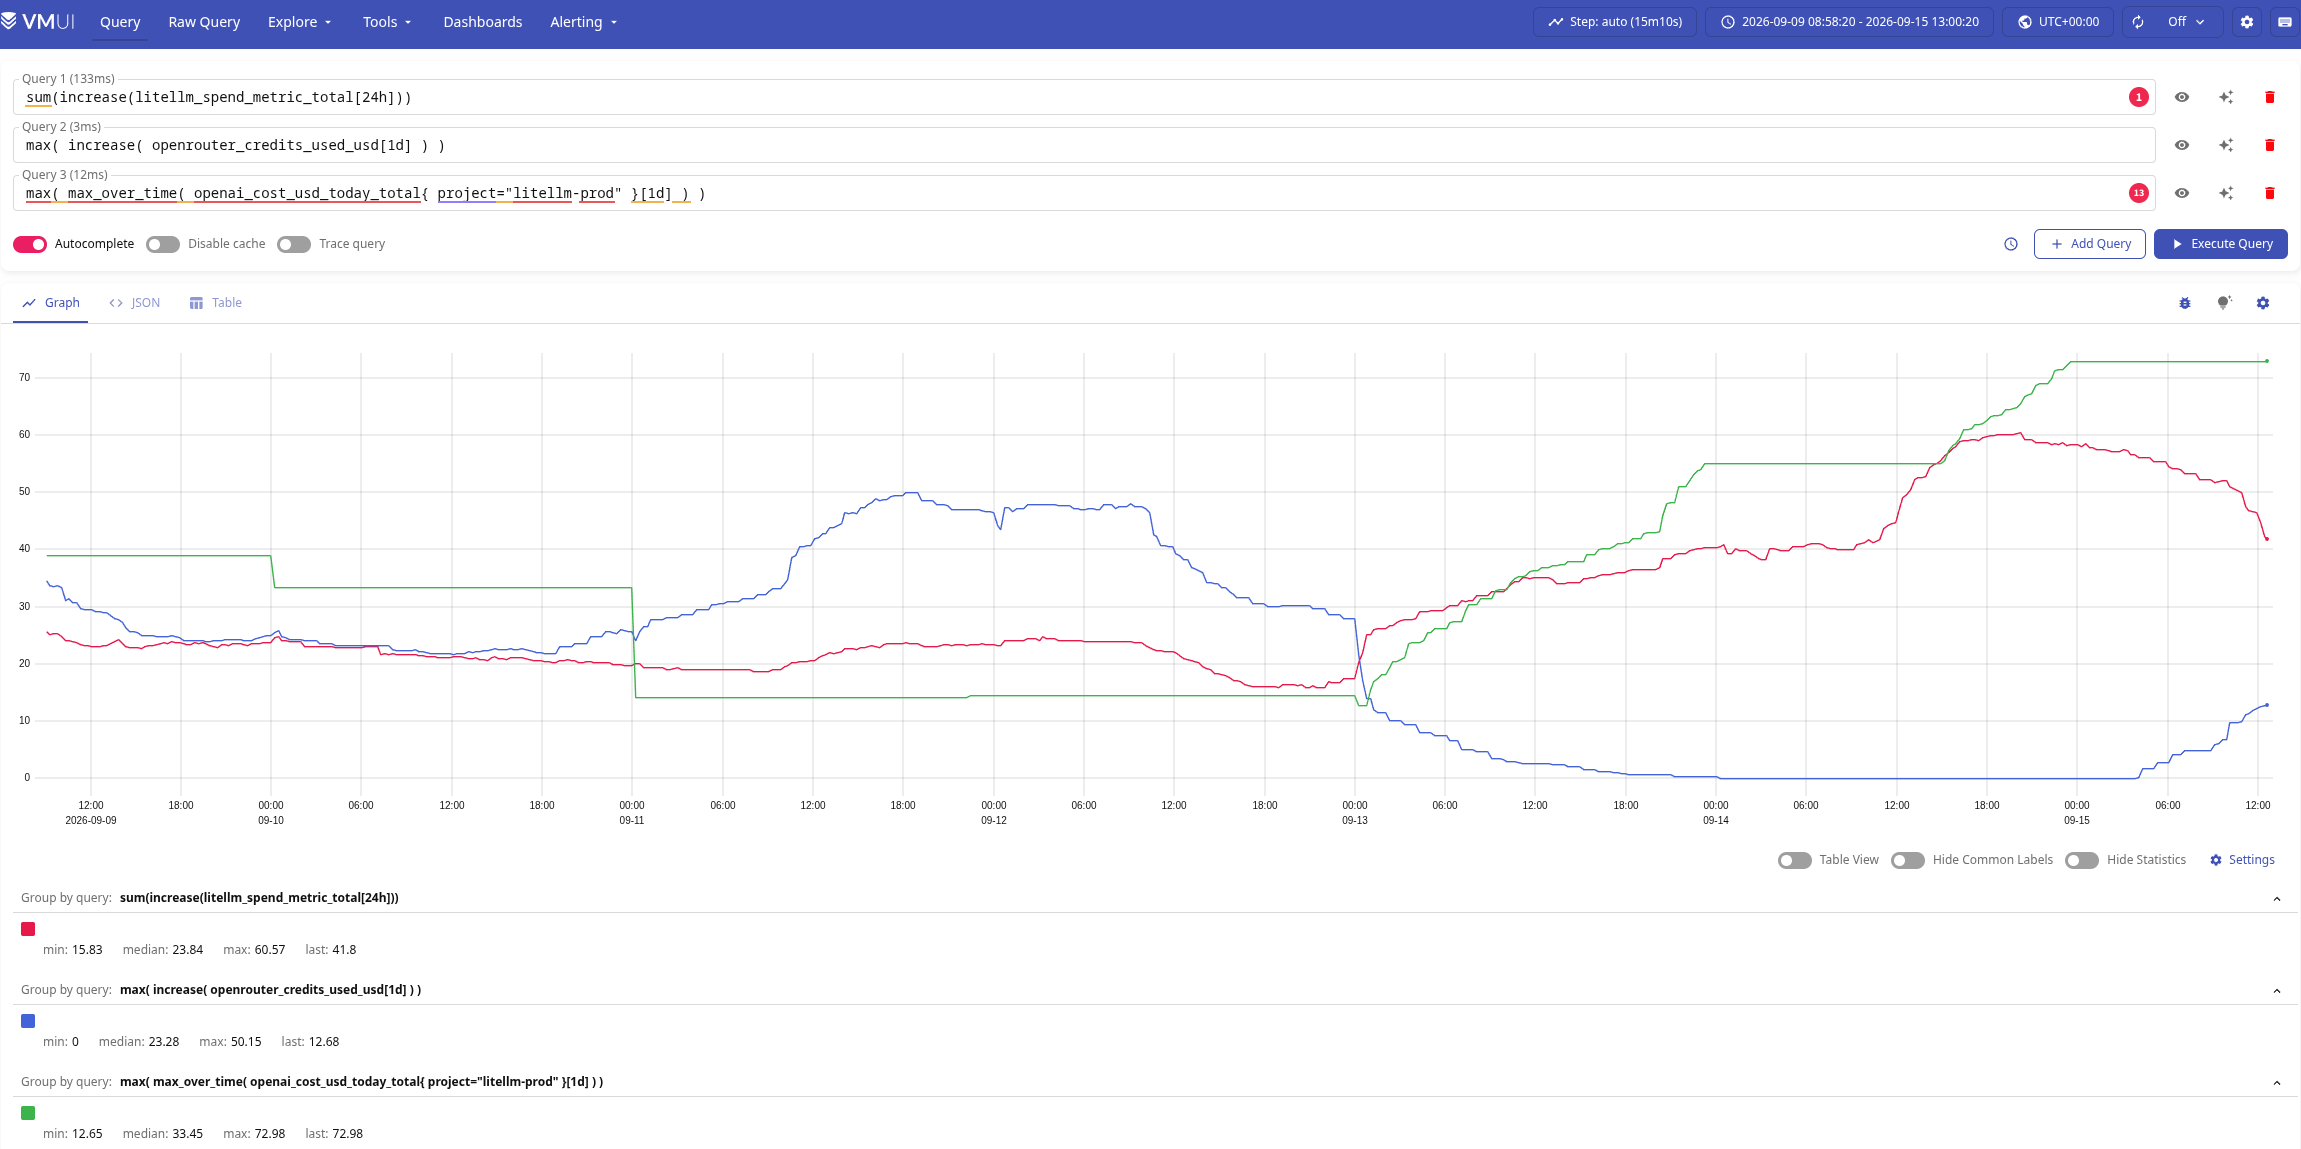 Here:
Here:
So OpenRouter + OpenAI combined could in no way fit into the 15-20 USD that LiteLLM was happily reporting to us!
What is very clear from the graph above is that before the 13th, the main discrepancy between LiteLLM and provider data was specifically between LiteLLM and OpenRouter.
Only one of our services uses models on OpenRouter – the very same api_key_alias="svc-morpheus-prod" from the query examples above, and this service uses the Responses API – and this is where the reason for the discrepancy was found.
There is an open GitHub Issue – OpenRouter Responses API (aresponses) never tracks cost — spend logged as $0 despite real usage, and there is a PR with a fix – fix(openrouter): track cost for Responses API requests, but at the moment it still has not been merged.
I got to Responses API and OpenRouter while analyzing LiteLLM traces – I was checking the value of the litellm.cost.total attribute and noticed that in Morpheus traces the litellm.call_type attribute always has the value “aresponses“.
Next, we simply look at how LiteLLM calculates costs for OpenAI and OpenRouter.
VictoriaTraces query:
{
  resource_attr:service.name="litellm",
  name=~"^chat gpt-5.6-(luna|terra)(-openai)?$"
}
_time:7d
"span_attr:litellm.metadata.user_api_key_alias":="svc-morpheus-prod"
"span_attr:litellm.call_type":="aresponses"
"span_attr:gen_ai.usage.total_tokens":*
| stats by (
    name,
    "span_attr:litellm.provider.model",
    "span_attr:litellm.call_type"
  )
    count() as completed_requests,
    sum("span_attr:gen_ai.usage.input_tokens") as input_tokens,
    sum("span_attr:gen_ai.usage.output_tokens") as output_tokens,
    sum("span_attr:gen_ai.usage.total_tokens") as total_tokens,
    sum("span_attr:litellm.cost.total") as recorded_cost
| math
    1000000 * recorded_cost / total_tokens
    as cost_per_million_tokens
| sort by (completed_requests) desc
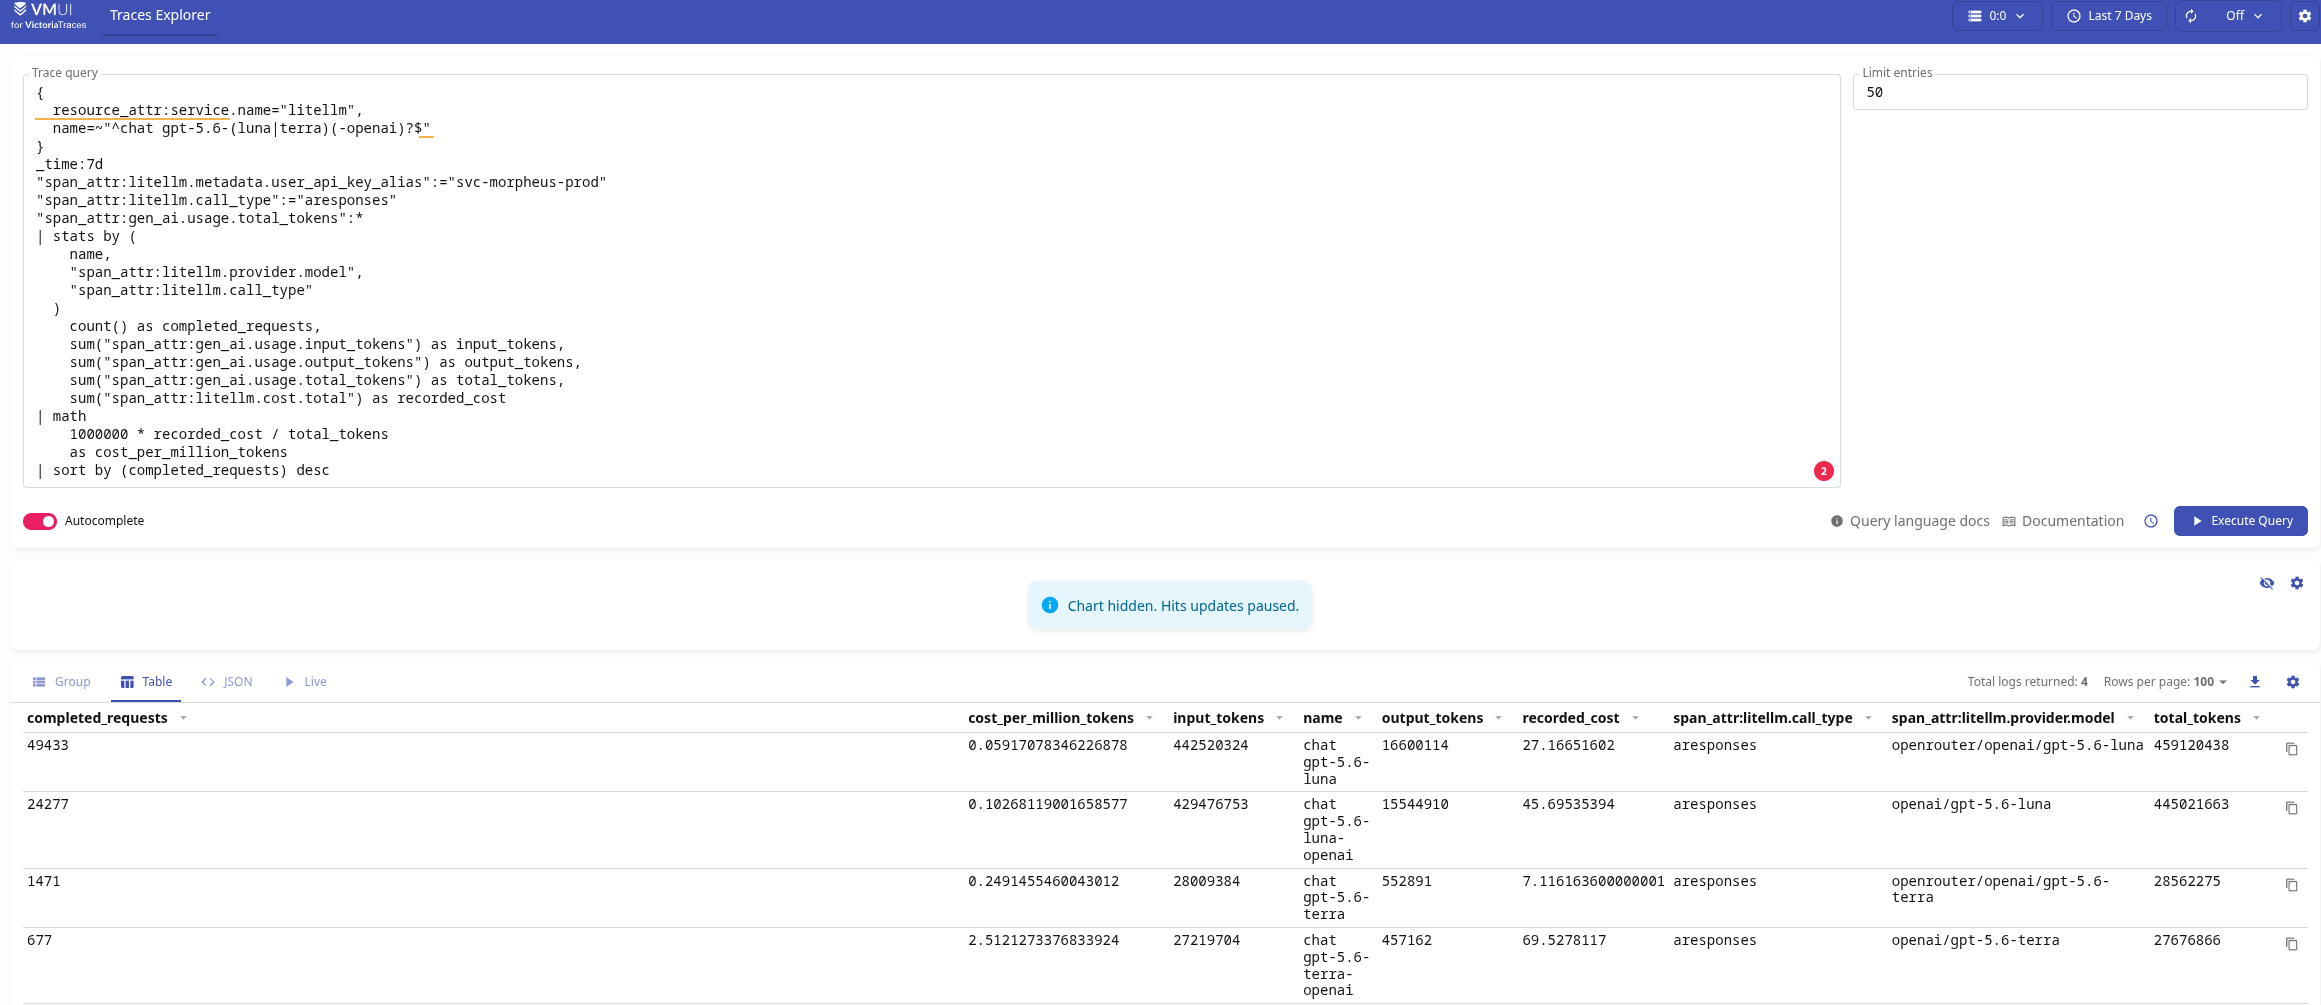
Where we see that for gpt-5.6-luna and gpt-5.6-terra with roughly the same number of tokens – the recorded_cost values differ by several times:
total_tokens:
recorded_cost:
total_tokens:
recorded_cost:
Or, another way, a bit simpler – and at the same time check whether Morpheus uses the Chat Completion API at all or only the Responses API:
{
  resource_attr:service.name="litellm",
  name=~"^chat .*"
}
_time:7d
"span_attr:litellm.metadata.user_api_key_alias":="svc-morpheus-prod"
"span_attr:litellm.call_type":in("aresponses", "acompletion")
"span_attr:gen_ai.usage.total_tokens":*
| stats by (
    "span_attr:llm.provider",
    "span_attr:litellm.call_type"
  )
    count() as requests,
    sum("span_attr:gen_ai.usage.input_tokens") as input_tokens,
    sum("span_attr:gen_ai.usage.output_tokens") as output_tokens,
    sum("span_attr:litellm.cost.total") as recorded_cost
| sort by (requests) desc
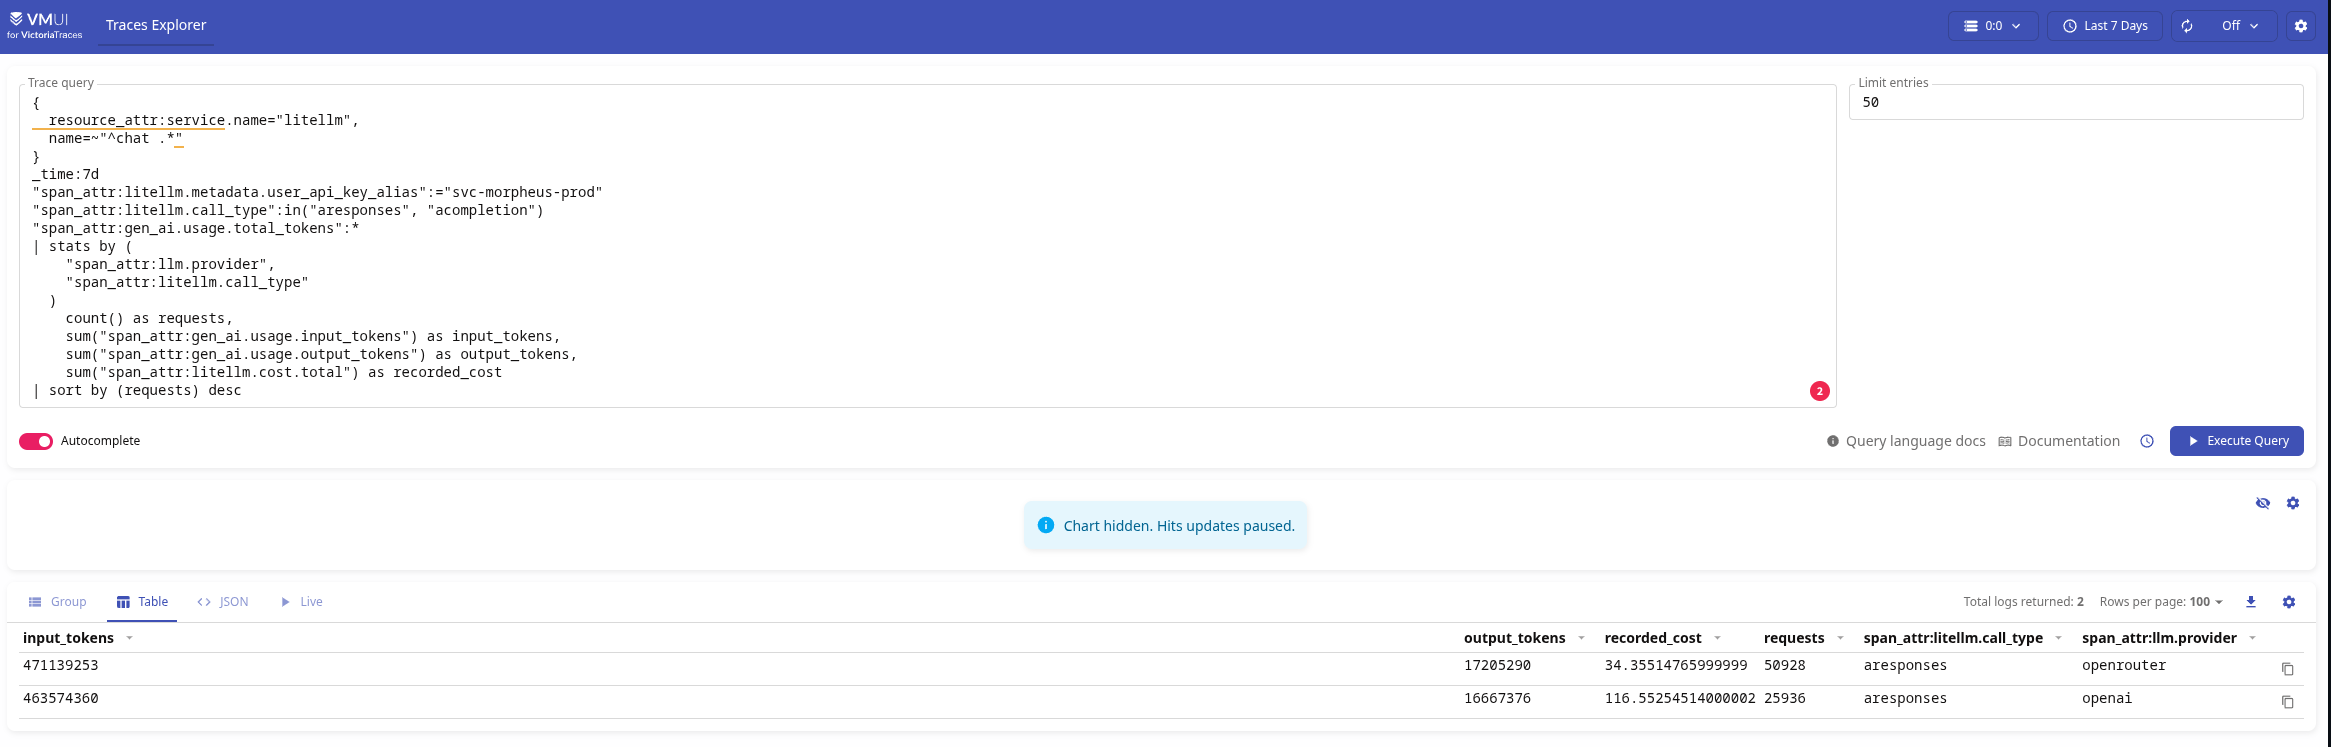
We see that all requests use the Responses API, and at the same time:
The spend spike in litellm_spend_metric_total after the 13th did not mean that total LLM spending suddenly increased, and I bothered the developers for nothing – “What the hell have you vibe-coded there already?”: the combined OpenAI and OpenRouter spending remained roughly at the previous level.
There were several reasons behind the spike on the Grafana graphs:
aresponses LiteLLM did not use the actual OpenRouter usage.cost and could calculate the cost incorrectlySo, the main thing – don’t rely only on LiteLLM, and monitor costs directly from the providers as well.
And pay attention to alerts 🙂
We already have some of this in the project, and some things still need to be added.
And just as another summary – what was missing in the monitoring.
We need to monitor fallbacks – both in Grafana and in alerts.
We didn’t have this in our Grafana dashboards, but we do have an alert:
- alert: LiteLLM Too High Fallback Rate
  expr: |
    sum by (namespace, requested_model, fallback_model, api_key_alias, team_alias, exception_class, exception_status) (
      increase(litellm_deployment_successful_fallbacks_total[5m])
    ) > 300
  for: 5m
  labels:
    component: devops
    environment: ops
    severity: warning
    ilert_routingkey: devops-ops-warning
  annotations:
    summary: LiteLLM Too High Fallback Rate
    description: |-
      LiteLLM has rerouted more than 300 requests to fallback models per 5-minute window for more than `{{ "{{" }} $for }}`.
      This indicates sustained primary model or provider failures and may increase latency, change model behavior, or increase cost.
      *Namespace*: `{{ "{{" }} $labels.namespace }}`
      *Fallbacks during the last 5 minutes*: `{{ "{{" }} $value }}`
      *Requested model*: `{{ "{{" }} $labels.requested_model }}`
      *Fallback model*: `{{ "{{" }} $labels.fallback_model }}`
      *API key alias*: `{{ "{{" }} $labels.api_key_alias }}`
      *Team alias*: `{{ "{{" }} $labels.team_alias }}`
      *Exception class*: `{{ "{{" }} $labels.exception_class }}`
      *Exception status*: `{{ "{{" }} $labels.exception_status }}`
      <https://{{ $.Values.monitoring.root_url }}/d/adtt9jj/adrmshg/litellm-system-overview |:grafana: LiteLLM System overview>
If OpenRouter is the primary provider, it can make sense to monitor what share of total LiteLLM traffic goes to it and what share goes to OpenAI.
An example query for percentages:
100 *
sum(
  rate(
    litellm_requests_metric_total{
      api_key_alias="svc-morpheus-prod",
      api_provider="openai"
    }[15m]
  )
)
/
clamp_min(
  sum(
    rate(
      litellm_requests_metric_total{
        api_key_alias="svc-morpheus-prod"
      }[15m]
    )
  ),
  0.001
)
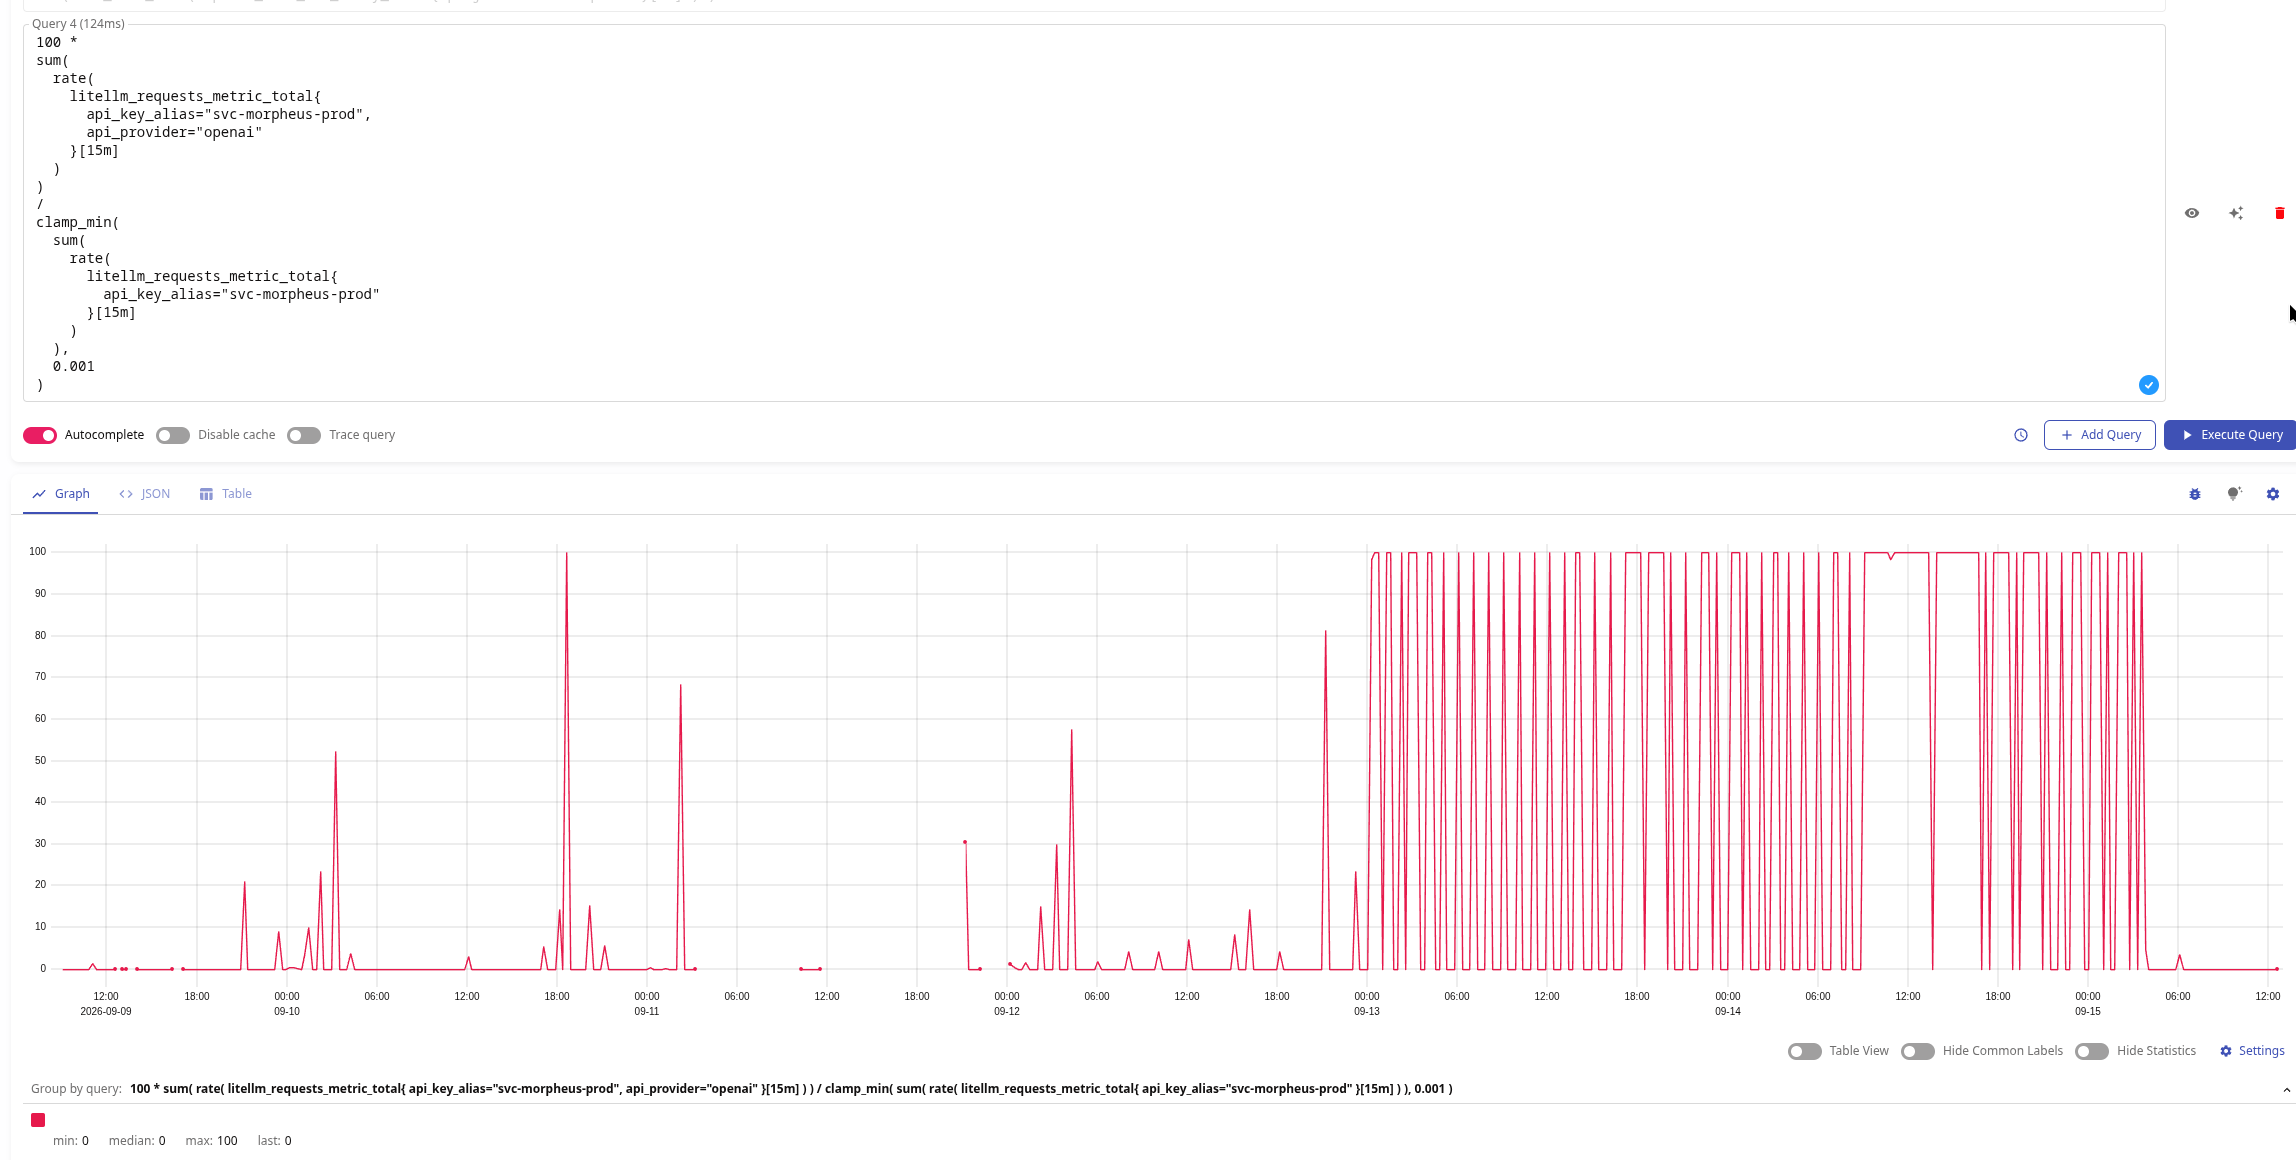
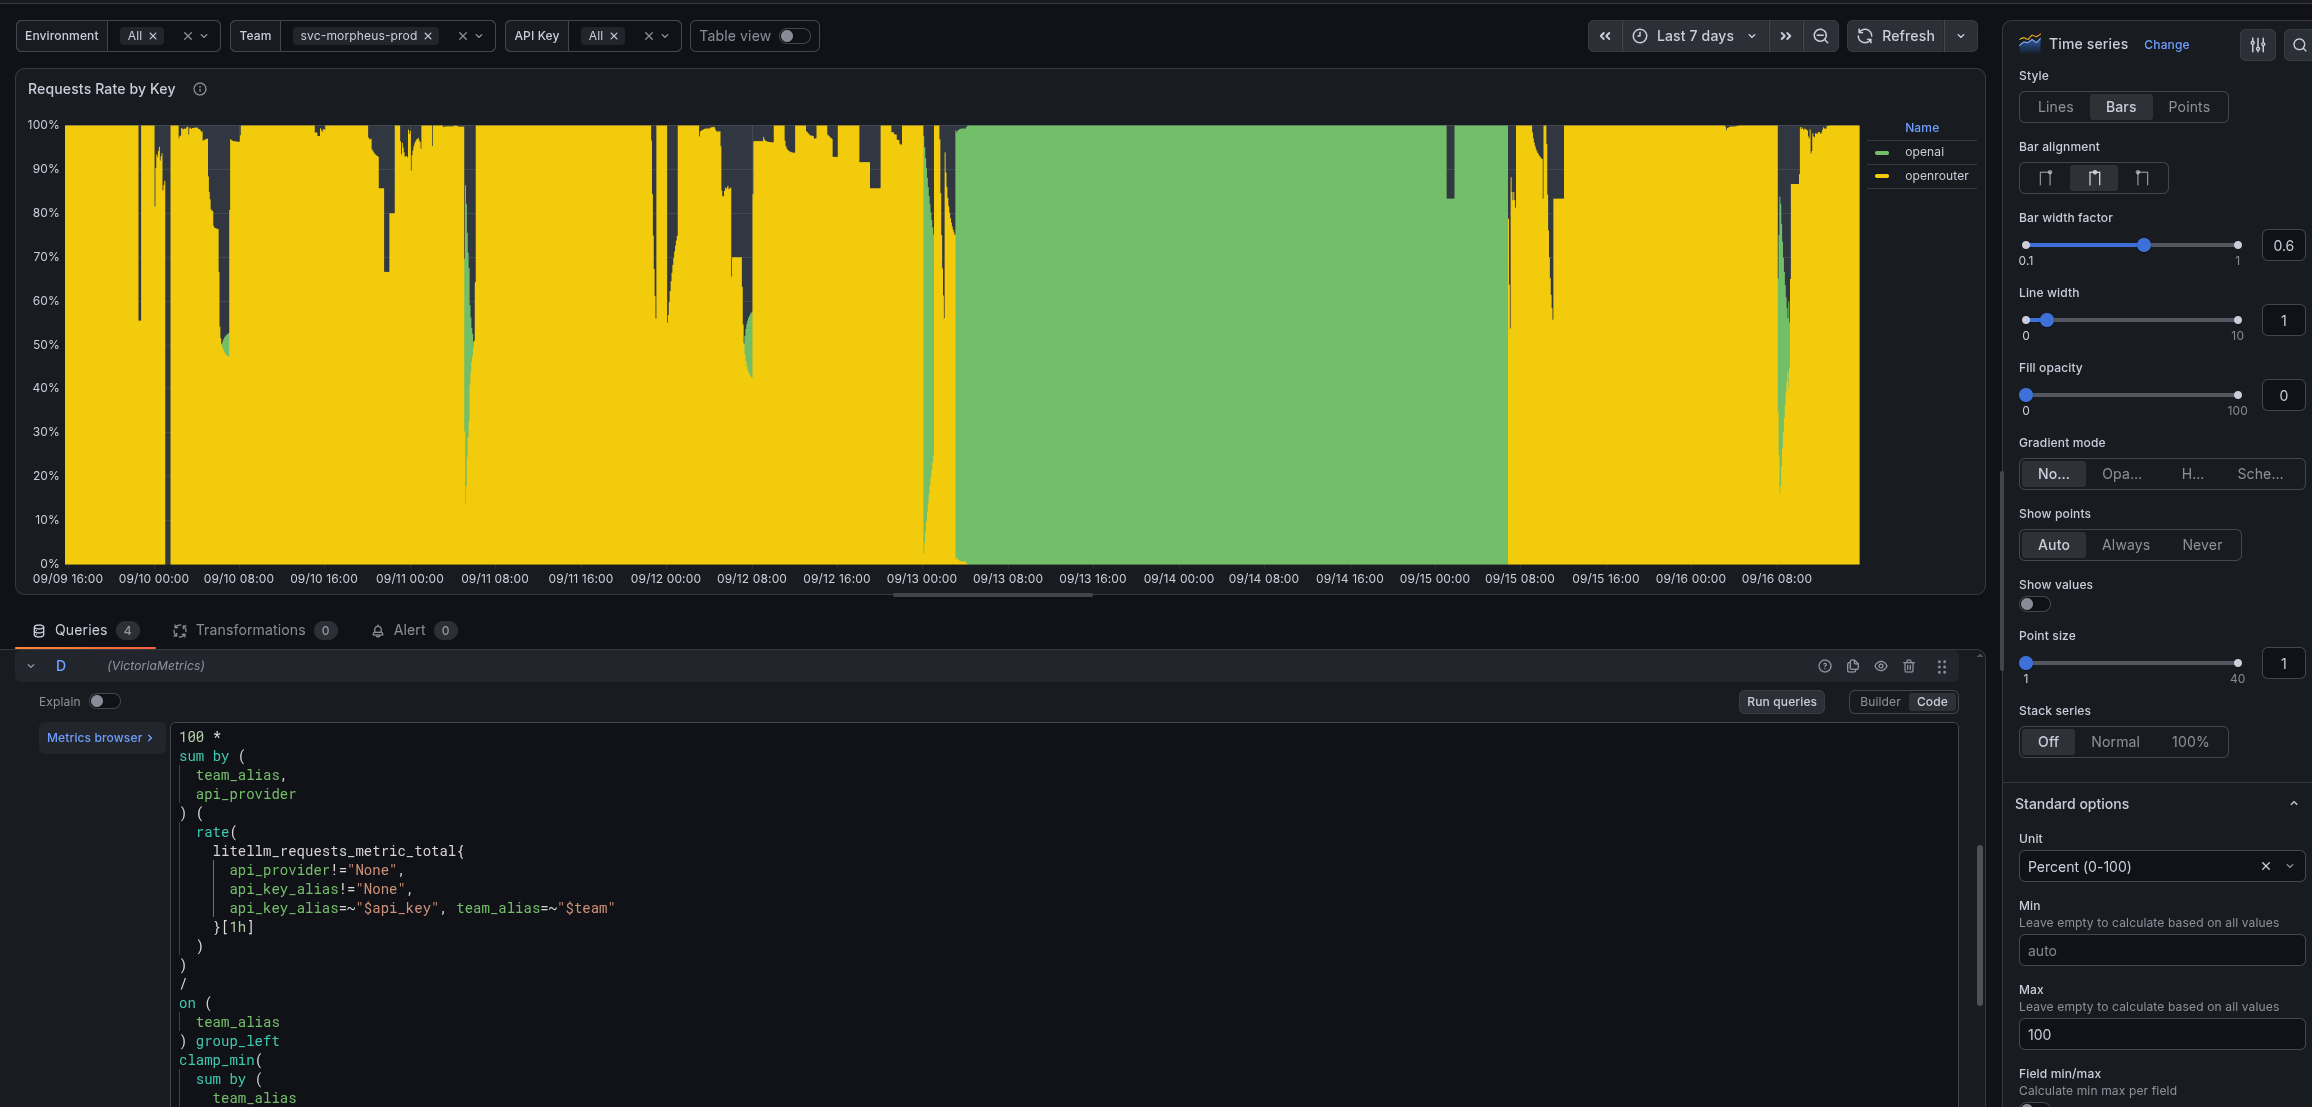
For Grafana, we can add a visualization – but with filters (using Grafana variables), otherwise the graph will be a total mess:
100 *
sum by (
  team_alias,
  api_provider
) (
  rate(
    litellm_requests_metric_total{
      api_provider!="None",
      api_key_alias!="None",
      api_key_alias=~"$api_key", team_alias=~"$team"
    }[1h]
  )
)
/
on (
  team_alias
) group_left
clamp_min(
  sum by (
    team_alias
  ) (
    rate(
      litellm_requests_metric_total{
        api_provider!="None",
        api_key_alias!="None",
        api_key_alias=~"$api_key", team_alias=~"$team"
      }[1h]
    )
  ),
  0.001
)
We have an alert for this, a useful thing: it compares spending over the last day with the average value for the previous 7 days. It triggers if the value becomes 2x that average:
# Alert when spend during the last rolling 24 hours exceeds 200% of the daily
# average from the preceding 7 days. The 1d offset excludes the current
# 24-hour window from the baseline; ignore API keys whose spend is $10 or less.
- alert: LiteLLM API Key Spend Spike
  expr: |
    (
      sum by (namespace, api_key_alias) (increase(litellm_spend_metric_total[1d]))
        > 2 * (sum by (namespace, api_key_alias) (increase(litellm_spend_metric_total[7d] offset 1d)) / 7)
    )
    and
    sum by (namespace, api_key_alias) (increase(litellm_spend_metric_total[1d])) > 10
  for: 1h
  labels:
    severity: warning
  annotations:
    summary: "LiteLLM API Key Spend Spike"
    description: |-
      *Namespace*: `{{ "{{" }} $labels.namespace }}`
      *API key alias*: `{{ "{{" }} $labels.api_key_alias }}`
      *Spend (last 24h)*: `${{ "{{" }} $value | printf "%.2f" }}`
      *Previous 7-day daily average*: `${{ "{{" }} with printf "sum(increase(litellm_spend_metric_total{namespace=%q,api_key_alias=%q}[7d] offset 1d))/7" $labels.namespace $labels.api_key_alias | query }}{{ "{{" }} . | first | value | printf "%.2f" }}{{ "{{" }} else }}n/a{{ "{{" }} end }}`
      *Alert threshold (200% of daily average)*: `${{ "{{" }} with printf "2*(sum(increase(litellm_spend_metric_total{namespace=%q,api_key_alias=%q}[7d] offset 1d))/7)" $labels.namespace $labels.api_key_alias | query }}{{ "{{" }} . | first | value | printf "%.2f" }}{{ "{{" }} else }}n/a{{ "{{" }} end }}`
      <https://{{ $.Values.monitoring.root_url }}/d/adtt9jj/adrmshg/litellm-system-overview|:grafana: LiteLLM System overview>
We collect these metrics ourselves, but there are probably ready-made exporters – you can use those.
These alerts, of course, should have severity="critical".
Examples using OpenRouter alerts.
The first one – alert if there is less than 20 dollars left in the account:
- alert: OpenRouter Credits Low
  expr: |
    openrouter_credits_remaining_usd > 0
    and
    openrouter_credits_remaining_usd < 20
    and
    openrouter_exporter_scrape_success == 1
  for: 10m
  labels:
    severity: critical
    component: devops
    environment: ops
    ilert_routingkey: devops-ops-critical
  annotations:
    summary: "OpenRouter credits are running low"
    description: |-
      OpenRouter has less than ${{ .Values.openrouter_exporter.low_credits_threshold_usd }} in credits remaining for more than `{{ "{{" }} $for }}`.
      *Credits remaining*: `${{ "{{" }} printf "%.2f" $value }}`
And the second one – when there is no money left at all:
- alert: OpenRouter Credits Exhausted
  expr: |
    openrouter_credits_remaining_usd <= 0
    and
    openrouter_exporter_scrape_success == 1
  for: 5m
  labels:
    severity: critical
    component: devops
    environment: ops
    ilert_routingkey: devops-ops-critical
  annotations:
    summary: "OpenRouter credits are exhausted"
    description: |-
      OpenRouter credits have been exhausted for more than `{{ "{{" }} $for }}`.
      *Credits remaining*: `${{ "{{" }} printf "%.2f" $value }}`
It is useful to display the real spending we get from provider APIs with our exporters – and the spending calculated by LiteLLM.
Probably make two graphs – LiteLLM vs OpenAI with two queries, and another one for LiteLLM vs OpenRouter.
For “LiteLLM vs OpenAI”, the first query is what we get from the OpenAI API with our exporter:
max(
  max_over_time(
    openai_cost_usd_today_total{
      project="litellm-prod"
    }[1d]
  )
)
The second one is what LiteLLM “draws” for us:
sum(
  increase(
    litellm_spend_metric_total{
      namespace="ops-litellm-ns",
      api_provider="openai"
    }[1d]
  )
)
The picture is roughly the same, here is a graph for a month with Interval and Step set to 1d:
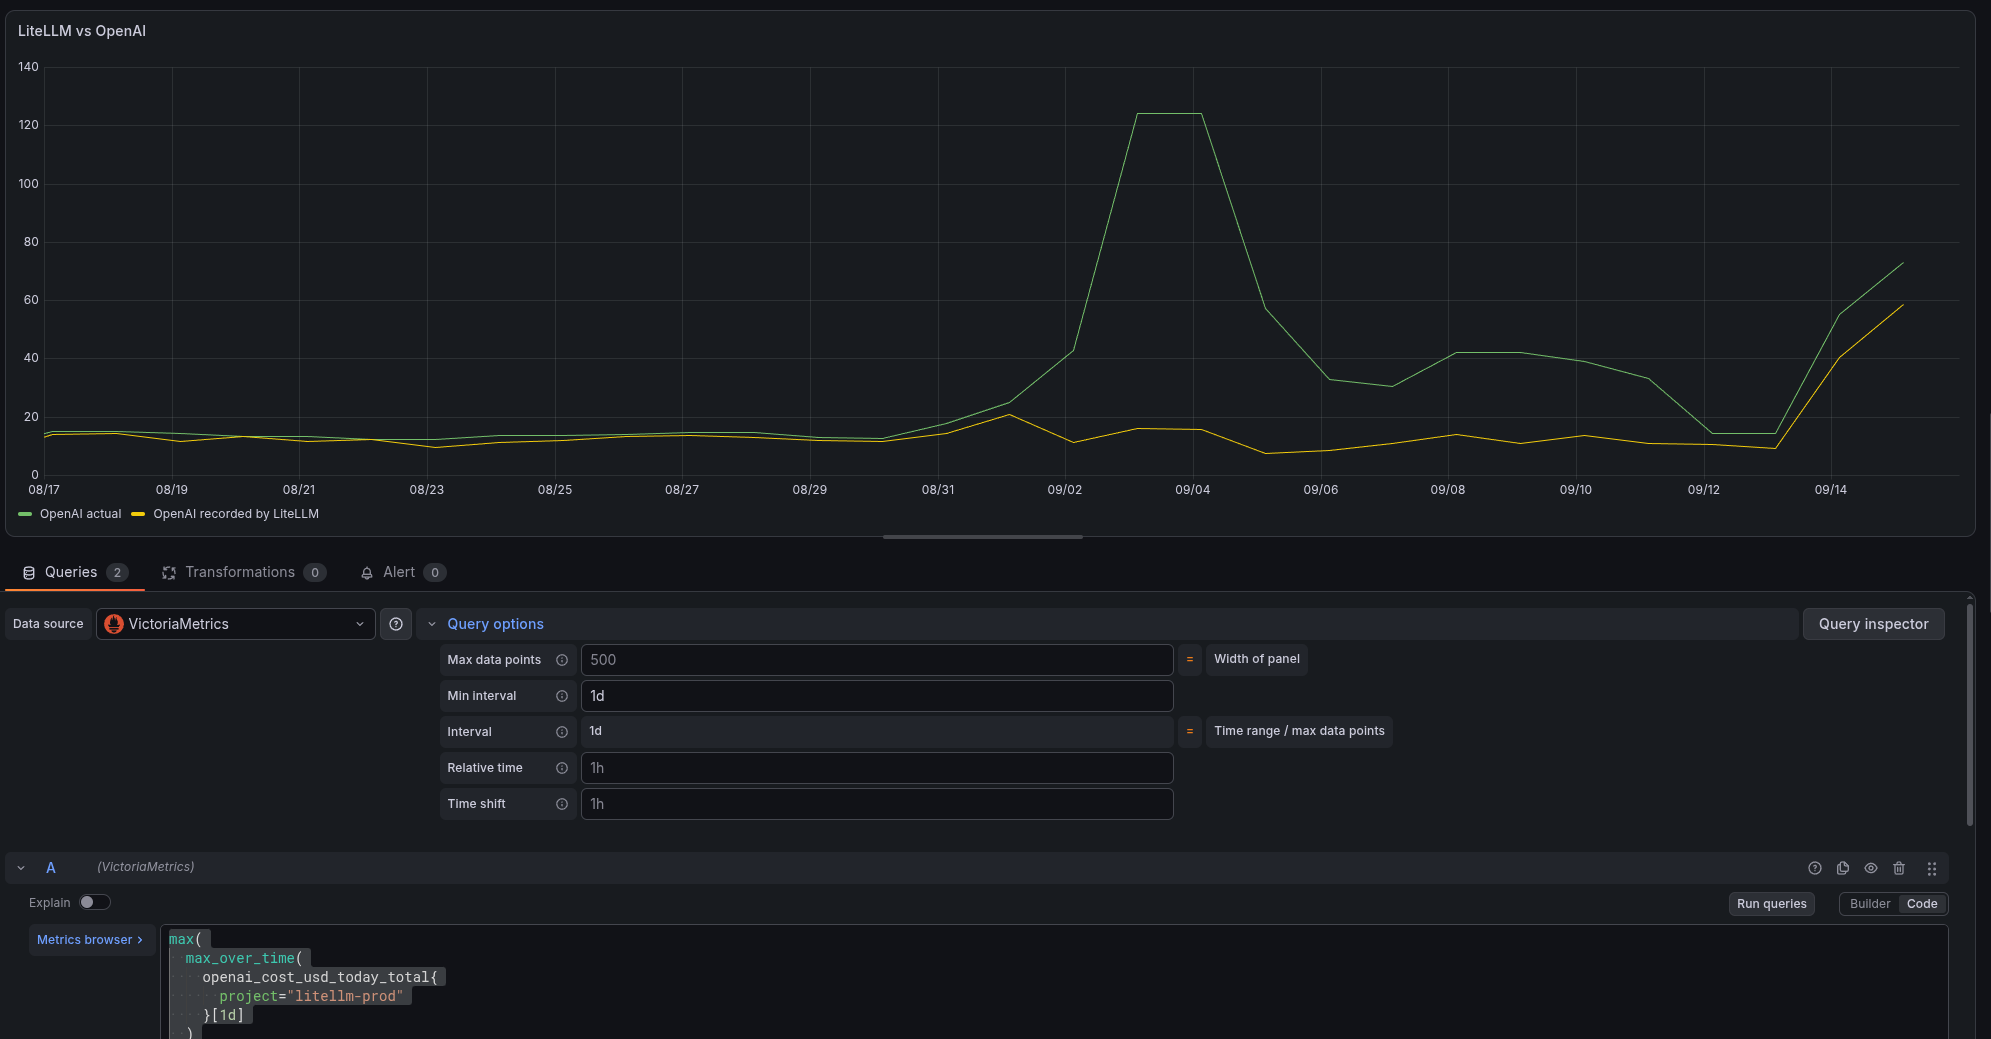
Here on September 2-4 and for a few days after that there is a spike that does not match the LiteLLM data – but this is expected, because at that time I was testing our LLM Evaluations using a separate OpenAI API Key, but in the same project (see LiteLLM: Custom Callback and LLM Evaluations with Judge LLM).
Query for OpenRouter spending:
max(
  increase(
    openrouter_credits_used_usd[1d]
  )
)
And the data calculated by LiteLLM:
sum(
  increase(
    litellm_spend_metric_total{
      namespace="ops-litellm-ns",
      api_provider="openrouter"
    }[1d]
  )
)
The result:
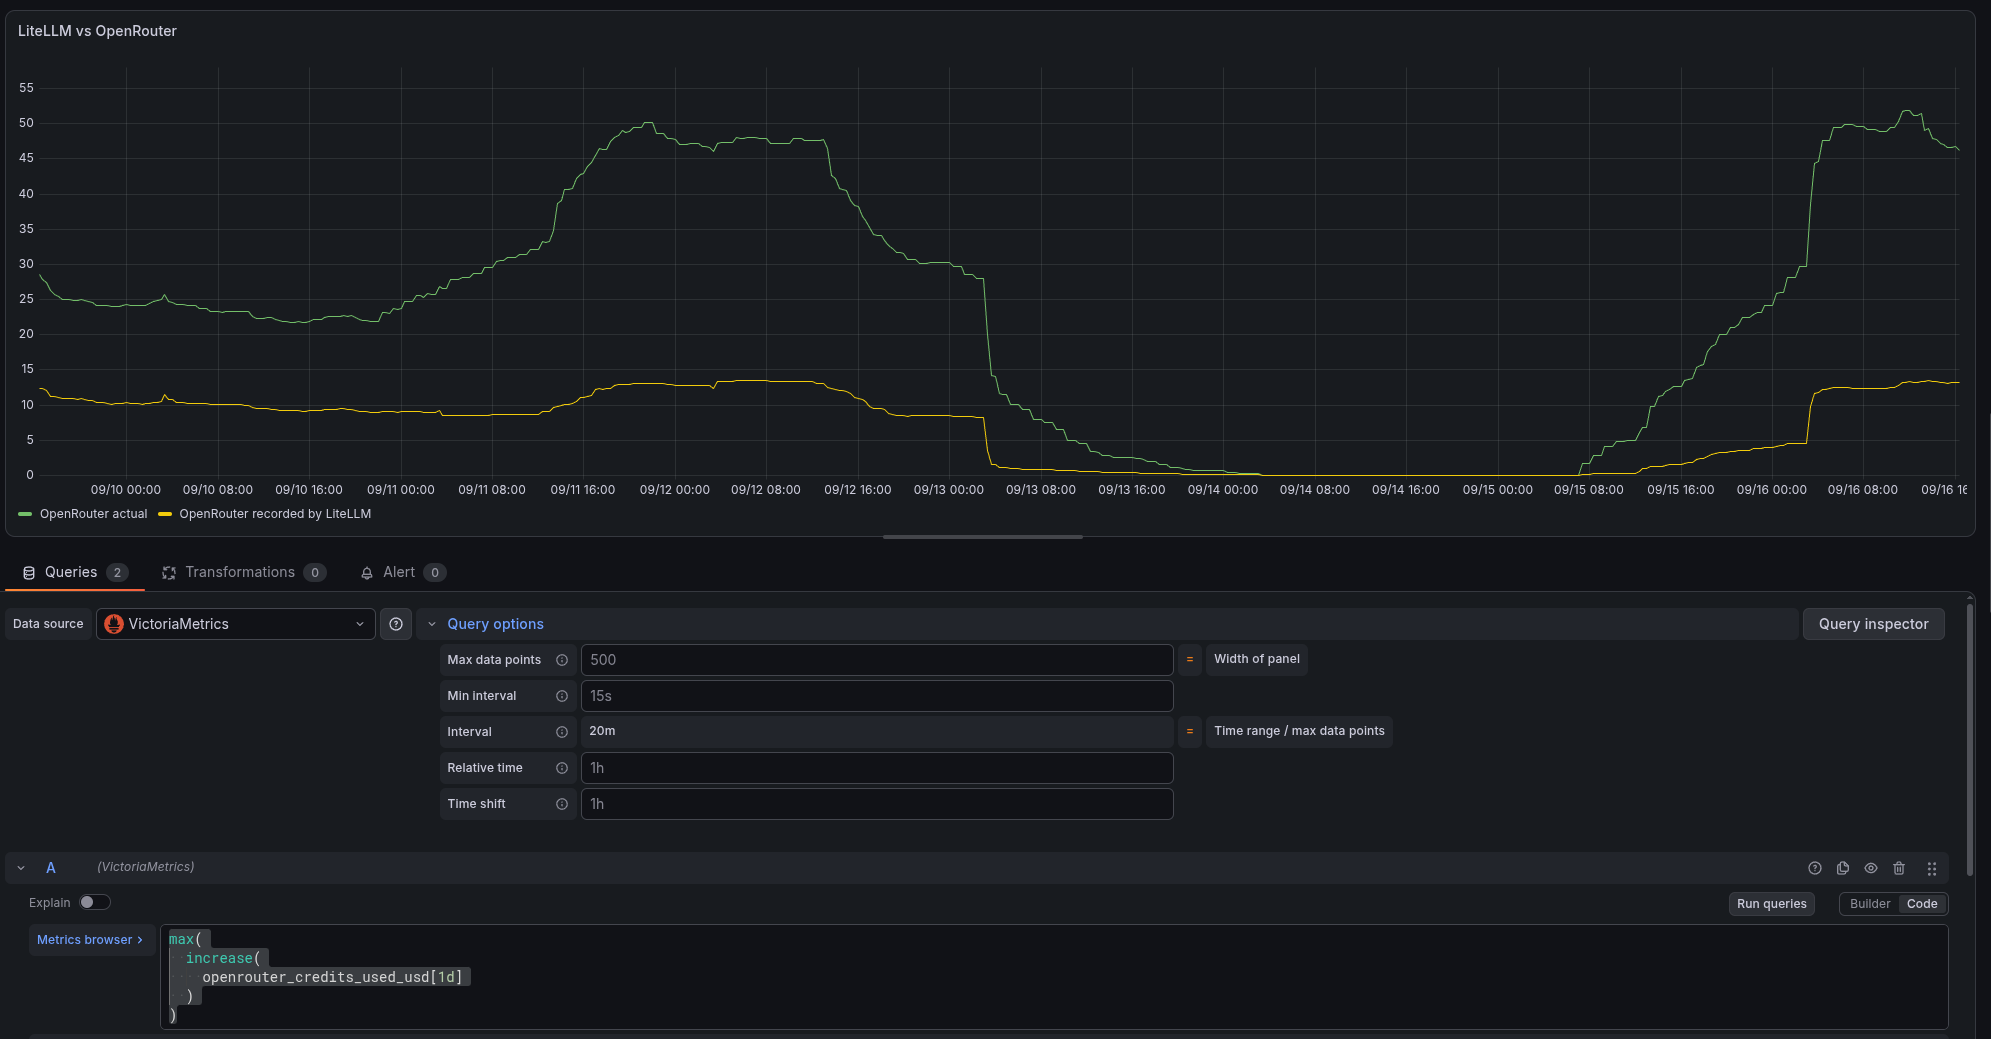
Here, as expected, we see the discrepancy caused by the same OpenRouter usage.cost bug for the Responses API.
Looks like that’s it…
And one last time – don’t trust a single source, in this case LiteLLM.
Having additional control directly from the providers is a must-have.

此内容由惯性聚合(RSS阅读器)自动聚合整理,仅供阅读参考。 原文来自 — 版权归原作者所有。