







 A few days ago, I ran into an interesting situation with LiteLLM: on the one hand, the metrics showed a lot of errors “from the provider”, while on the other hand, the traces and alerts showed only a single error.
I had to dig into it a bit and figure out some nuances of how LiteLLM actually counts metrics and what it really writes to metrics and traces.
And as a bonus, this turned into a pretty useful guide for myself on how to debug issues like this in the future.
Contents
So, what do we have:
litellm_deployment_failure_responses_total metric with exception_class="ValueError"Both were triggered for the same API Key of a specific service, and in Grafana it looked like this:
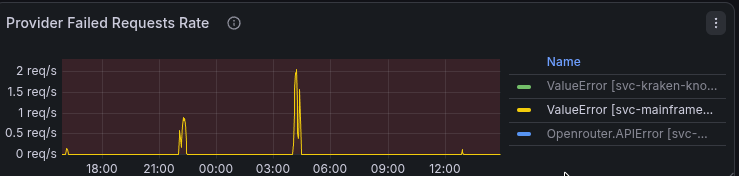
At the same time, the alert fired only once, around 22:00, also with exception_class="ValueError".
It turned out that there were two issues with different errors, although they were related.
And what made it even more confusing was that in both traces and metrics, both issues were shown with exception_class="ValueError".
So, let’s dig into it: we need to find the root cause and, most importantly, understand why the client got only one failed response while the error graphs show a lot of failures.
The first thing that came to mind: if we have errors, then we should also have traces with status_code:="2", right? Let’s recall the OTel specification for otel/status_code:
otel.status_code |
 |
string | Name of the code, either “OK” or “ERROR”. MUST NOT be set if the status code is UNSET. |
In numeric form, this is:
UNSETOKERROROne thing worth clarifying here: OTel instrumentation usually doesn’t set the “OK” value, and if a request completes without errors, it will normally have 0/UNSET. See Set Status.
Let’s search for all traces for this key with code “2”. The VictoriaMetrics query is:
{"resource_attr:service.name"="litellm"} "span_attr:litellm.metadata.user_api_key_alias":="svc-mainframe-prod" status_code:="2"
| fields _time, trace_id, span_id, name, status_message,
    "event:event_attr:exception.message:0",
    "span_attr:error.type",
    "span_attr:error.message",
    "span_attr:http.status_code"
And… we have only one error at 22:12:01:
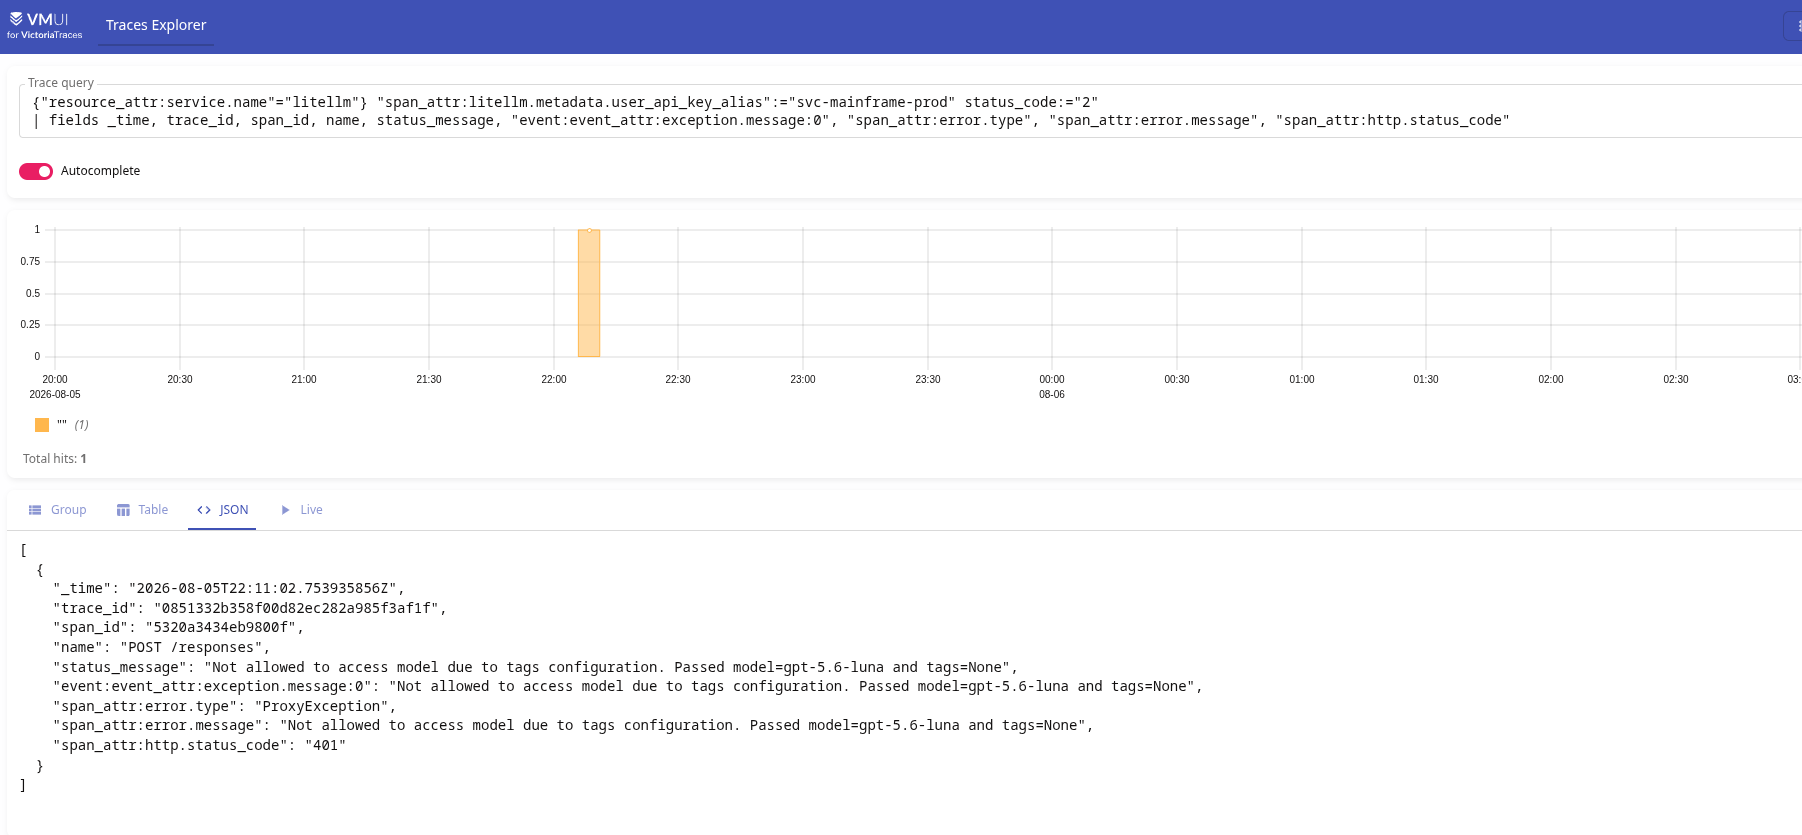
Here we have:
exception.message: “Not allowed to access model due to tags configuration. Passed model=gpt-5.6-luna and tags=None“exception.type: “ValueError“And we see the exact same single error in LiteLLM itself at 01:11:06. But this is Kyiv time, UTC+3, so that’s 22:11:06 UTC:
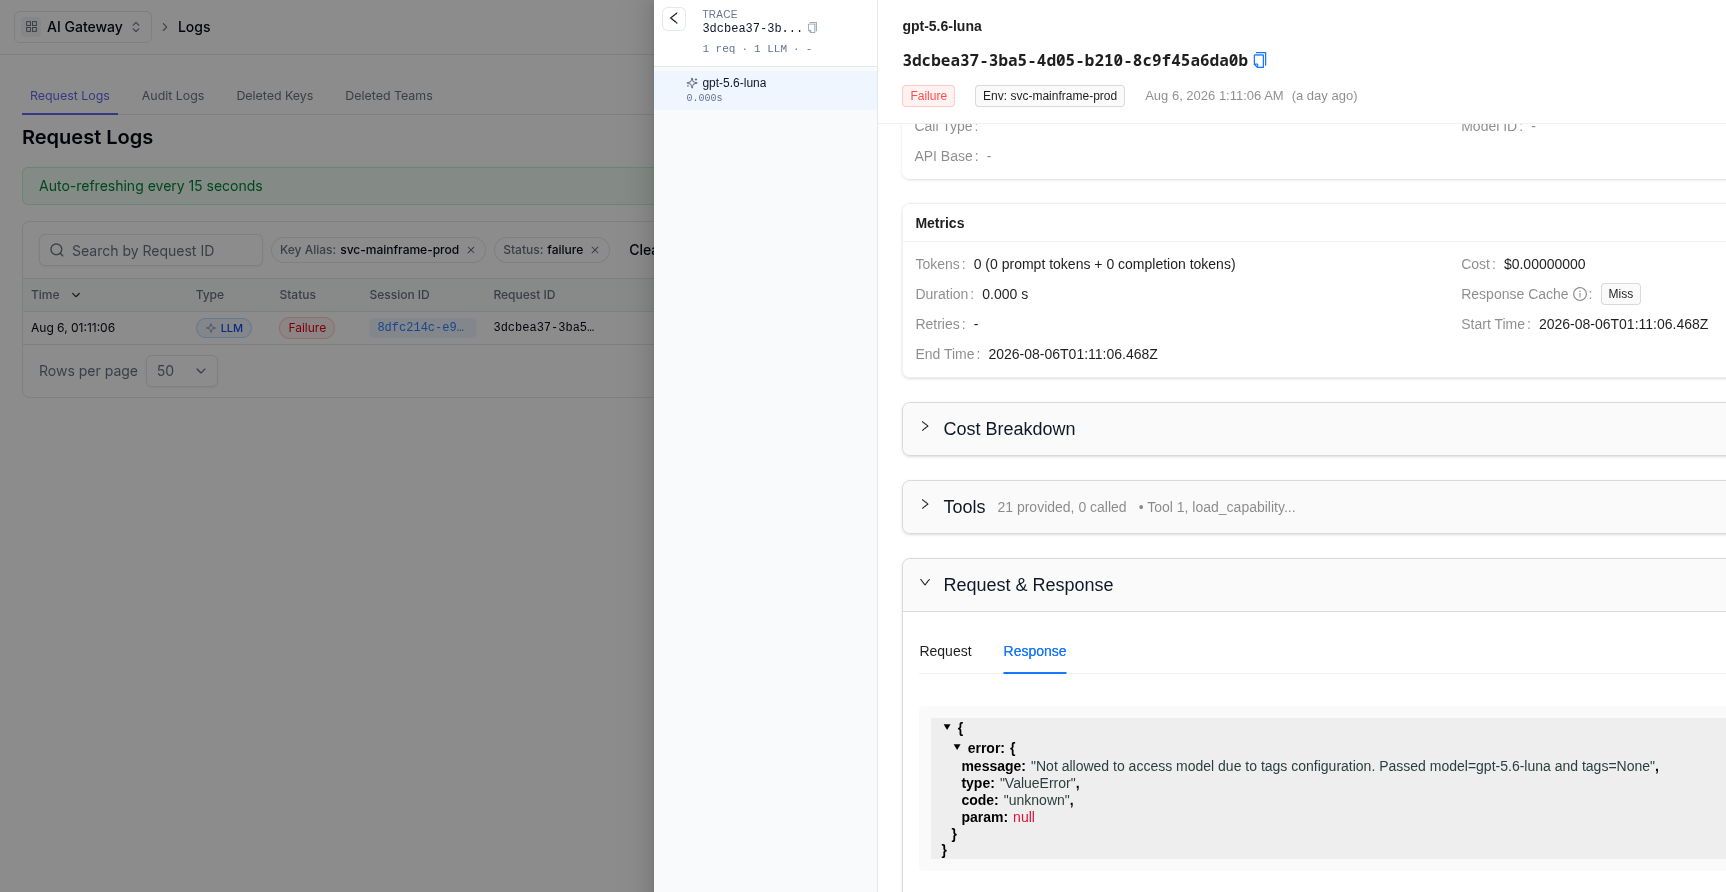
And the 4-second difference (22:11:02 in VictoriaTraces and 22:11:06 in LiteLLM) is because VictoriaTraces shows the request start time, from the moment the HTTP request is received, while in LiteLLM > Logs the event is recorded when the request finishes.
So, the traces tell us that the error happened once, but the litellm_deployment_failure_responses_total metric shows two spikes of errors at different times.
The VictoriaMetrics query is the same as what we saw in Grafana, except here we use increase() instead of rate():
sum(
  increase(
    litellm_deployment_failure_responses_total{
      exception_class="ValueError",
      api_key_alias="svc-mainframe-prod"
    }[5m]
  )
) by (
  api_key_alias,
  exception_class
)
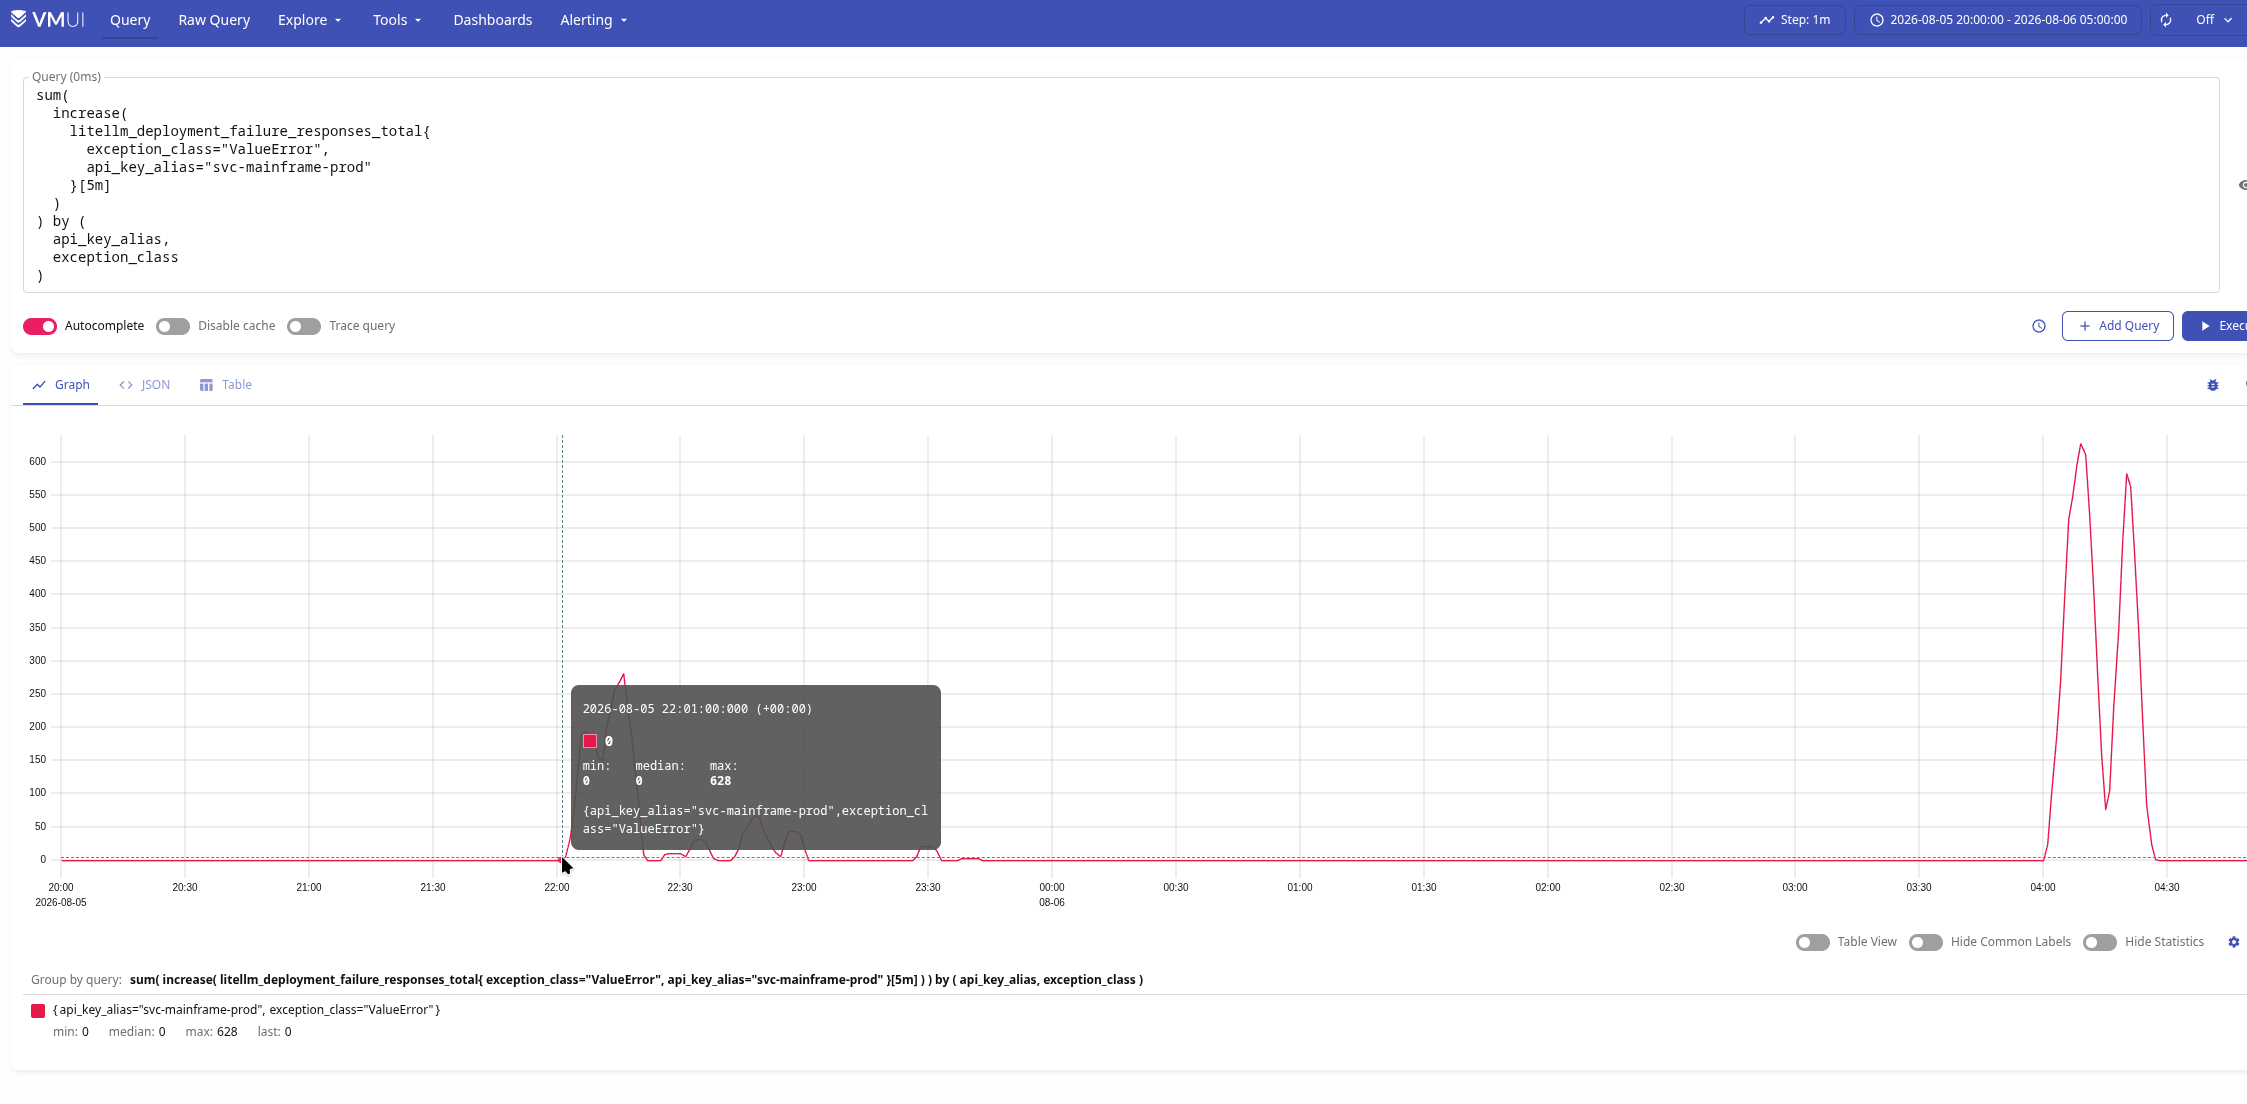
The errors started at 22:01:00, with the largest spike at that point at 22:16:00.
So, what do we have:
ValueError errors in the litellm_deployment_failure_responses_total metric during 22:00–23:30, and then again between 04:00–04:27So… WTF?
The first thing I got stuck on was the “litellm_deployment_failure_responses” metric itself.
In the official documentation, it is described as “Total number of failed LLM API calls for a specific LLM deployment“, and when I was digging into the metrics (see LiteLLM: metrics, traces and integration with VictoriaMetrics Stack), I interpreted this as “Errors that occurred during a request to or from the provider/model“.
But! If we run the same VictoriaMetrics query against litellm_deployment_failure_responses_total, but this time group it by the requested_model, litellm_model_name, api_provider and api_base labels, we get an interesting picture:
sum(
  increase(
    litellm_deployment_failure_responses_total{
      exception_class="ValueError",
      api_key_alias="svc-mainframe-prod",
      requested_model="gpt-5.6-luna"
    }[5m]
  )
) by (
  requested_model,
  litellm_model_name,
  api_provider,
  api_base,
  exception_class
)
The result:
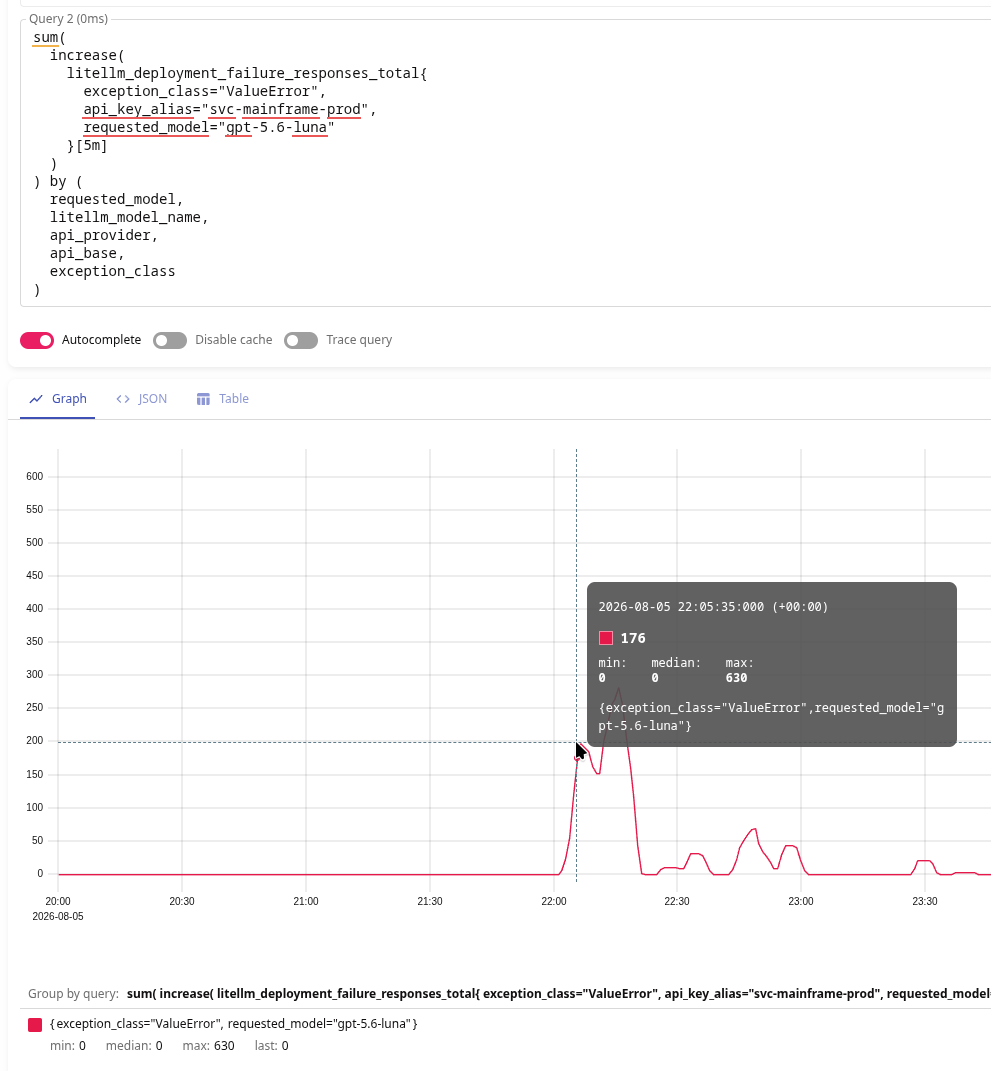
The requested_model label has a value, but all the others are empty.
This means that when we received the request from the client, LiteLLM couldn’t find a Deployment/model to send that request to and, therefore, as part of this routing attempt, the request never reached the provider.
At the same time, the client request may still eventually be handled through fallback routing, but we’ll get to that a bit later.
I wrote about tag based routing and fallbacks in LiteLLM: OpenRouter and Fallbacks configuration, and this problem is related exactly to the routing tag_regex config described there.
For now, though, I’m interested in something else: the litellm_deployment_failure_responses_total metric gets incremented even when no deployment has been selected yet and no request to the provider was made at all. So litellm_deployment_failure_responses_total is not just about “errors that occurred during a request to or from the provider/model” and the provider API, but also about LiteLLM’s own internal behavior.
To understand what exactly triggers litellm_deployment_failure_responses_total, let’s take a look at the LiteLLM code.
litellm_deployment_failure_responses is a counter created using the standard Prometheus library prometheus-client.
Here’s where it gets incremented in the LiteLLM code, in prometheus.py:
...
 def set_llm_deployment_failure_metrics(self, request_kwargs: dict):
    ...
    exception: Final = request_kwargs.get("exception", None)
          ...
          if exception is not None:
                PrometheusLogger._inc_labeled_counter(
                    self,
                    self.litellm_deployment_failure_responses,
                    "litellm_deployment_failure_responses",
                    enum_values,
                    label_context=_deployment_label_ctx,
                )
...
And the ValueError comes from tag_based_routing.py:
async def get_deployments_for_tag(
  ...
            if len(new_healthy_deployments) == 0 and len(default_deployments) == 0:
                raise ValueError(
                    f"{RouterErrors.no_deployments_with_tag_routing.value}."
                    f" Passed model={model} and tags={request_tags}"
                )
  ...
Where “RouterErrors.no_deployments_with_tag_routing.value” has exactly the same message in router.py:
class RouterErrors(enum.Enum):
    ...
    no_deployments_with_tag_routing = "Not allowed to access model due to tags configuration"
    ...
So, the litellm_deployment_failure_responses_total metric gets incremented not only for provider errors, but also for errors in LiteLLM’s own internal mechanisms. In this case, those are routing/model selection errors.
And if we look at the logs:
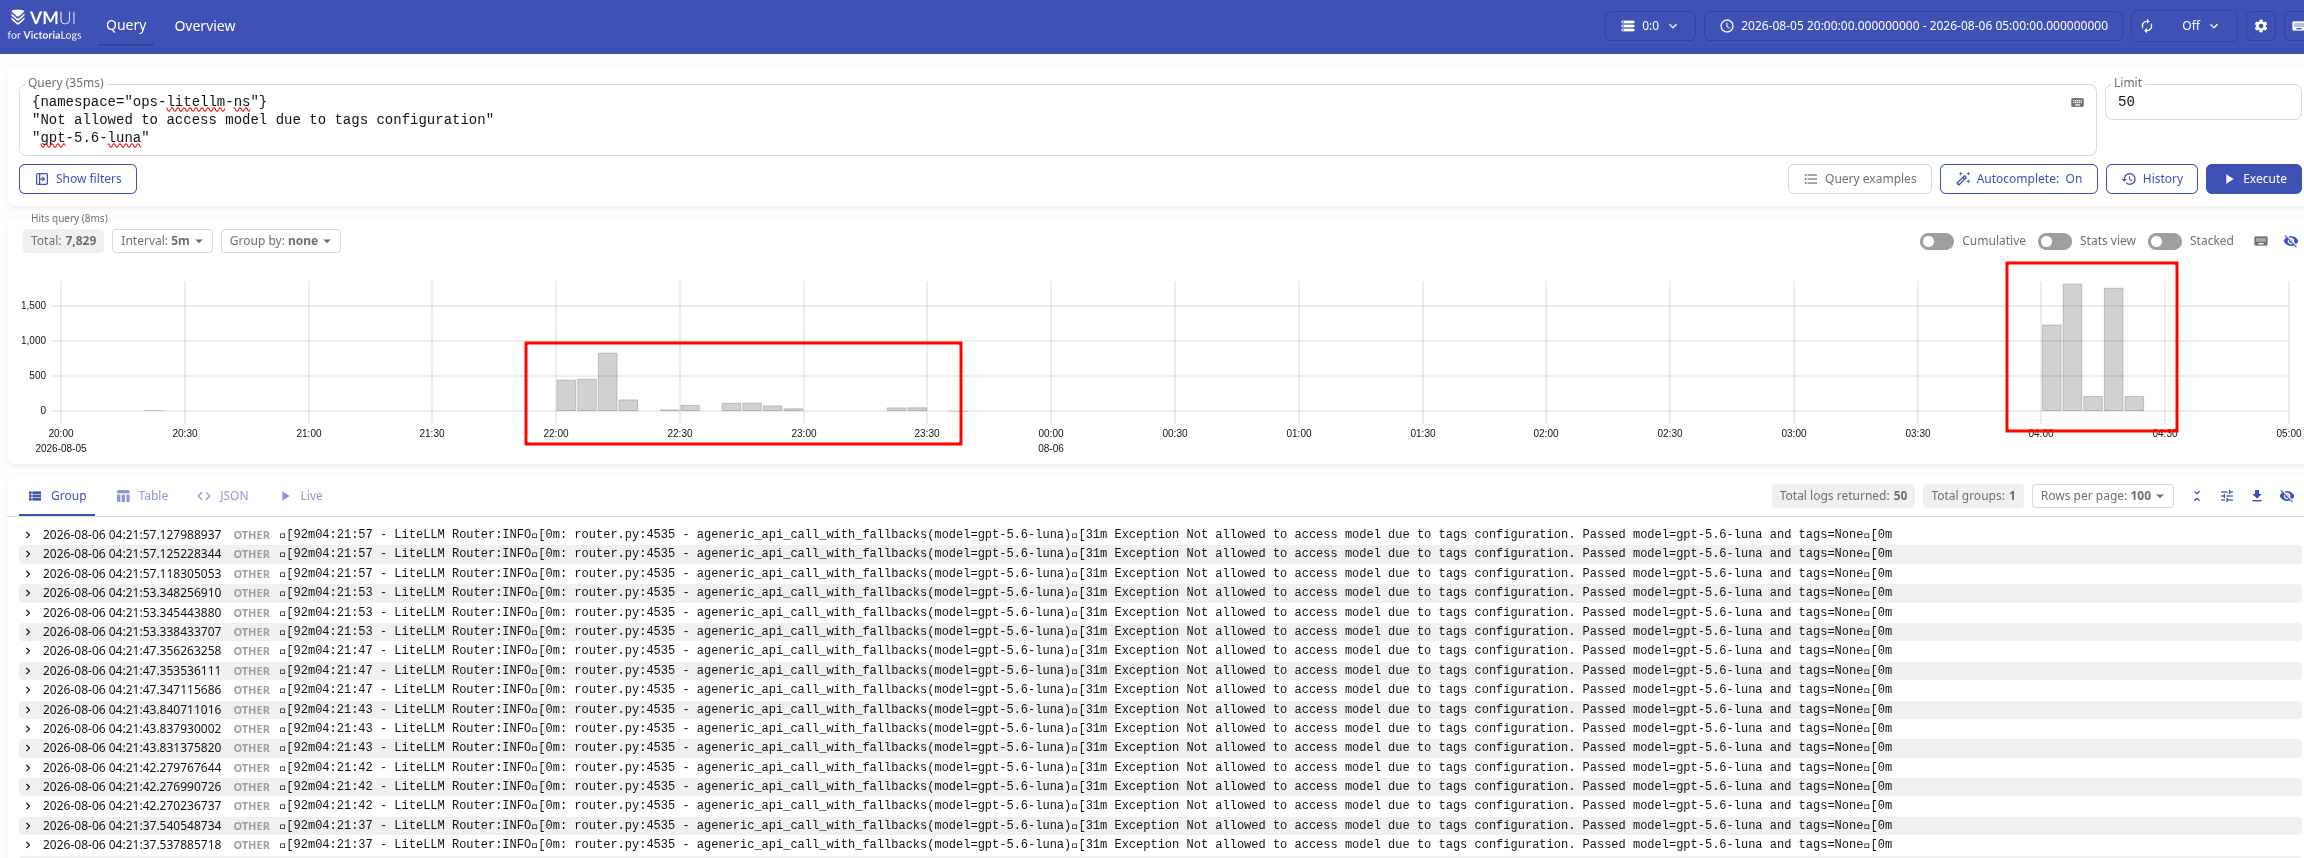
Then all this time it was the same issue with tags, not with requests to the provider.
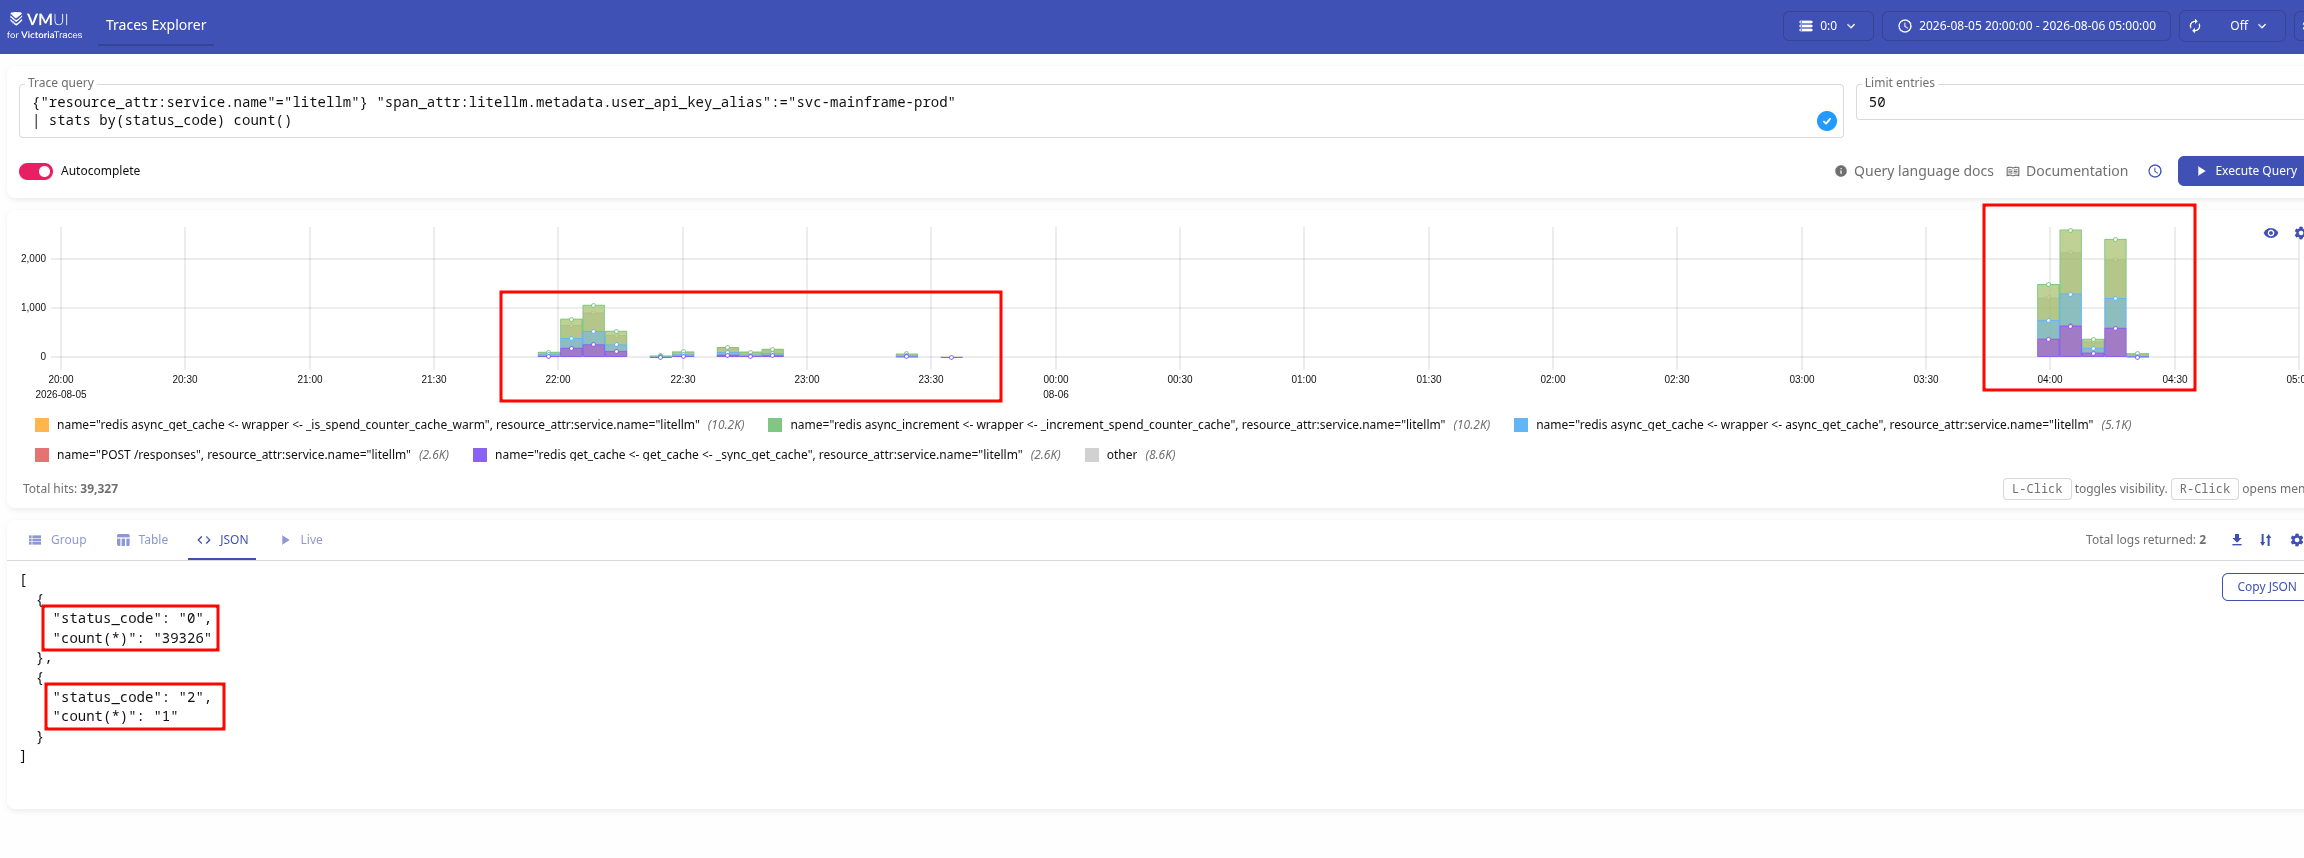
But… at the same time, there was only one actual error returned to the client, the one we see in the traces, because in all the other cases the fallback worked and the client eventually got its response:
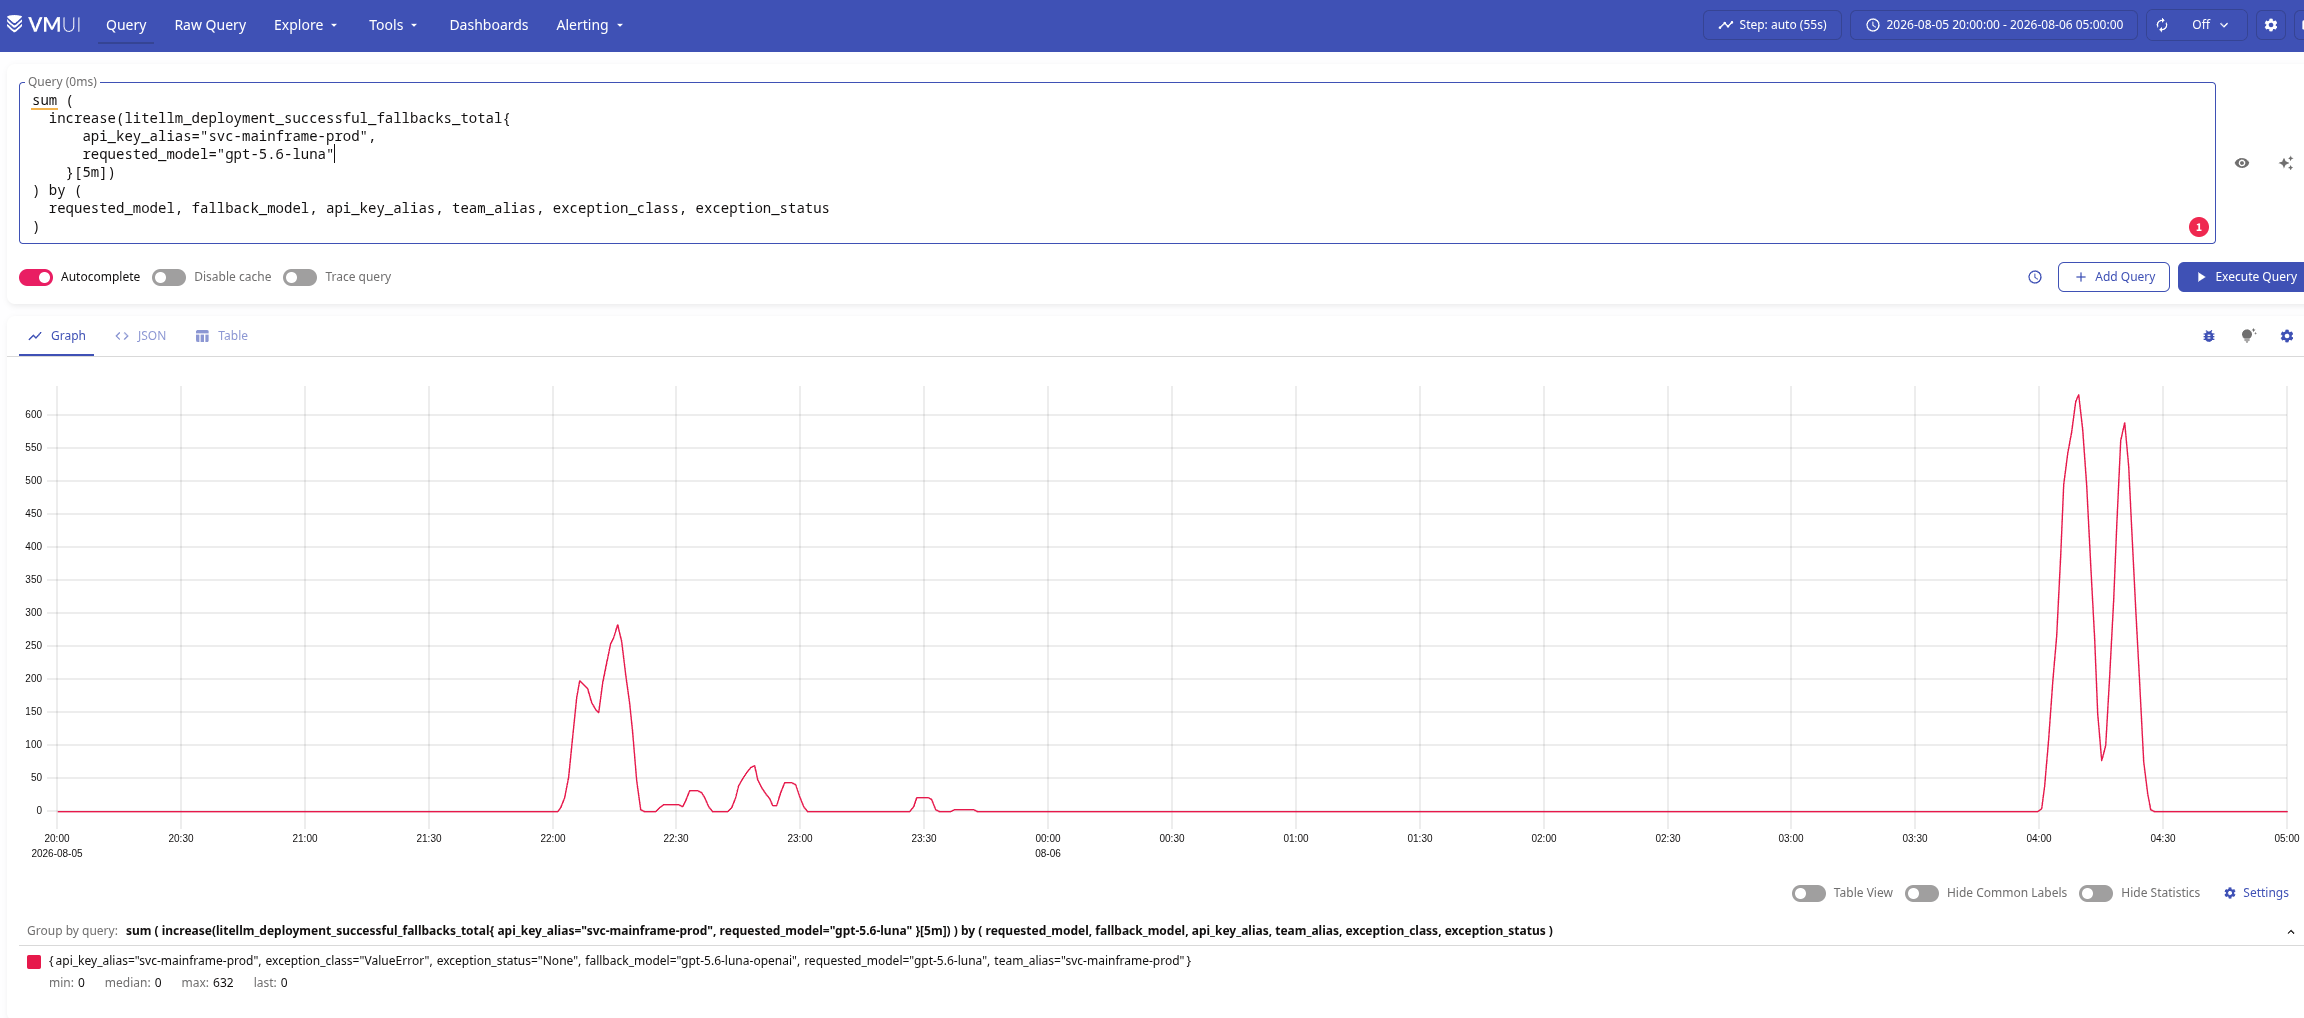
And we can see those fallbacks in litellm_deployment_successful_fallbacks_total:
But then…
Where did that single trace with status_code="2" come from?
If we look at the litellm_deployment_failed_fallbacks_total metric, then right around 22:12 we can see a failed fallback:
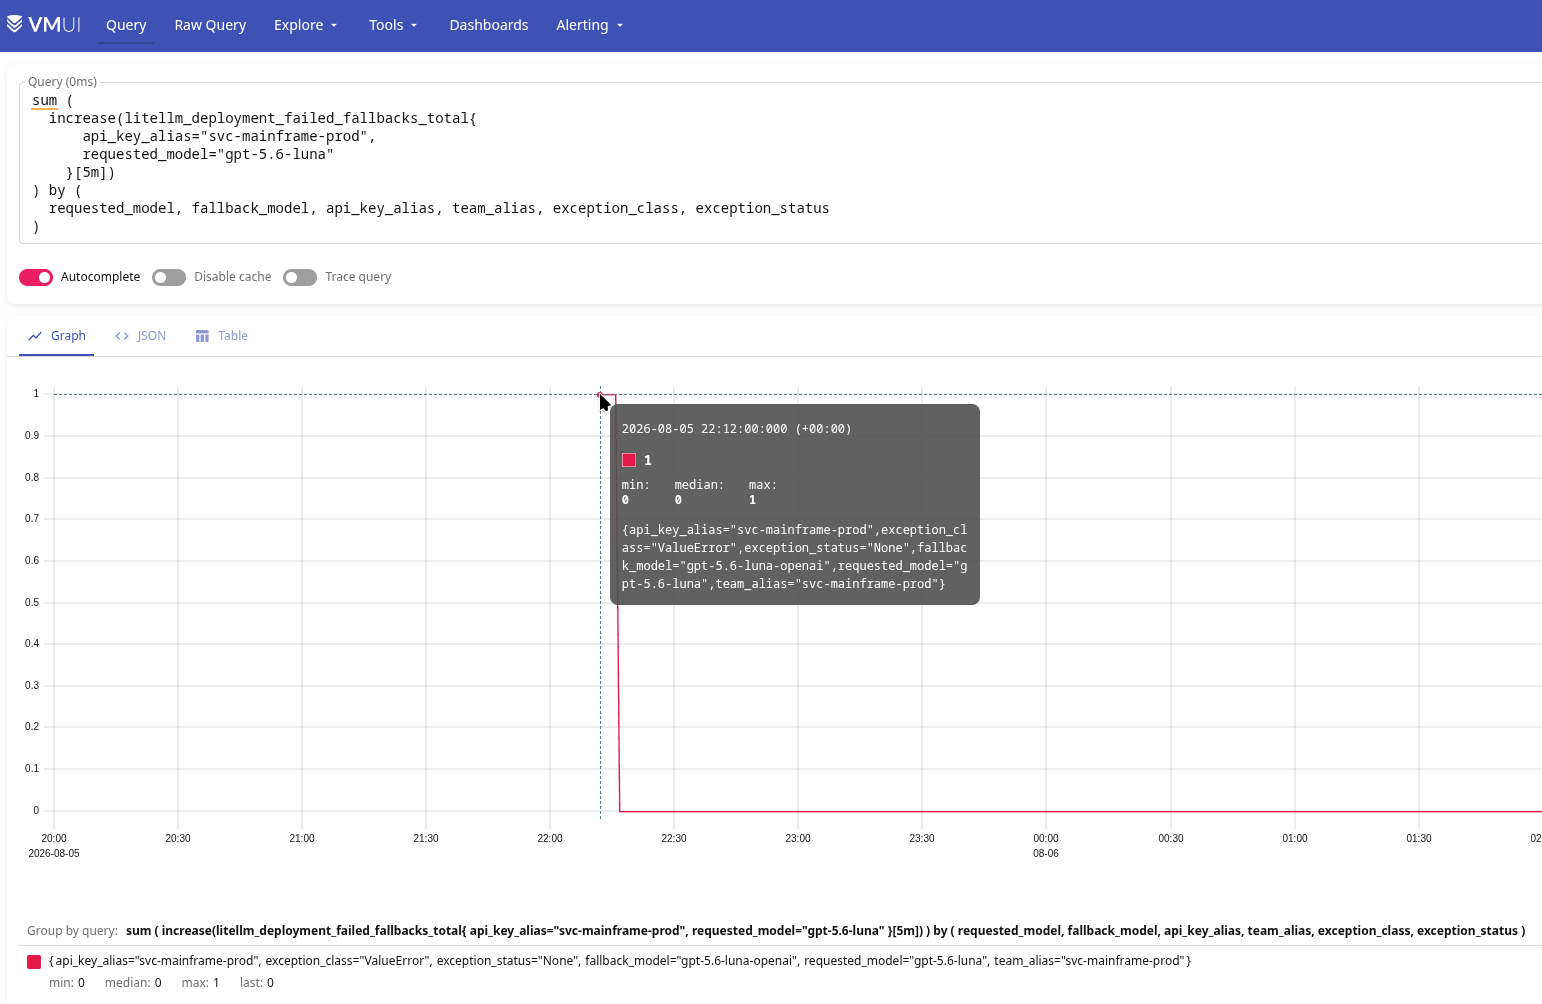
And that’s the one that ended up in the traces with ValueError, but this time for a different reason, which we found in the logs as the OpenAI message “Invalid prompt: your prompt was flagged as potentially violating our usage policy“:
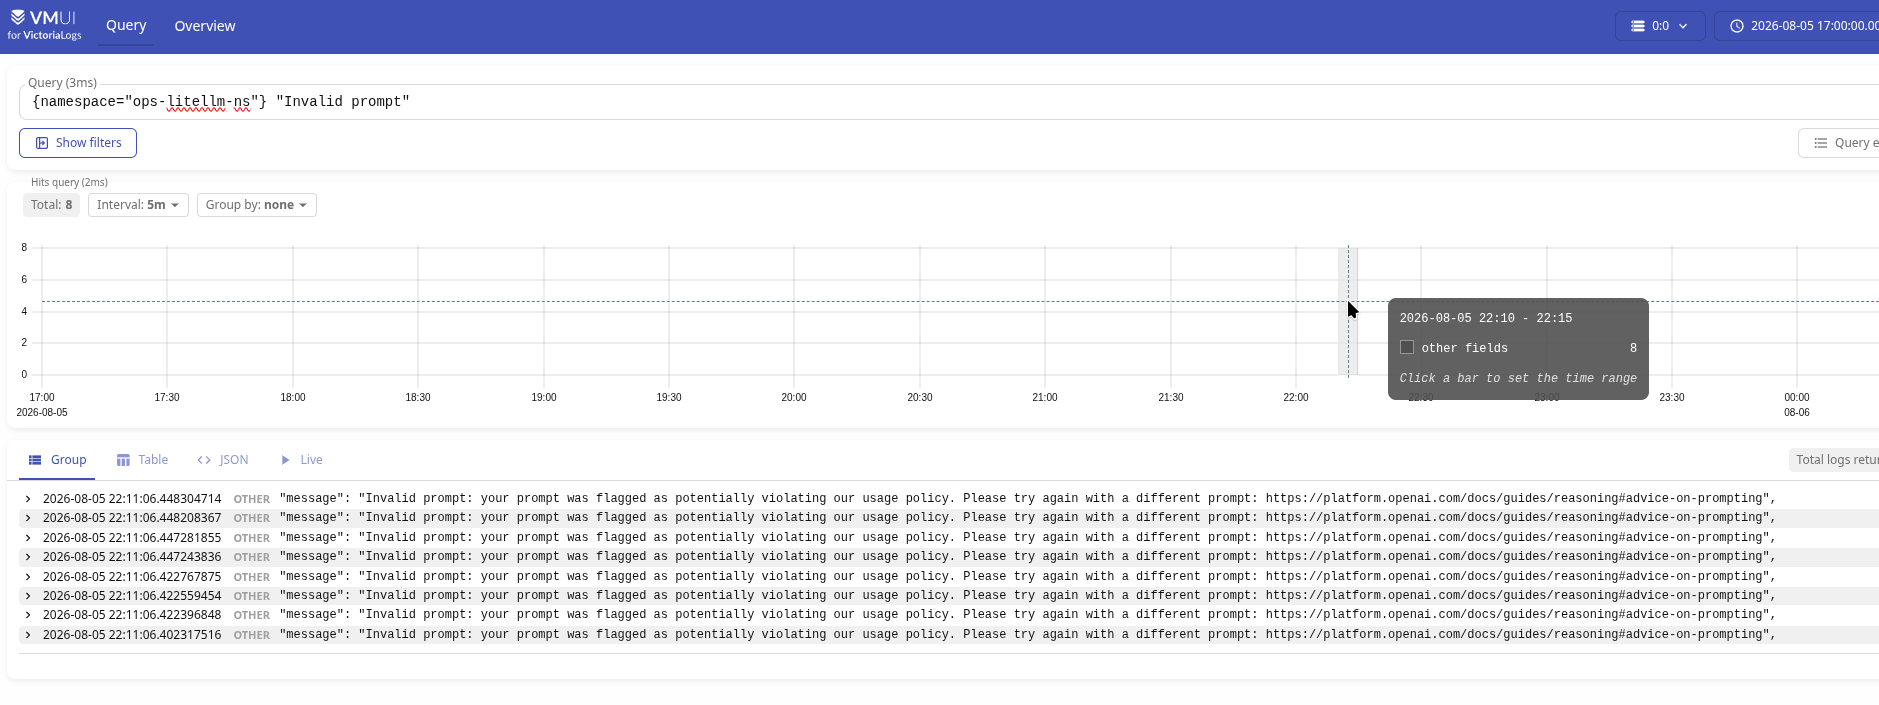
So:
ValueError
litellm_deployment_failure_responses_total{exception_class="ValueError"} increased by 1ContentPolicyViolationError in exception_mapping_utils.py)litellm_deployment_failed_fallbacks_total and litellm_proxy_failed_requests_metric_total metricsBut if we got a ContentPolicyViolationError, then why did the exception_class in the litellm_deployment_failed_fallbacks_total and litellm_proxy_failed_requests_metric_total metrics still show ValueError?
Back to the LiteLLM code: at the beginning of async_function_with_fallbacks_common_utils(), LiteLLM stores the initial tag-routing ValueError in original_exception:
...
    async def async_function_with_fallbacks_common_utils(
        ...
        original_exception = e
...
And the ContentPolicyViolationError received during the fallback goes into a separate new_exception and gets written to the log, while the Router returns original_exception with the ValueError value that came from the routing error:
...
        except Exception as new_exception:
        ...

        raise original_exception
...
As a result, we see ValueError everywhere, which is reasonable in a way, because that was the original root cause. But the error actually returned to the client was caused by the ContentPolicyViolationError, which we can see only in the logs.
And if tag routing had completed without errors, then we would have seen ContentPolicyViolationError itself as the exception_class.
So, what do we end up with:
litellm_deployment_failure_responses_total metric is not only about provider API errors, and it can be incremented by internal LiteLLM errors even before a deployment is selected, for example during routingexception_class="ValueError" tells us only the error class, not the specific cause, and ValueError can be raised in different parts of the code, so every such case is worth investigating separately, at least while you’re still getting familiar with LiteLLMValueError, while the reason the fallback failed, the ContentPolicyViolationError from OpenAI, remained only in the logsI wrote about RecordingRules in VictoriaLogs: creating Recording Rules with VMAlert.
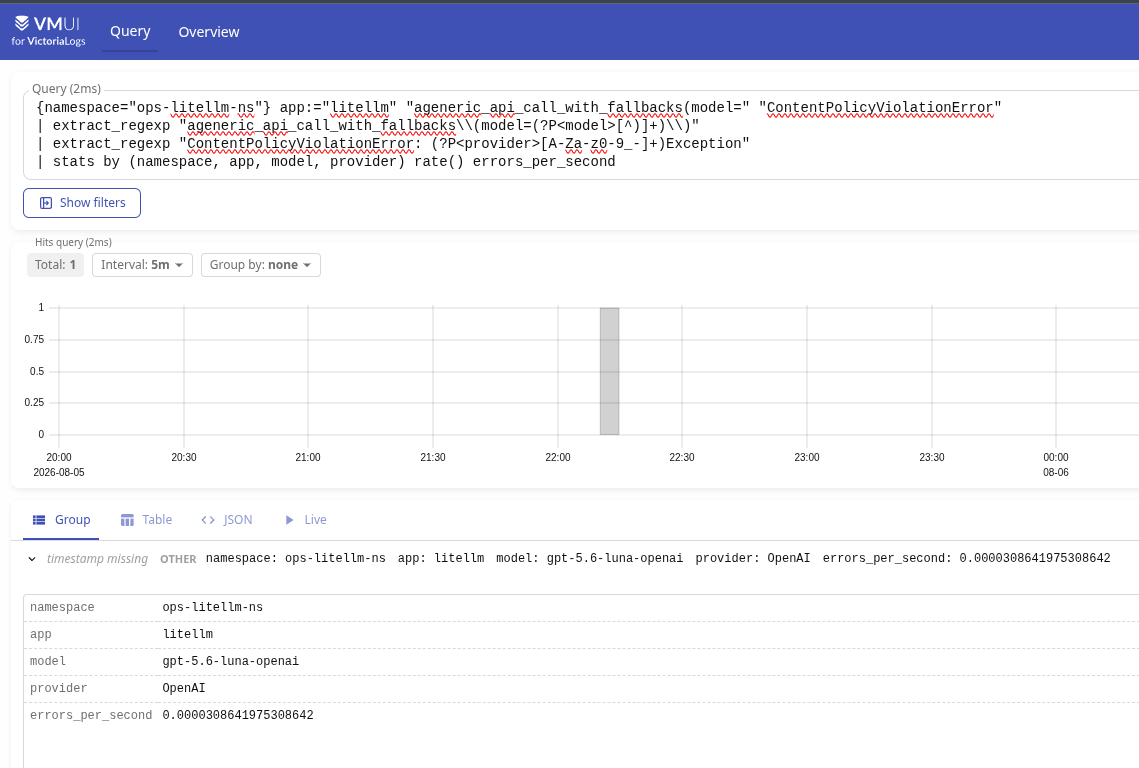
Let’s add a new rule: create the vmlogs:litellm:logs:content_policy_violation:rate metric with the model and provider labels:
- record: vmlogs:litellm:logs:content_policy_violation:rate
  expr: |
    {namespace="ops-litellm-ns"} app:="litellm" "ageneric_api_call_with_fallbacks(model=" "ContentPolicyViolationError"
    | extract_regexp "ageneric_api_call_with_fallbacks\\(model=(?P<model>[^)]+)\\)"
    | extract_regexp "ContentPolicyViolationError: (?P<provider>[A-Za-z0-9_-]+)Exception"
    | stats by (namespace, app, model, provider) rate() errors_per_second
Let’s check the result in VictoriaLogs itself:
And add an alert:
- alert: LiteLLM Content Policy Violation
  expr: |
    sum by (namespace, app, model, provider) (
      vmlogs:litellm:logs:content_policy_violation:rate
    ) > 0
  for: 1s
  labels:
    component: devops
    environment: ops
    severity: warning
    ilert_routingkey: devops-ops-warning
  annotations:
    summary: LiteLLM Content Policy Violation
    description: |-
      An LLM provider rejected a LiteLLM request due to its content policy.
      *Namespace*: `{{ "{{" }} $labels.namespace }}`
      *Application*: `{{ "{{" }} $labels.app }}`
      *Model*: `{{ "{{" }} $labels.model }}`
      *Provider*: `{{ "{{" }} $labels.provider }}`
      *Rate*: `{{ "{{" }} $value | humanize }}`/s
      <https://{{ $.Values.monitoring.root_url }}/d/adrmshg/litellm-system-overview |:grafana: LiteLLM System overview>
Done.

此内容由惯性聚合(RSS阅读器)自动聚合整理,仅供阅读参考。 原文来自 — 版权归原作者所有。