









The Department for Work and Pensions has published its latest release of Households Below Average Income (HBAI), its flagship data source on household incomes and poverty. This release provides outturn figures for 2024–25.
Our focus on the living standards of low and middle income households at Resolution Foundation means we are always very excited by this publication. But this year’s release is particularly significant as it marks the first time DWP has published estimates of household incomes that combine people’s responses to the survey with information from DWP’s benefit administration records.
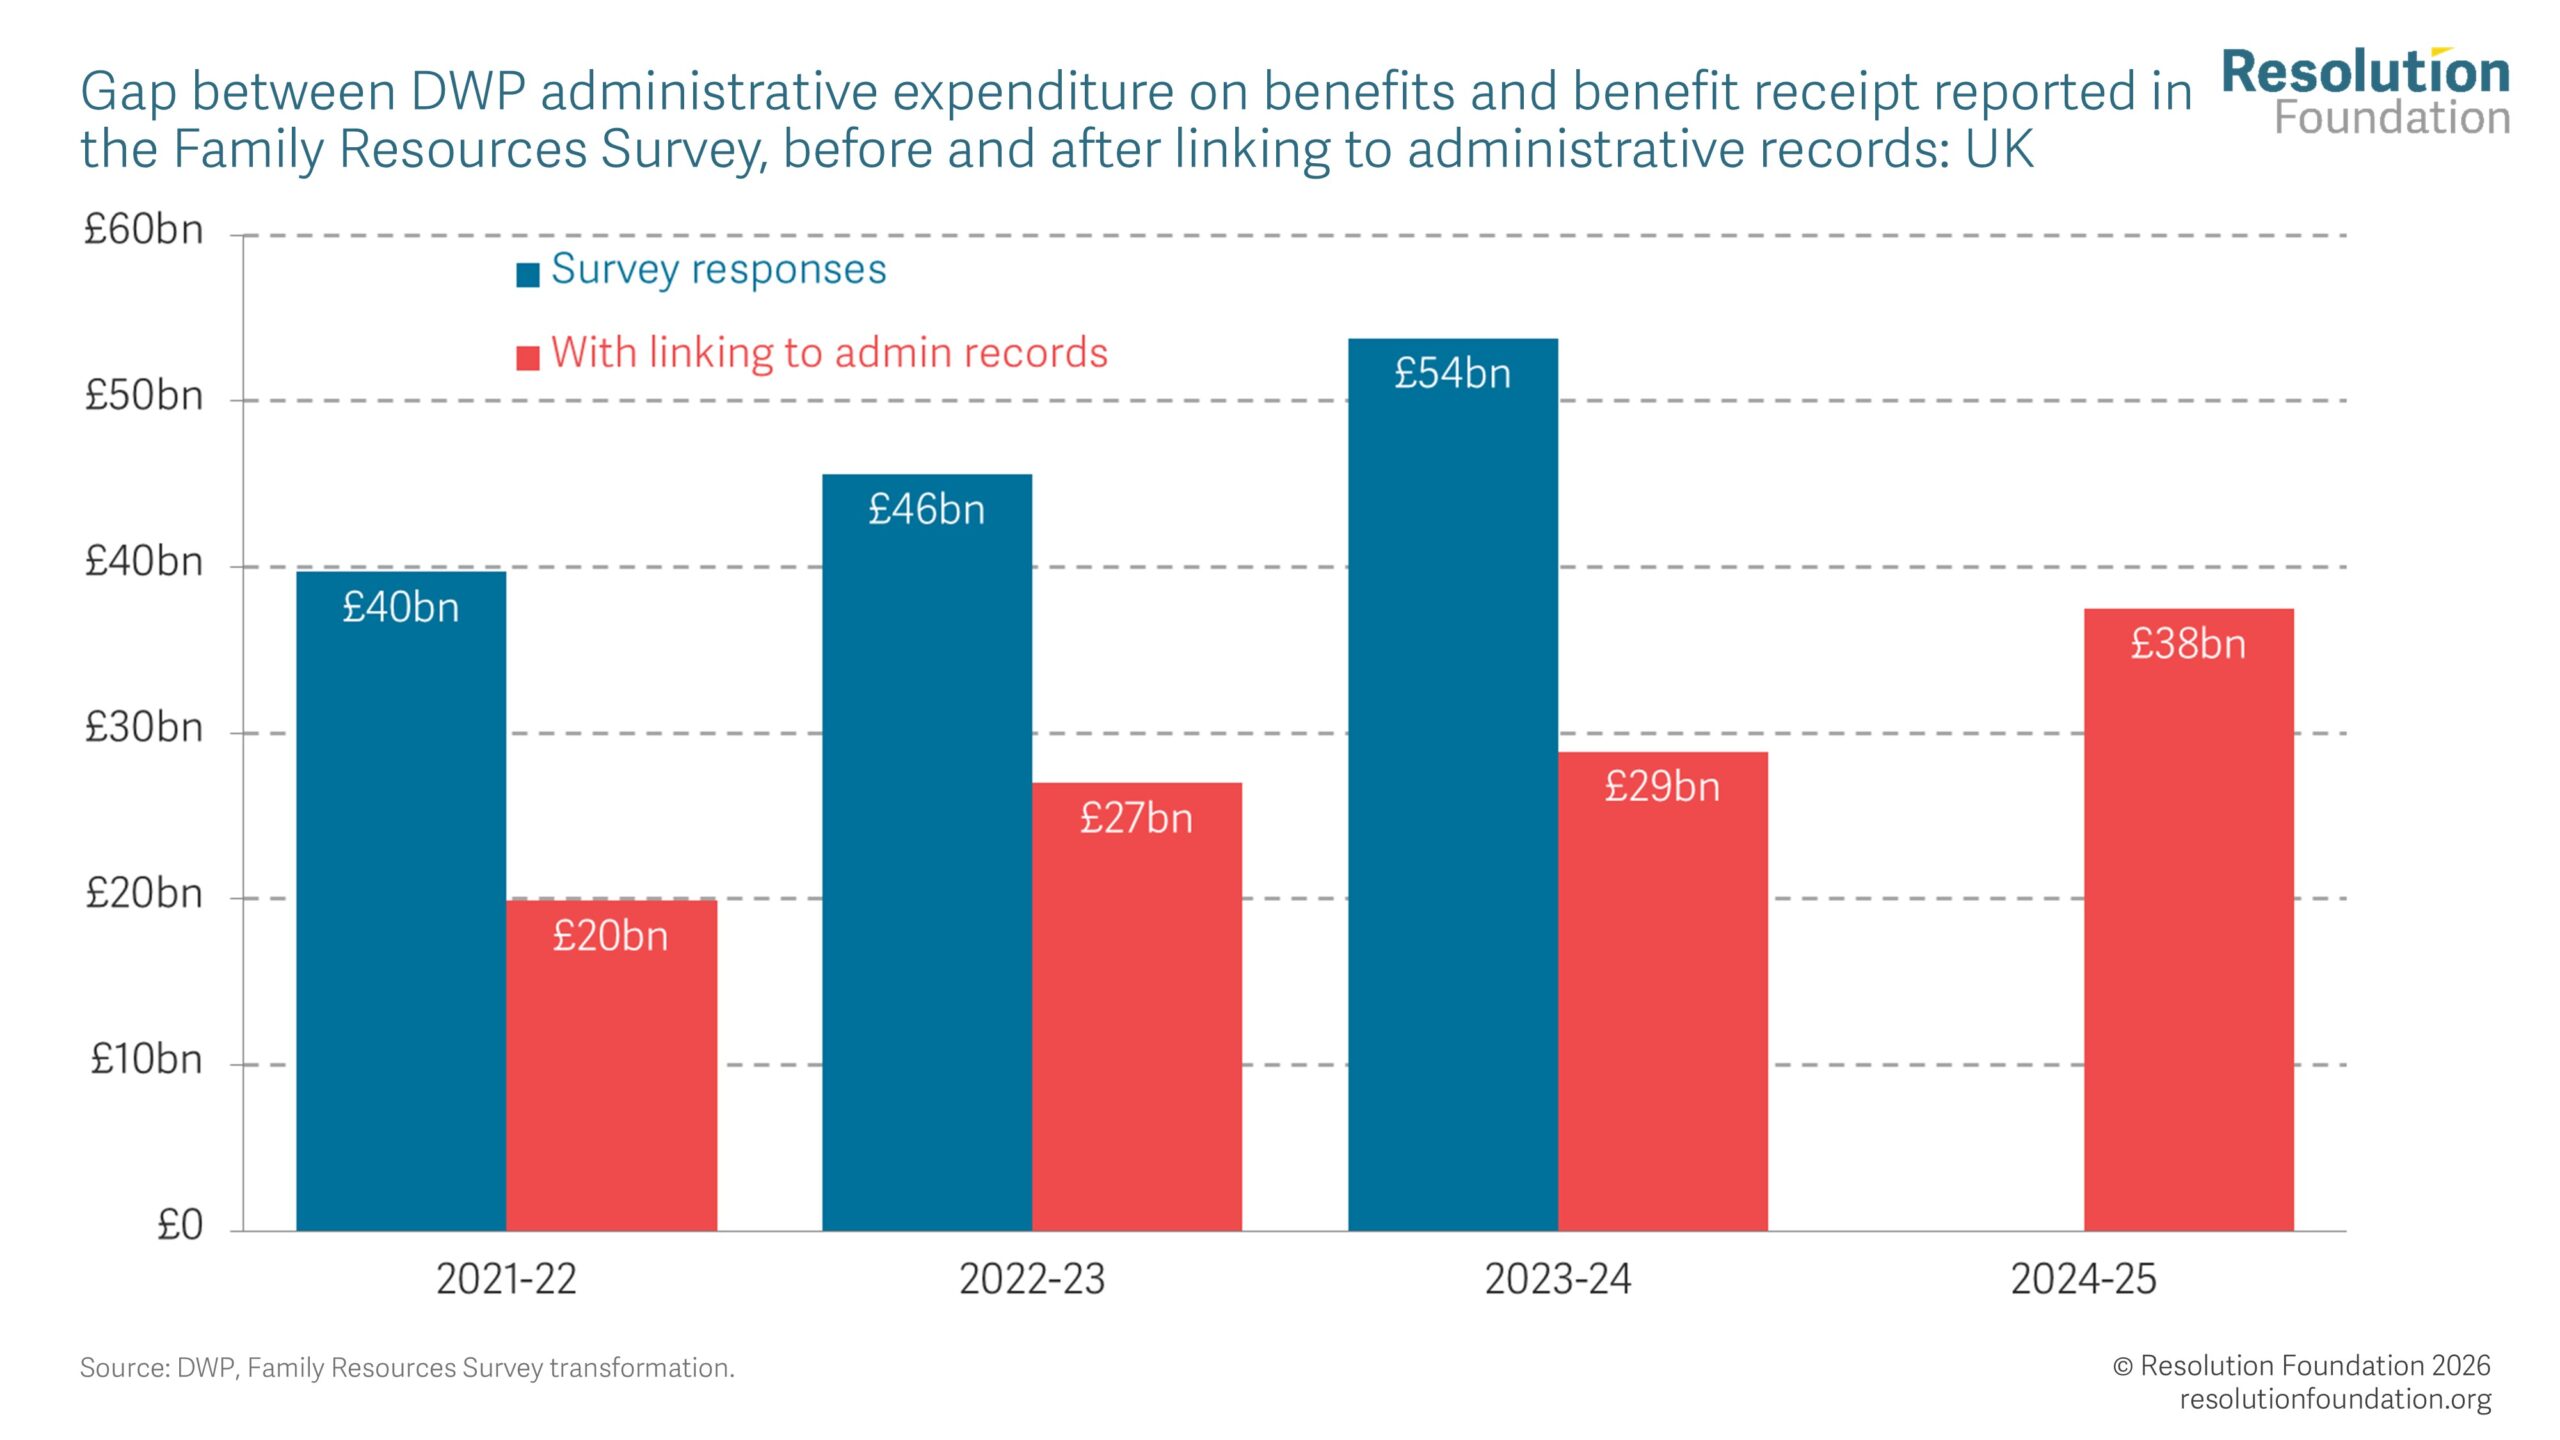
For many years, we have been aware that the income from social security benefits captured by the Family Resources Survey (the survey underpinning HBAI) falls well short of what DWP’s administrative data shows is actually spent. The latest estimates show around £40 billion in 2021-22, £46 billion in 2022-23 and £54 billion in 2023-24 was missing in the FRS sample compared with administrative records.
There are two main reasons for this gap. First, some respondents (most likely unknowingly) under-report some of their benefit income; and second, benefit-receiving households are under-represented in the survey sample, even after it has been weighted to match population totals. Linking survey responses to DWP’s records addresses the first of these by replacing reported figures with verified data for major DWP and HMRC benefits (including the State Pension). The latest publication applies this method back to 2021-22, with further revisions to 2018-19 due this summer. As shown in Figure 1, linking survey responses to administrative records has made up between £19 billion and £25 billion of the benefit income missing from the final survey in each year.
Figure 1: There is a shortfall between benefit incomes in Family Resources Survey responses and DWP benefit expenditure
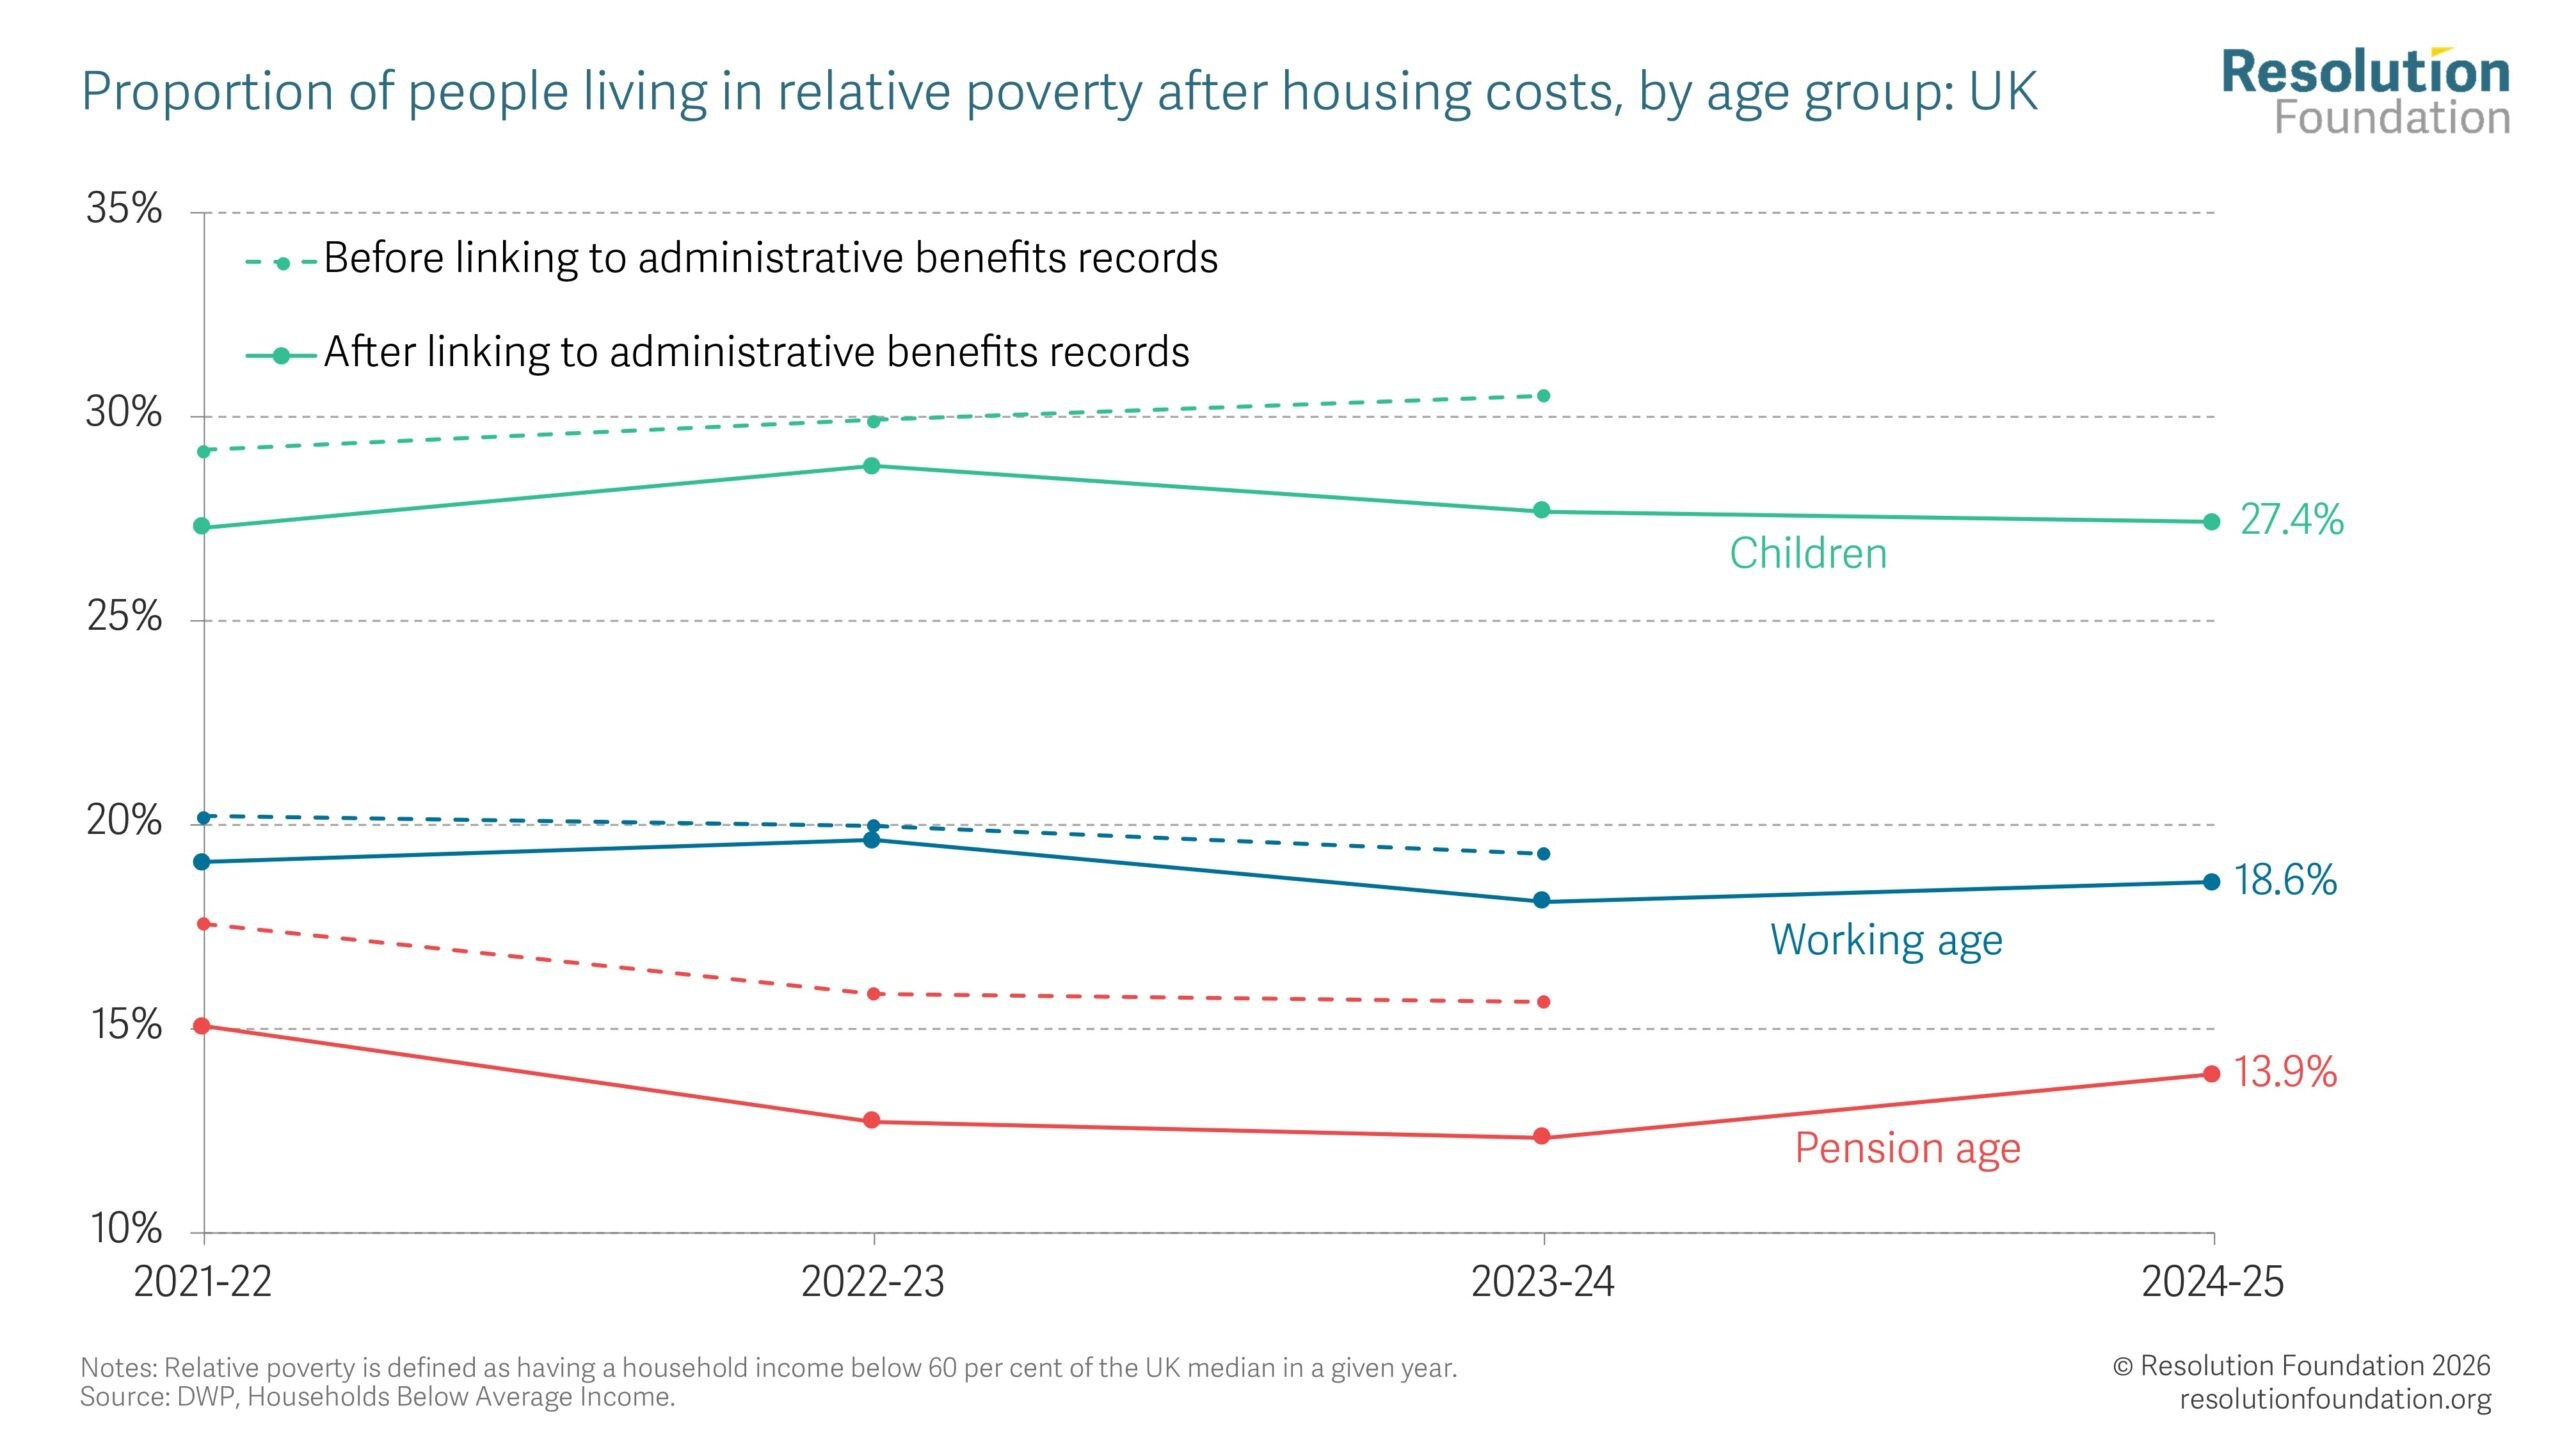
DWP has been working on this improvement for many years – FRS respondents were first asked for consent to link their information to administrative records in 2007 – and the more accurate picture of household incomes that it gives us is very welcome. However, there are some important implications to be aware of. Most notably, the effect of the changes to date mean that poverty rates for 2021-22 to 2023-24 have been revised downwards: for example, estimates of relative poverty after housing costs in 2023-24 are now 2.8 percentage points lower for children, 1.2 percentage points lower for working-age adults, and 3.3 percentage points lower for pensioners than before the data was admin linked (see Figure 2). This means there were about half a million fewer children in poverty in 2023-24 than previously thought (4.5 million versus 4.0 million). This is not surprising. With more complete information on income from social security benefits, the estimated incomes of low-income households rise, meaning fewer households fall below the poverty line (median income, and therefore the poverty line, will also rise as a result of this change, but by less in proportional terms than does the income of low-income households).
Figure 2: More accurate estimates of the incomes of low-income households means poverty rates have been revised down
Crucially, this data revision should not be mistaken for real-world progress, and it certainly should not call into question the Government’s poverty-reducing ambitions, the Child Poverty Strategy and the imminent repeal of the two-child limit. This revision does not mean that poverty has fallen, we just now have a better picture of it. Nor does the revised data change the trajectory of future child poverty projections from 2024-25 onwards, which showed a sharp rise each year before the announcement of the end of the two-child limit. These projections model benefit receipt rather than relying on survey responses, and adjust the levels to match outturn data, which means their trajectory is not affected by underreported benefit income in the survey.
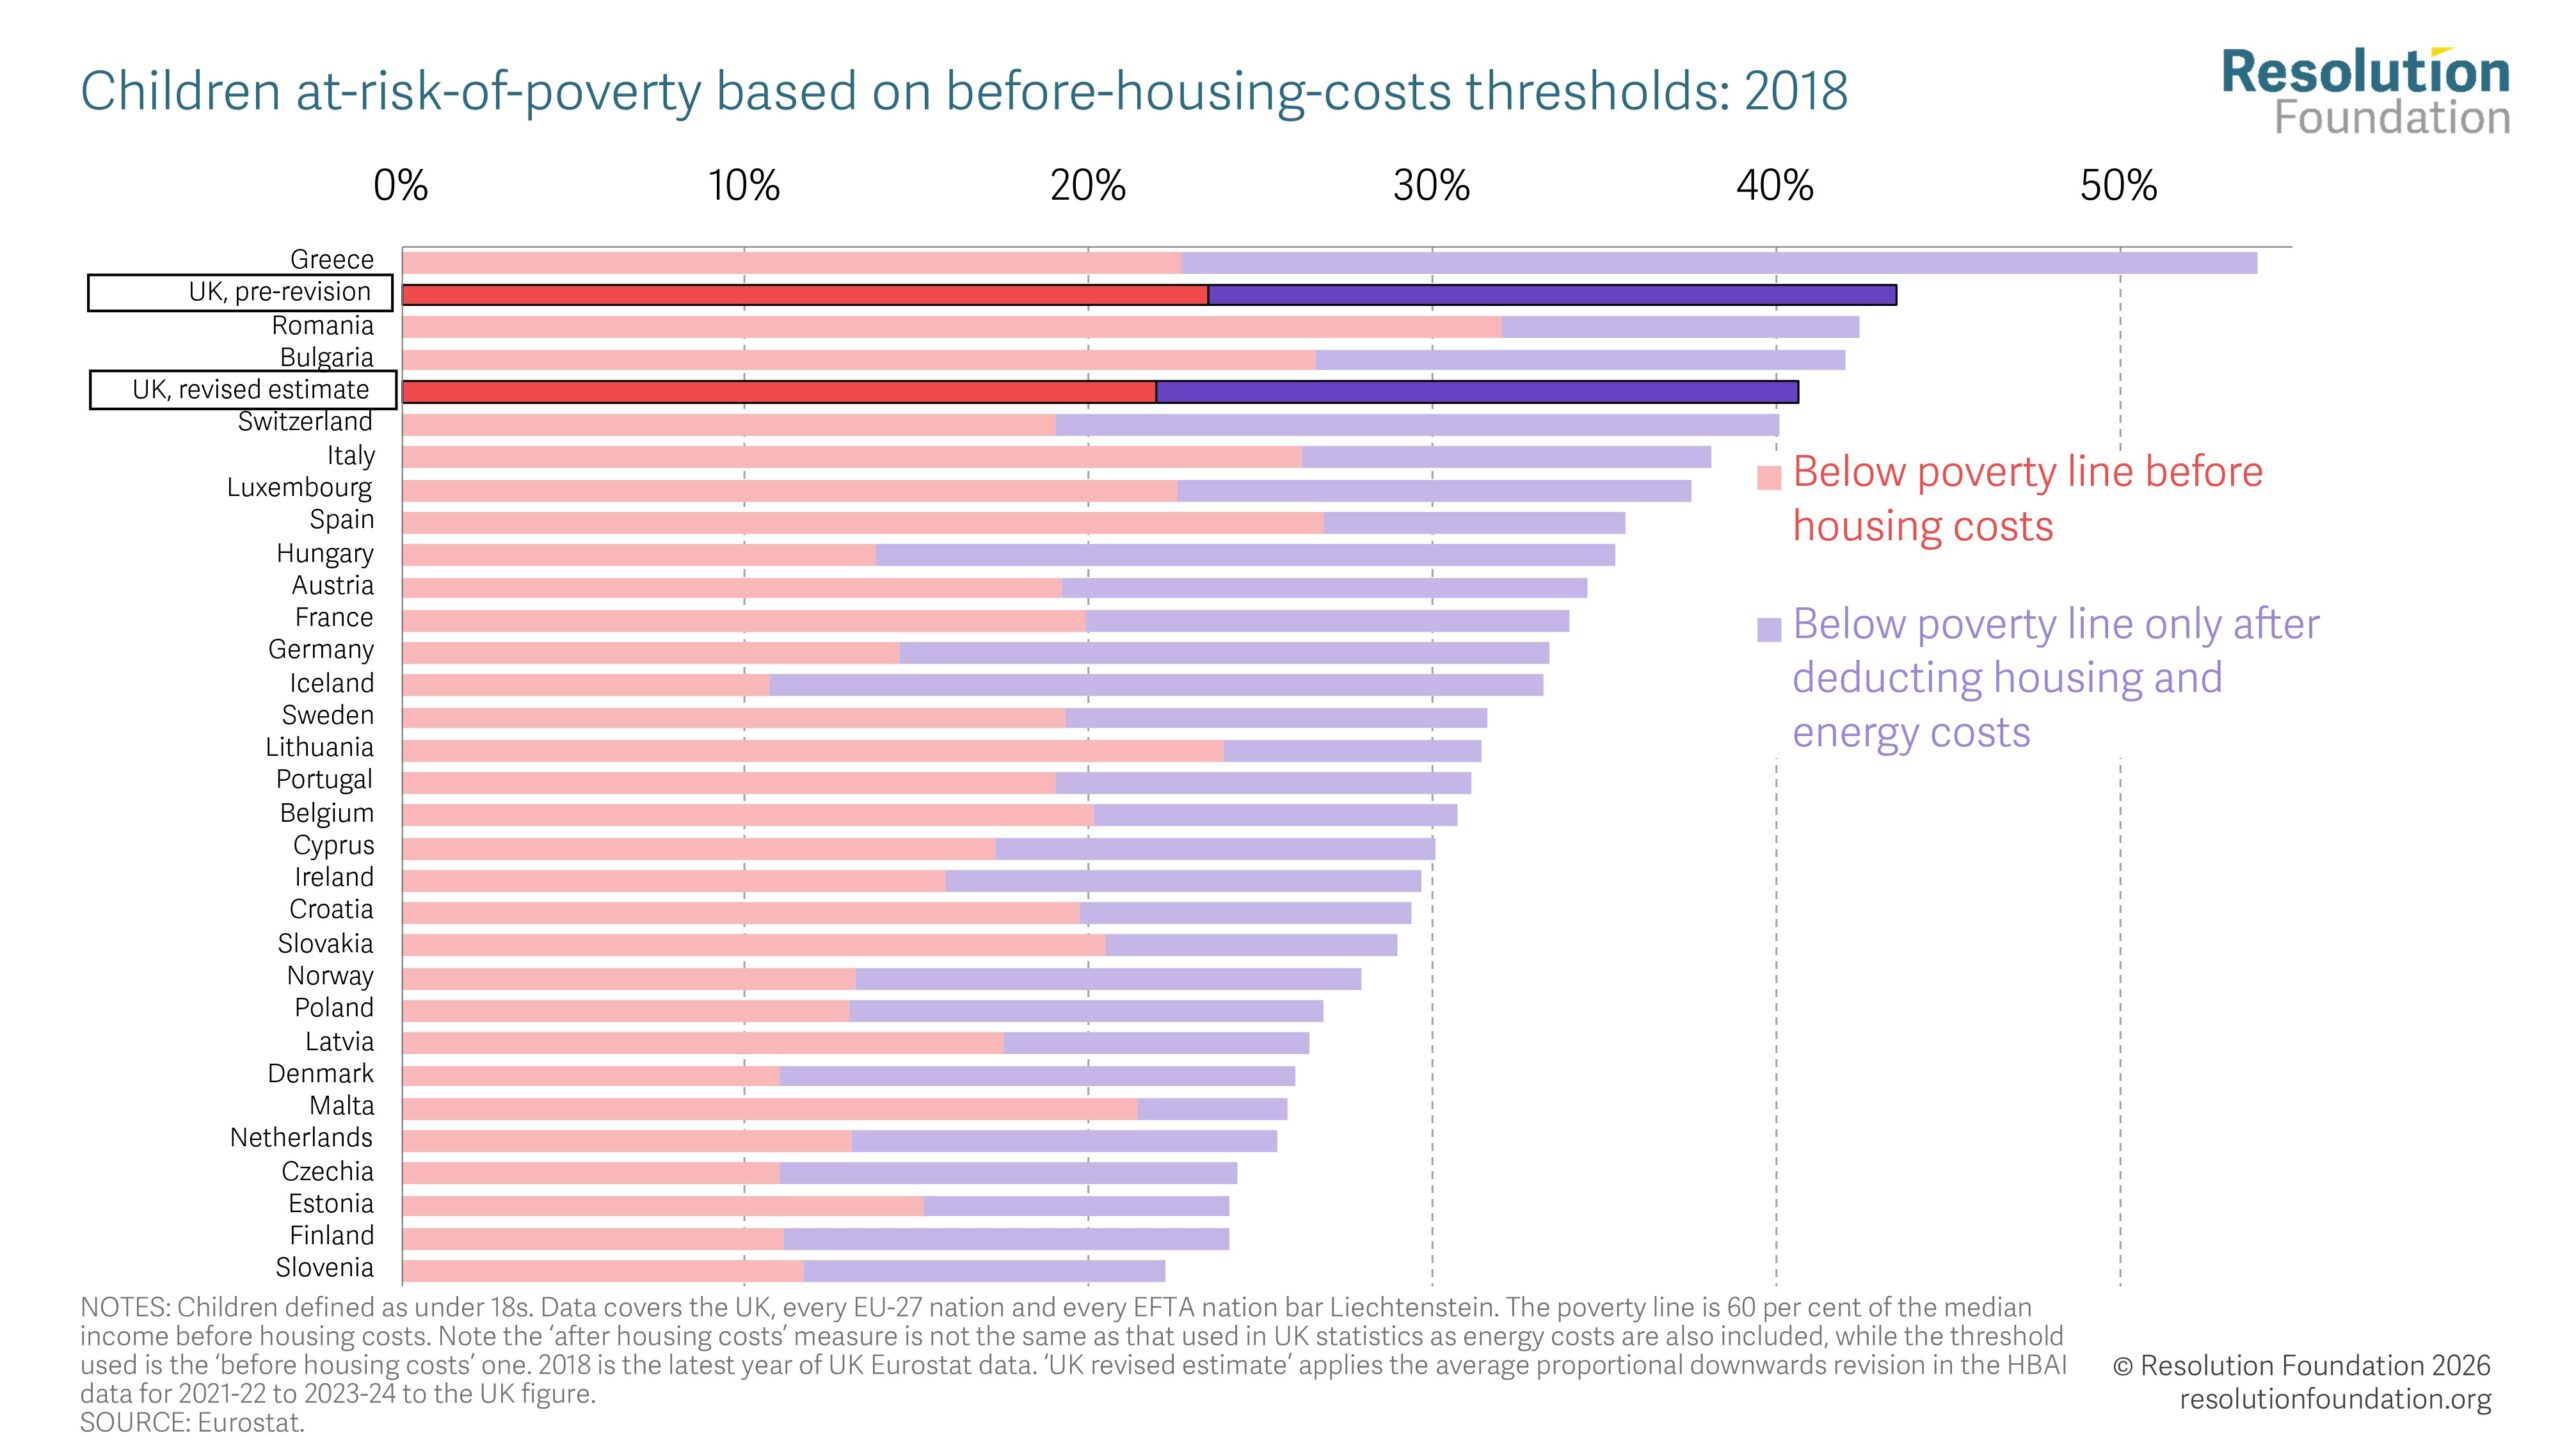
And even after the revision, the rate of child poverty in the UK remains high. The new estimates of child poverty rates in 2024-25 are now around what they were back in 2013-14, and if the 2013-14 rates were overstated because of the same problem, the 2024-25 rate would be worse. The UK is still likely to be one of the worst countries in Europe for child poverty: previous international data on child poverty (from 2018 – the most recent available data that includes the UK) has shown the UK as having a worse record for child poverty after housing costs than any EU country except Greece. The measure used is slightly different from that used in HBAI, but if the UK figure were revised by the same proportion as the relative child poverty rate in HBAI has been, this would leave the UK better than only three EU countries, Greece, Romania and Bulgaria, as Figure 3 illustrates.i
Figure 3: The UK is still likely one of the worst countries in Europe for child poverty
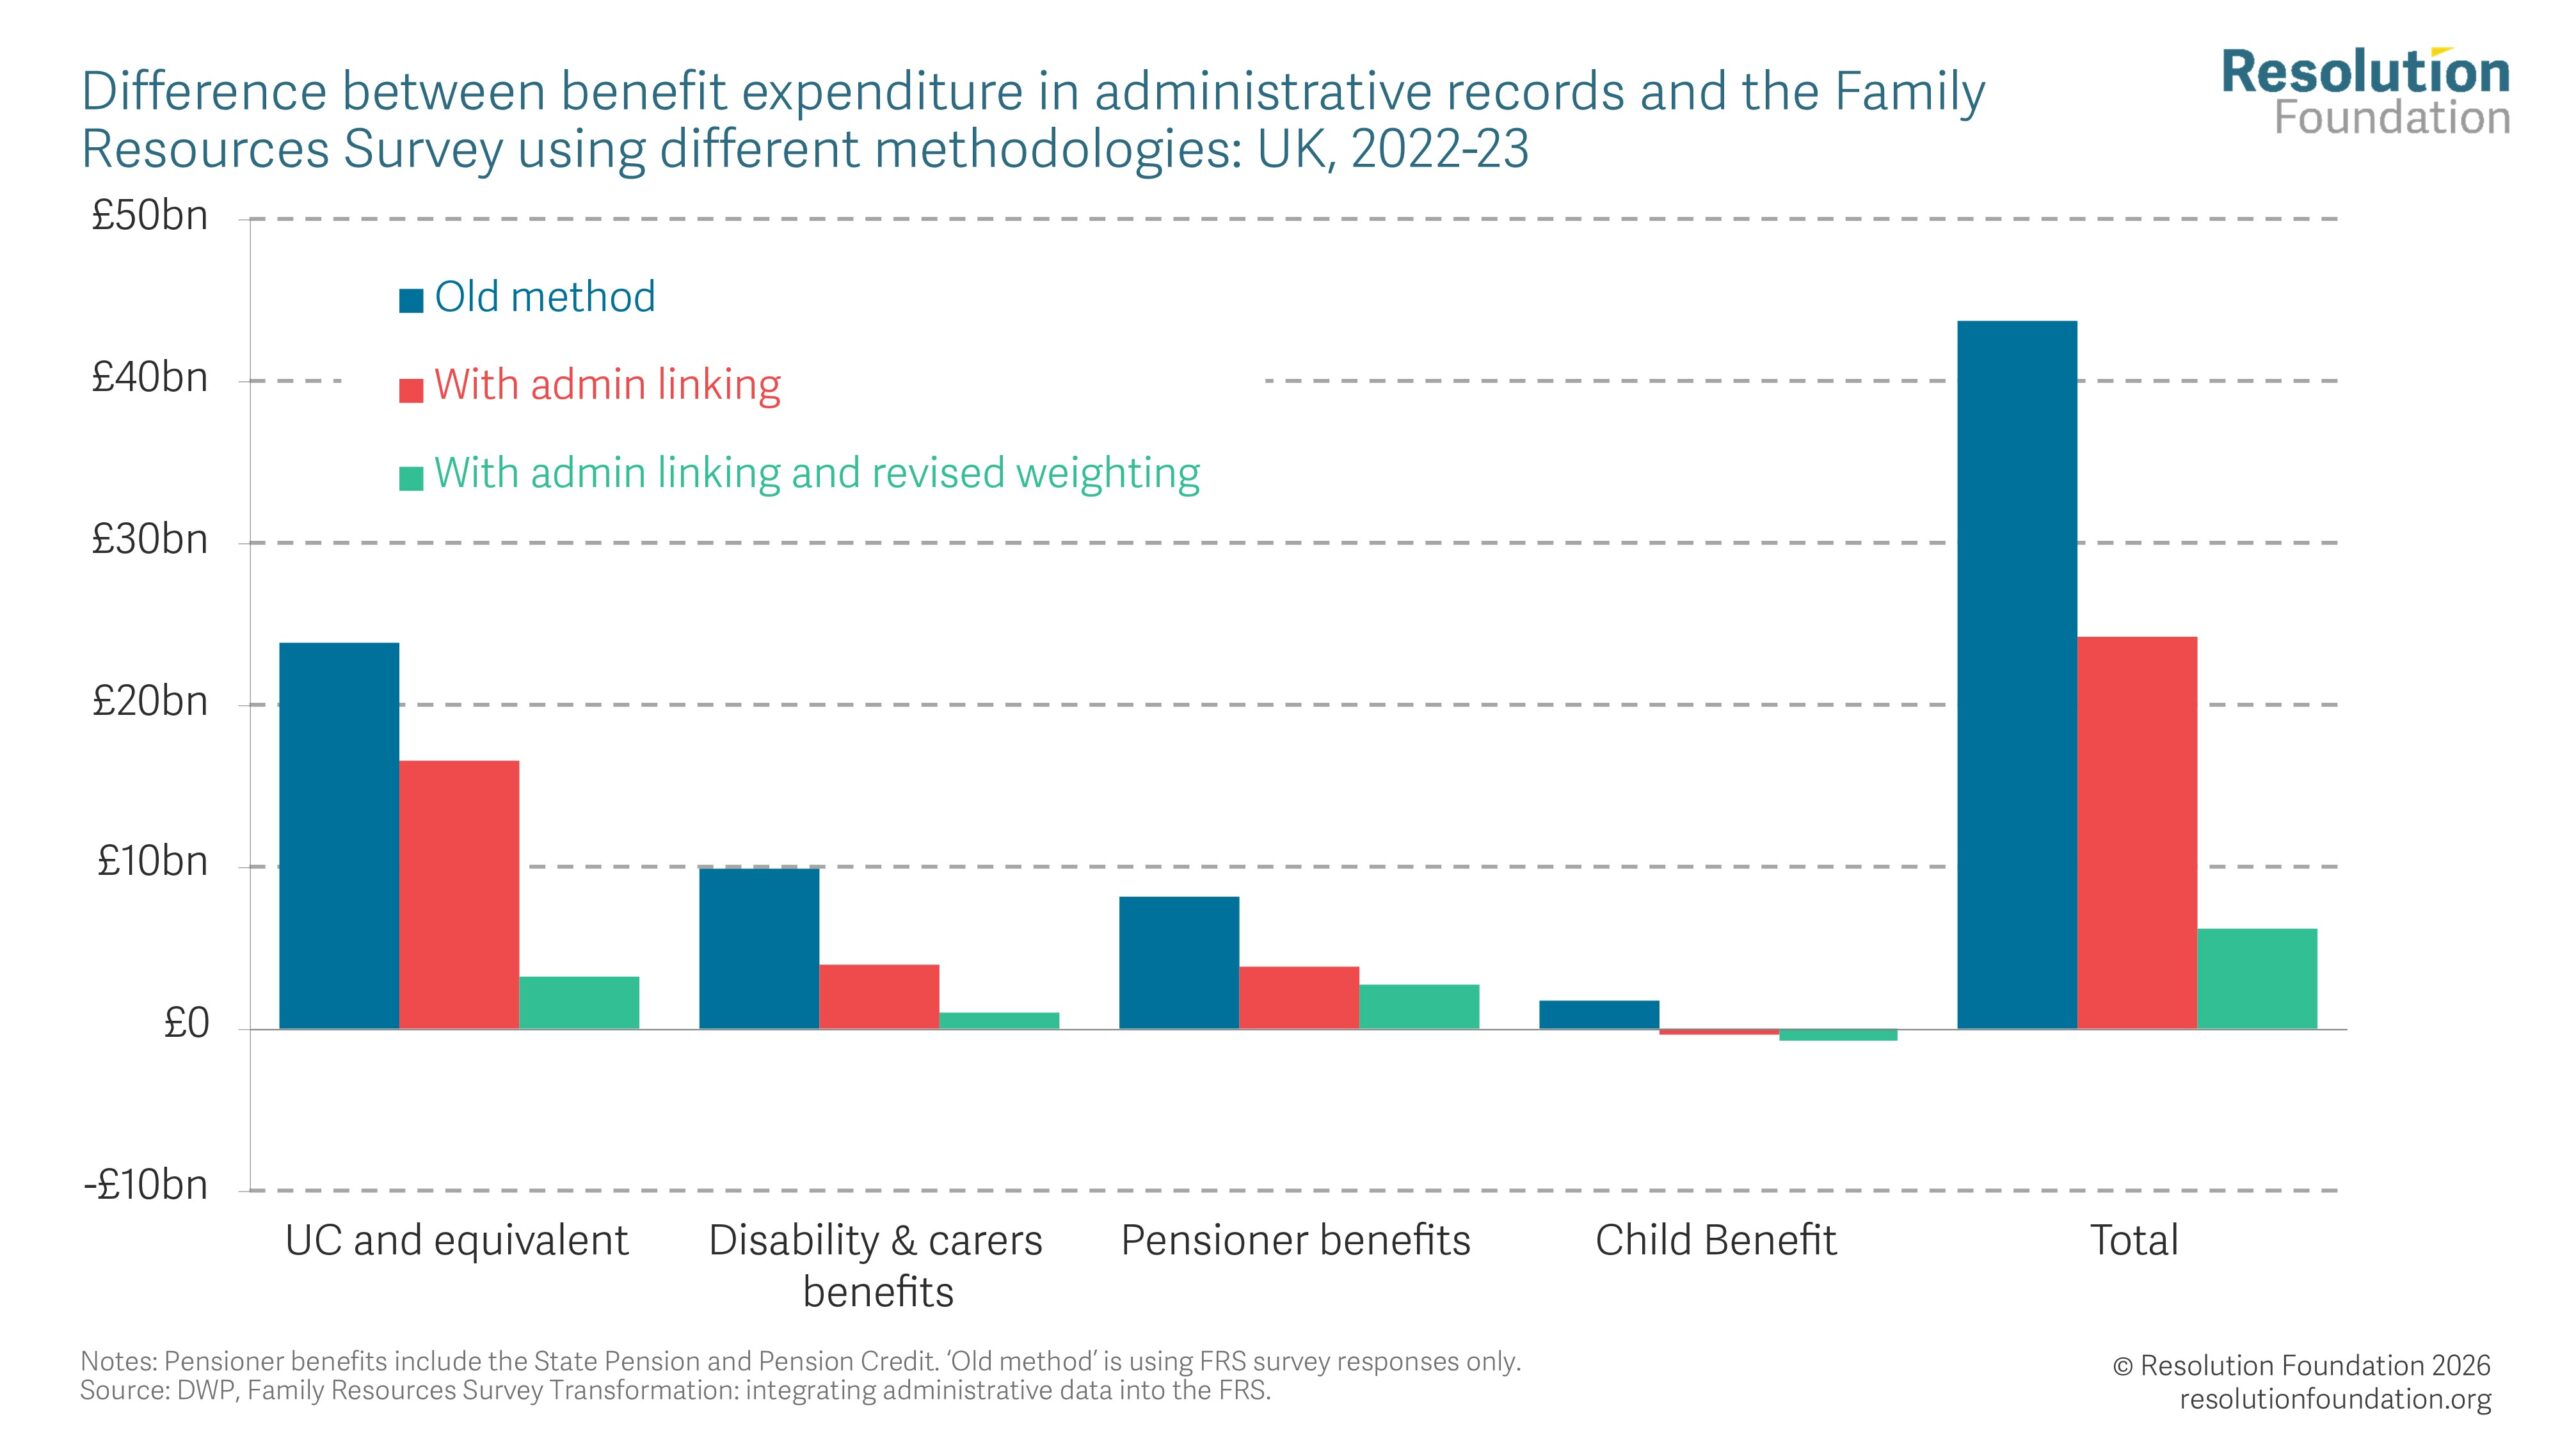
Futhermore, while the accuracy of reported incomes has been improved, further refinements due next year are likely to mean poverty rates could well be revised back up. As mentioned above, the second reason for missing benefits income in HBAI is an underrepresentation of benefit recipients in the FRS sample, driven by the fact that people who receive DWP benefits seem to be less likely than others to agree to take part in the survey. Before release, the FRS data undergoes a weighting process to make it more representative of the whole UK population, aiming to hit specific totals such as population by age group or region. However, DWP’s weighting approach for the FRS does not automatically leave us with the correct number of families in receipt of benefits. For example, even after correcting survey responses about benefit receipt using administrative records, the 2022-23 HBAI includes 3.8 million families receiving Universal Credit, 1.1 million fewer than the actual total in that year.
DWP is in the process of improving its weighting methodology to better align with benefit caseloads and updated population estimates from the 2021 Census. However, the incorporation of this into the official data has been postponed until next year, meaning the current release still uses the existing weighting approach. As Figure 4 shows, DWP analysis of HBAI data from 2022-23 has estimated that a further £18 billion of missing benefits expenditure would be captured once these weighting improvements are implemented, with £13 billion of this coming from Universal Credit or equivalent legacy benefits.ii Unlike this year’s data revision, the changes next year could act to increase estimated poverty rates because counting more benefit-receiving households will likely mean there are more households below the poverty line (and fewer better-off households). This is another reason why we should not be complacent about poverty in the UK after the downwards revision.
Figure 4: DWP analysis suggests there was around £44 billion of benefits income missing from the Family Resources Survey in 2022-23
The revisions to HBAI show the importance of the government spending time and money on measuring things as accurately as possible in official statistics, especially when they are driving high-profile policy decisions. The latest HBAI update is a significant improvement over the past method. However, only revising the data back to 2021-22 (and 2018-19 later this year) means we are now in the slightly awkward position of having a discontinuity in the series, and of knowing that past poverty figures were also likely overestimations but without knowing exactly by how much. And it should be kept in mind that work to ensure benefit incomes are accurately reflected in HBAI is not yet complete, and that this could move poverty estimates in the opposite direction next year.
What the data does make clear is that poverty remains high, and more accurate measurement does not lessen the urgency of addressing it. Tackling child poverty through measures such as repealing the two-child limit remains the right approach.
此内容由惯性聚合(RSS阅读器)自动聚合整理,仅供阅读参考。 原文来自 — 版权归原作者所有。