





Mary Jac Heuman
SonarQube is a tool for static code analysis that integrates with your existing CI pipelines to run quality checks on your codebase as it changes. As you develop and release new code, constant monitoring of code quality is crucial to ensure compliance, stability, and security. SonarQube’s Clean-As-You-Code philosophy helps to avoid technical debt by running regular code checks and alerting you to any problems early on.
Datadog’s SonarQube integration collects key metrics and logs that provide greater visibility into the quality and stability of your code during the development process, as well as the health and performance of your SonarQube server itself, whether it’s on-premise or in a containerized environment.
In this post, we’ll explore how Datadog helps you:
visualize and monitor key code metrics
collect and analyze SonarQube logs for insight into its status
alert on code-level security issues as part of your code checks
To get started right away, you can see our documentation for instructions on how to configure the Datadog Agent and enable log collection to point to your codebase and SonarQube instance.
SonarQube uses a scanner to run code checks as part of your CI pipeline. The scanner performs a static code analysis and calculates metrics that measure aspects of your code, such as duplications, maintainability, security, test coverage, and reliability. The scanner sends these metrics to a hosted instance of the SonarQube server. Once you’ve enabled the SonarQube integration, the Datadog Agent collects metrics from both the scanner’s exposed web endpoint that sends the code check results, as well as the JMX endpoint that emits health and performance data about the server itself. The integration auto-detects all the projects analyzed by the scanner, ensuring setup remains trivial even when your organization is maintaining thousands of projects.
You can use Datadog to create dashboards that visualize key SonarQube metrics to give you high-level insights into your code reviews. For example, you may want to see results of the most recent code check, including an up-to-date maintainability rating, along with quality metrics like sonarqube.maintainability.code_smells and sonarqube.complexity to illustrate your codebase’s change over time.
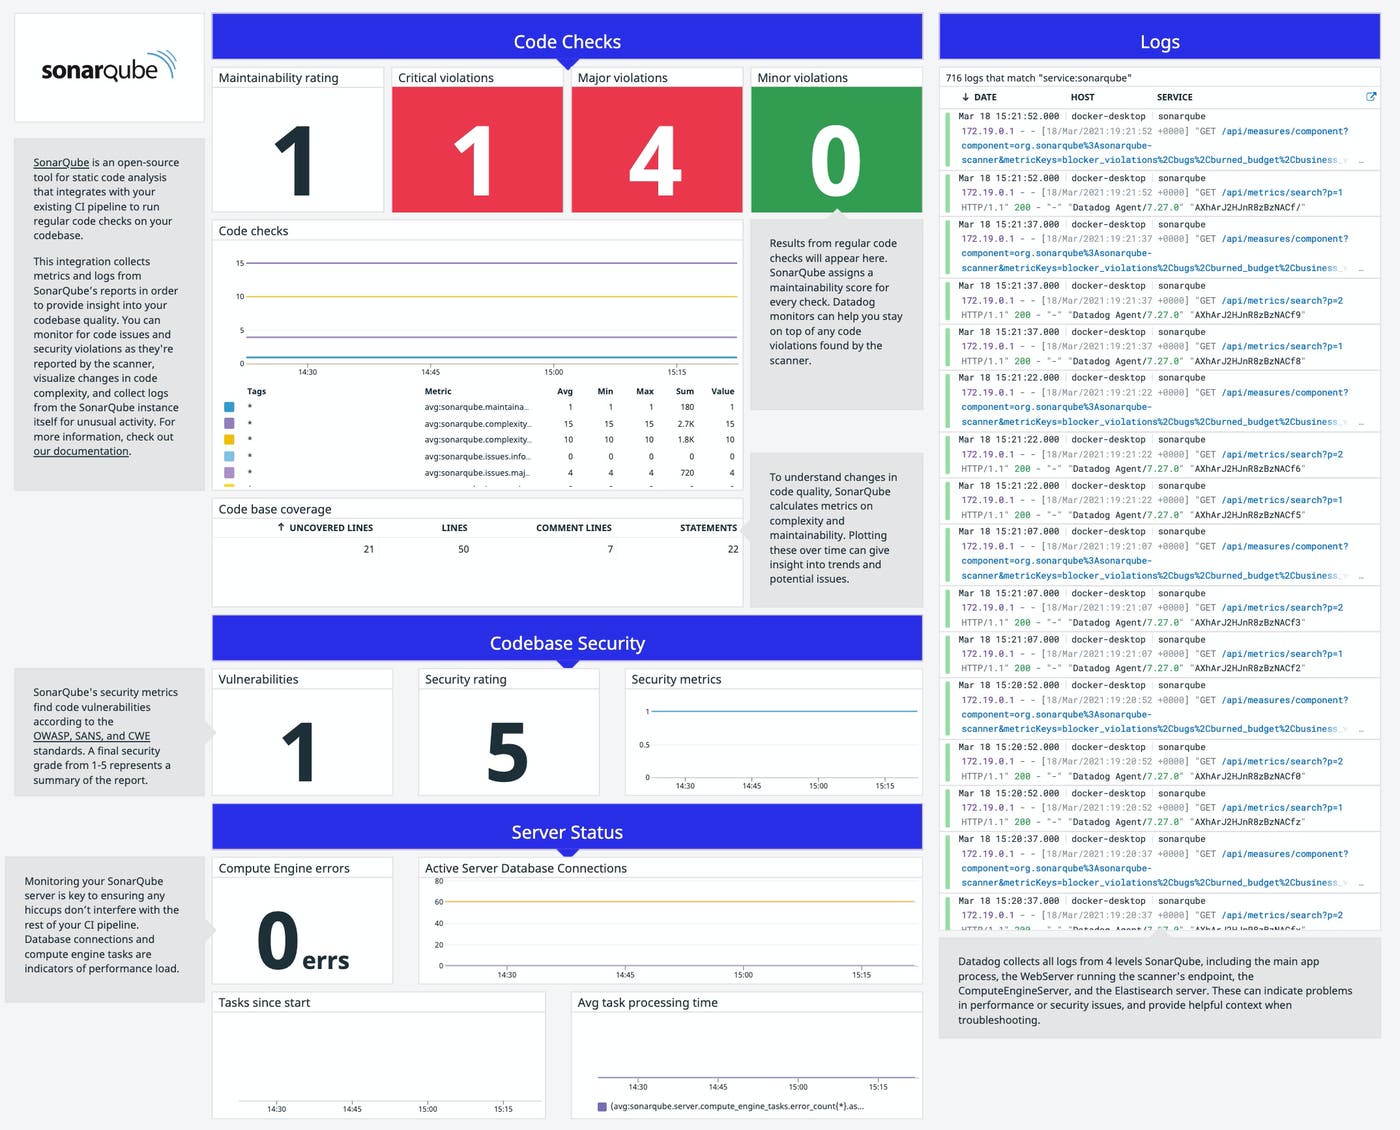
You can easily add widgets to track specific patterns of code activity over time and provide context around the most recent SonarQube scanner reports. And, with Datadog’s more than 1,000 other integrations, you can correlate SonarQube data with metrics from other parts of your CI pipeline like Jenkins or AWS services.
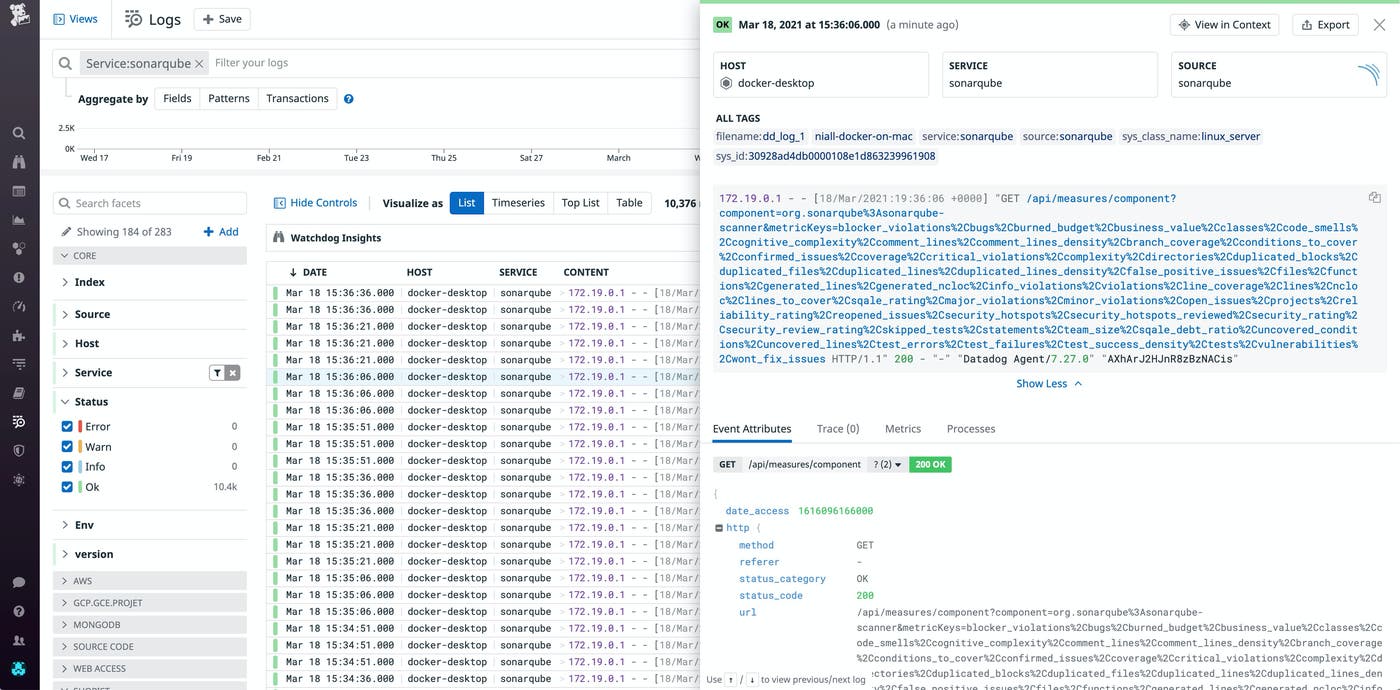
Datadog collects key SonarQube server metrics, including compute engine errors (sonarqube.server.compute_engine_tasks.error_count) and active database connections (sonarqube.server.database.pool_active_connections), that help administrators monitor the SonarQube instance’s activity and ensure it’s behaving as expected. Ingesting SonarQube logs with Datadog provides even more visibility into your server’s activity to troubleshoot issues. SonarQube produces logs for four separate processes:
the main SonarQube process (sonar.log.level.app)
the WebServer running the HTTP endpoint for the scanner (sonar.log.level.web)
the ComputeEngineServer calculating data about your code (sonar.log.level.ce)
the Elasticsearch SearchServer handling search requests (sonar.log.level.es)
Datadog’s log processing pipeline parses your SonarQube logs and extracts key metadata you can use to filter, sort, and search your logs. This makes it easy, for instance, to filter your logs for out-of-memory errors from a background task emitted by the main process, which would indicate you should reallocate more memory for SonarQube. When SonarQube reports an error, Datadog includes the full recorded stack trace to troubleshoot the issue.
SonarQube reports security-related metrics by scanning for vulnerabilities and hotspots against configurable rules based on security standards including OWASP, SANS, and CWE. For instance, the security.new_security_rating metric assigns a score from one to five (indicating an A–F letter grade) based on the results of the scanner’s latest report.
With Datadog, you can alert on these metrics to know right away if a code change exposes your application to security threats. For example, SonarQube will raise a CRITICAL violation when it finds a bug that represents an urgent security issue, such as vulnerability to a SQL injection. In this case, you would define an alert to trigger as soon as sonarqube.issues.new_critical_violations > 0, and send notifications to different members of your team or declare an incident.
## Start monitoring SonarQube today
With Datadog’s SonarQube integration, you can get high-level insights into your codebase’s quality and create alerts to notify on critical vulnerabilities. By visualizing and aggregating metrics and logs, you can monitor your code deployments alongside your entire CI/CD pipeline. Visit our documentation to start collecting data from SonarQube today. Or, if you’re new to to Datadog, start your free trial. today.
此内容由惯性聚合(RSS阅读器)自动聚合整理,仅供阅读参考。 原文来自 — 版权归原作者所有。