







Modern product teams ship features constantly. Every change—whether it’s a new onboarding flow, pricing tweak, or UI adjustment—raises the same question: Did this improve the product? AI has changed the stakes entirely: As release cycles accelerate and code generation scales across every team, the volume of changes has outpaced most teams’ ability to measure their true value.
In noisy, real-world environments, randomized experiments (A/B tests) are the only reliable way to know which changes affect a metric. The problem is that running those experiments is often slow and fragmented: Teams open tickets to define metrics, wait for dashboards to be built, and depend on data scientists to validate results. Until now, understanding whether a change improved the product meant stitching together a product analytics vendor, business intelligence tools, a standalone experimentation tool, and a monitoring platform, which creates fragmented workflows and blind spots between product changes and business impact.
Datadog Experiments helps product and engineering teams run trustworthy experiments directly within the Datadog platform. By combining behavioral analytics, application performance telemetry data, and warehouse-native business metrics in a single workflow, teams can design, launch, and analyze experiments without waiting on specialists, making experimentation something the whole organization can own.
In this post, we’ll look at how Datadog Experiments enables you to:
Accelerate learning and decisions without the overhead
Prevent costly experiment restarts with built-in guardrails
Catch performance regressions before they offset your wins
Measure warehouse-native business outcomes
Optimize AI and LLM apps with integrated testing in production
Running experiments should shorten the feedback loop between shipping a change and understanding its impact. However, many teams still rely on custom dashboards and manual analysis pipelines that slow this process down.
Datadog Experiments provides self-serve analysis tools that allow product and engineering teams to explore experiment results without waiting on specialized analytics workflows. Teams can define behavioral or business metrics directly in the platform and immediately analyze experiment performance as traffic flows to different variants. Datadog Experiments also integrates directly with Feature Flags, making it easy to control rollout and experiments from the same workflow. This enables teams to test new behaviors on subsets of users, compare outcomes, and gradually increase release exposure as confidence grows.
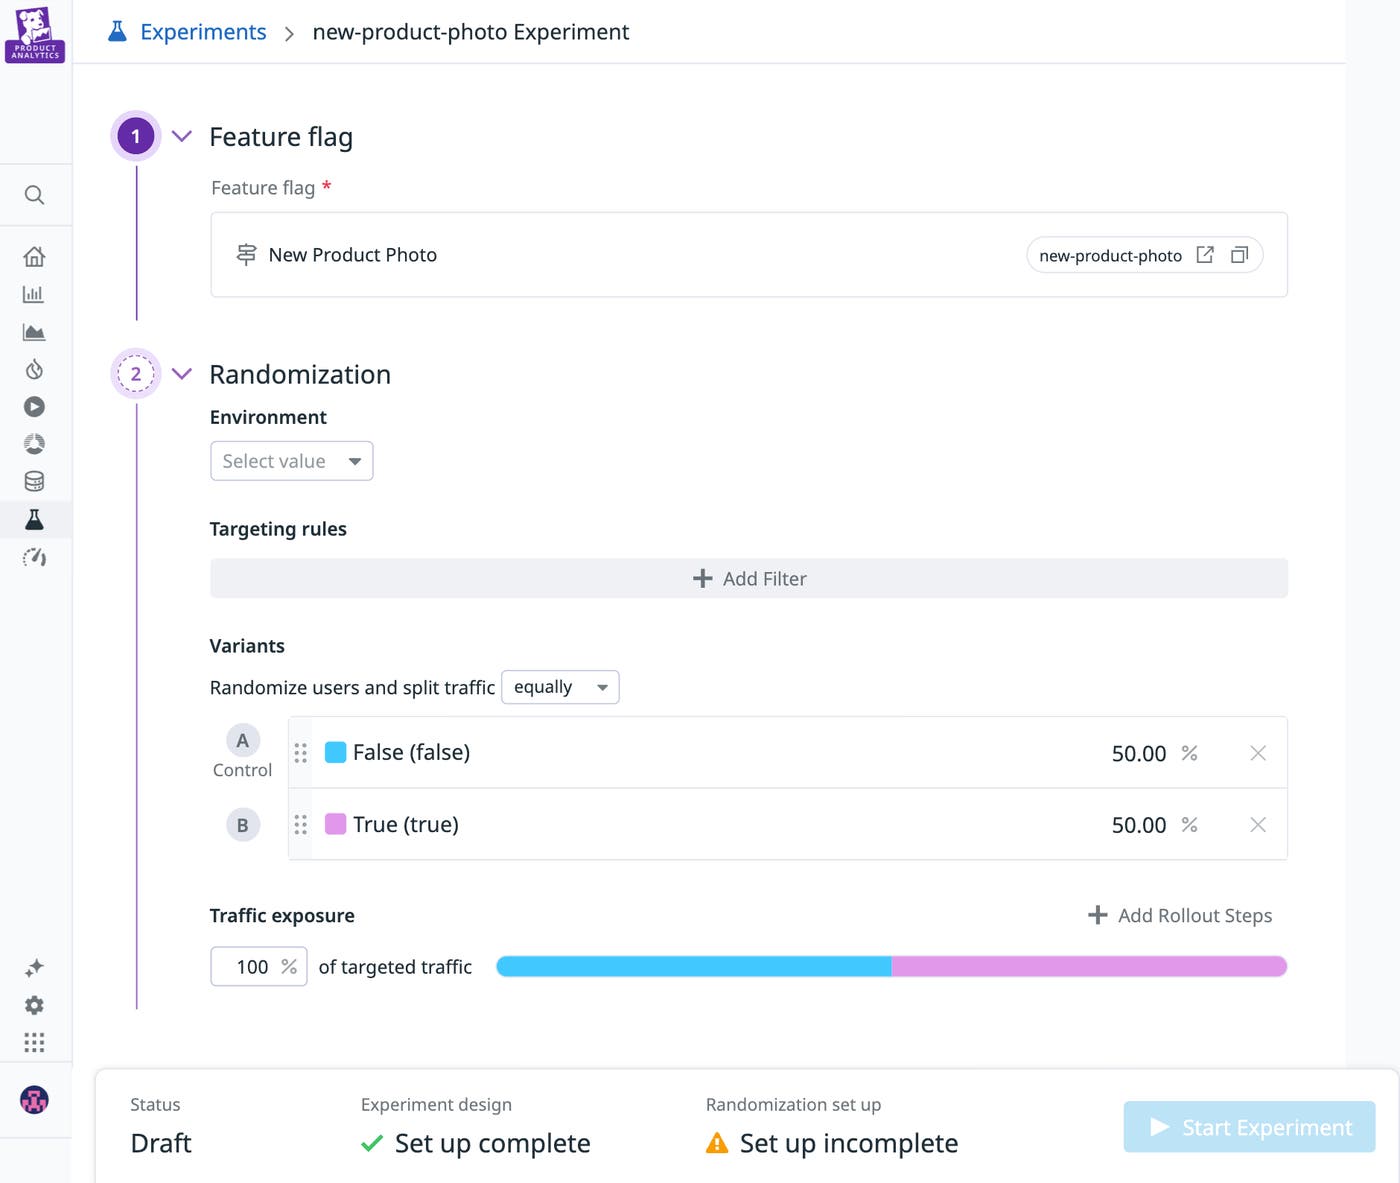
Because experiment results are available in real time, teams can monitor experiments as they run rather than waiting for post-hoc analysis. This visibility helps teams identify meaningful signals earlier in the experiment life cycle and move faster from observation to decision. The analysis interface also supports deeper exploration of results across multiple dimensions. Teams can investigate how changes affect different segments—such as device type, geographic region, or user persona—or analyze temporal trends to understand how experiment effects evolve over time.
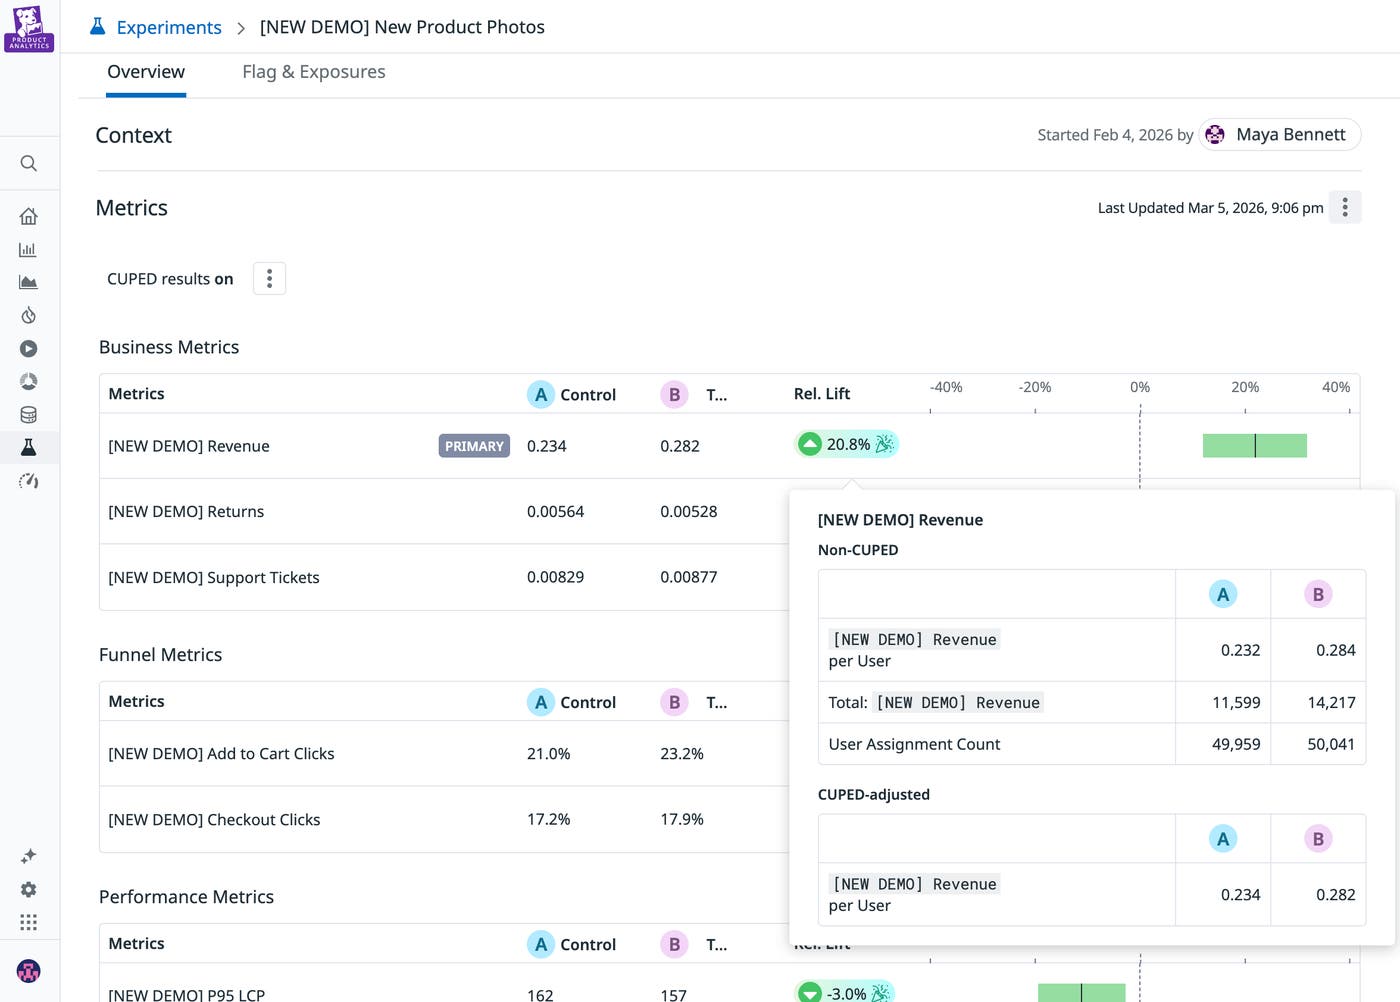
Behind the scenes, Datadog drives a statistical engine that supports a wide range of metric types, including counts, sums, averages, ratios, and percentiles. Advanced statistical techniques like variance reduction improve sensitivity, allowing teams to detect meaningful changes with smaller sample sizes.
It’s a more common failure than most teams want to admit—2 weeks of an experiment running cleanly, results come back neutral, and the postmortem finds the real answer: The modal wasn’t rendering in production. Users in the treatment group never saw the feature. By the time the data revealed the problem, it was too late.
With Datadog Experiments, you can open a Session Replay directly from the experiment and watch how real users interact with each variant within minutes of enrolling your first cohort. Rather than waiting for aggregate metrics to signal something is off, you can see it firsthand.
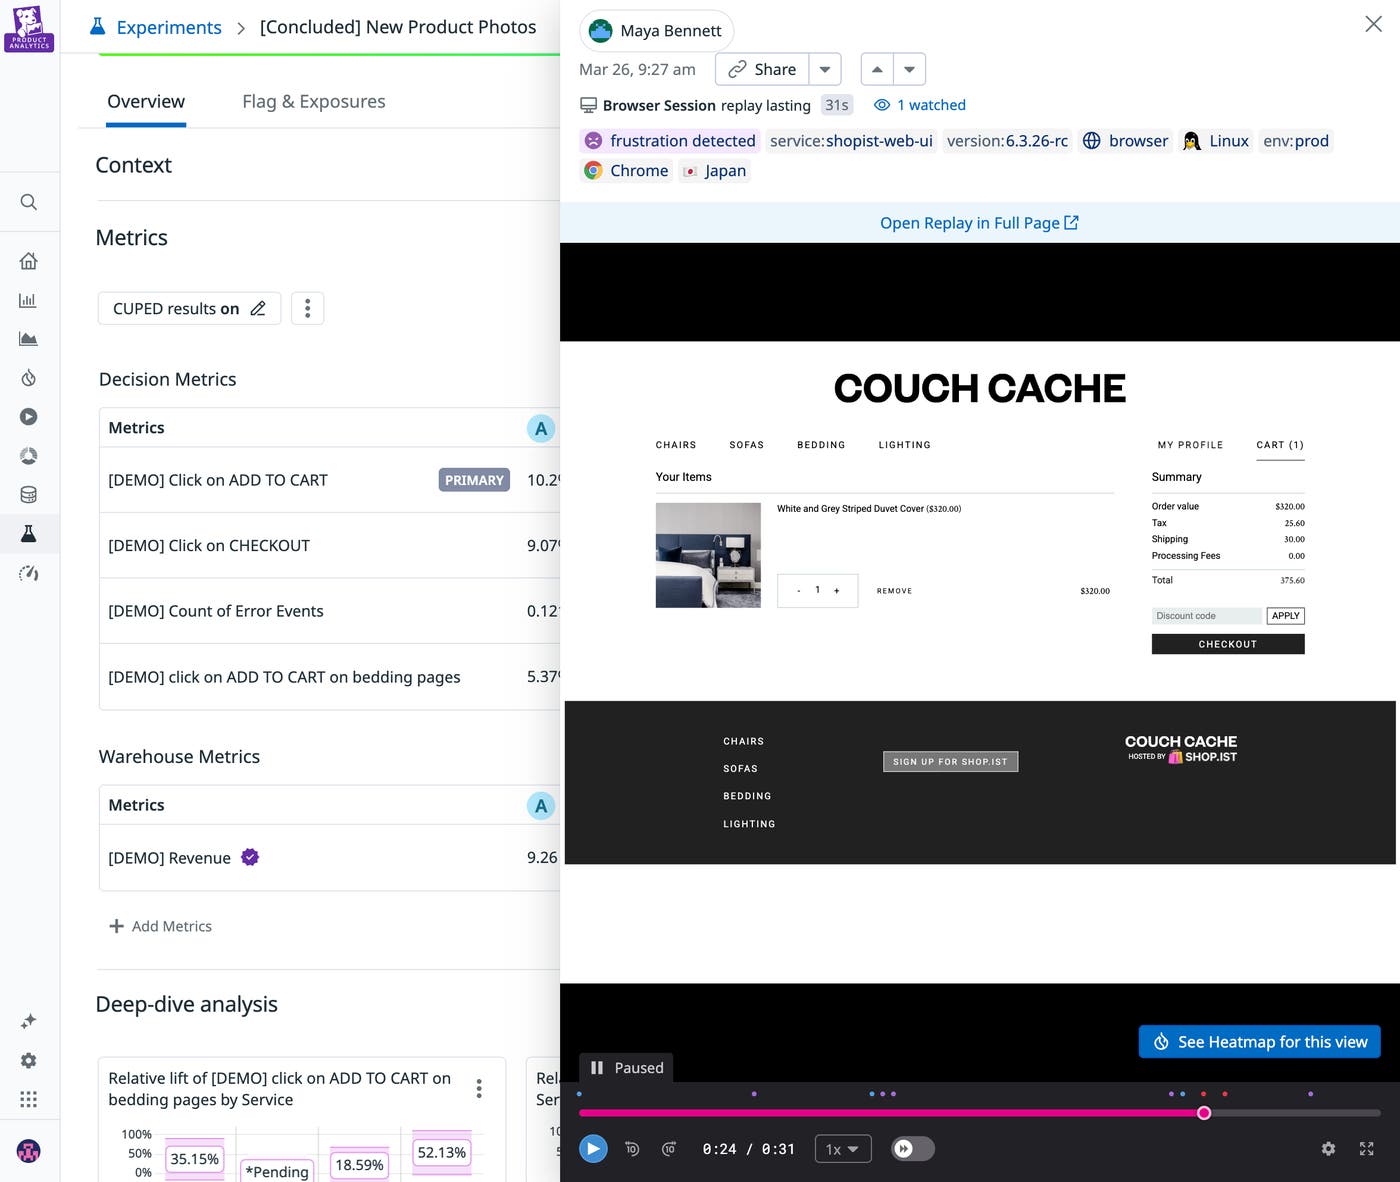
This qualitative layer sits alongside your quantitative results throughout the experiment life cycle, making it possible to catch setup issues in hours rather than the weeks it would take for bad data to surface in a scorecard.
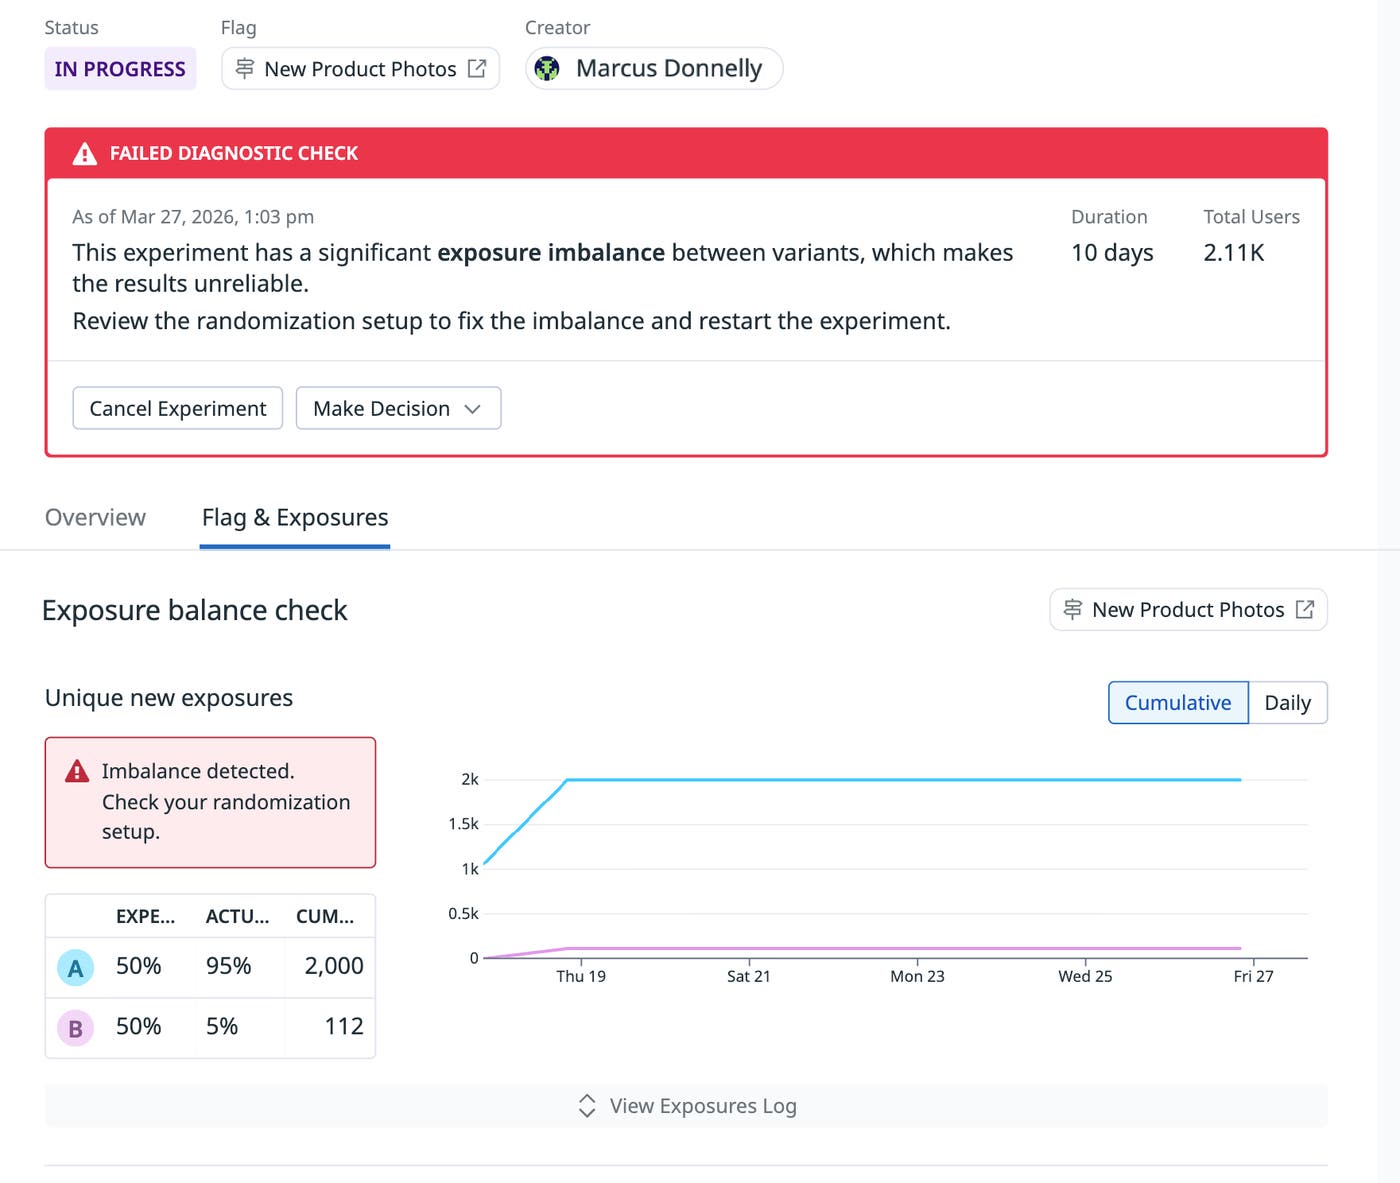
Beyond what users see, Datadog Experiments continuously monitors the integrity of the experiment itself. The platform automatically checks for sample ratio mismatches (SRM) and traffic imbalances that could compromise the validity of an experiment. These checks surface potential problems directly in the experiment interface so teams can correct them immediately. Instead of discovering issues weeks later during analysis, engineers and product managers can address them while the experiment is still running.
Standardized experiment design also improves consistency across teams. By using governed statistical methods and predefined experiment configurations, organizations can maintain trust in experiment outcomes and reduce the risk of inconsistent methodologies across teams.
Product experiments often focus on engagement or revenue metrics, but changes can also affect application performance. A new feature might increase conversions while simultaneously introducing latency, errors, or crashes that degrade the overall user experience.
With Datadog Experiments, performance telemetry is integrated directly into the experiment workflow. Teams can monitor metrics such as request latency, error rates, and application crashes alongside experiment results to understand the full impact of each variant.
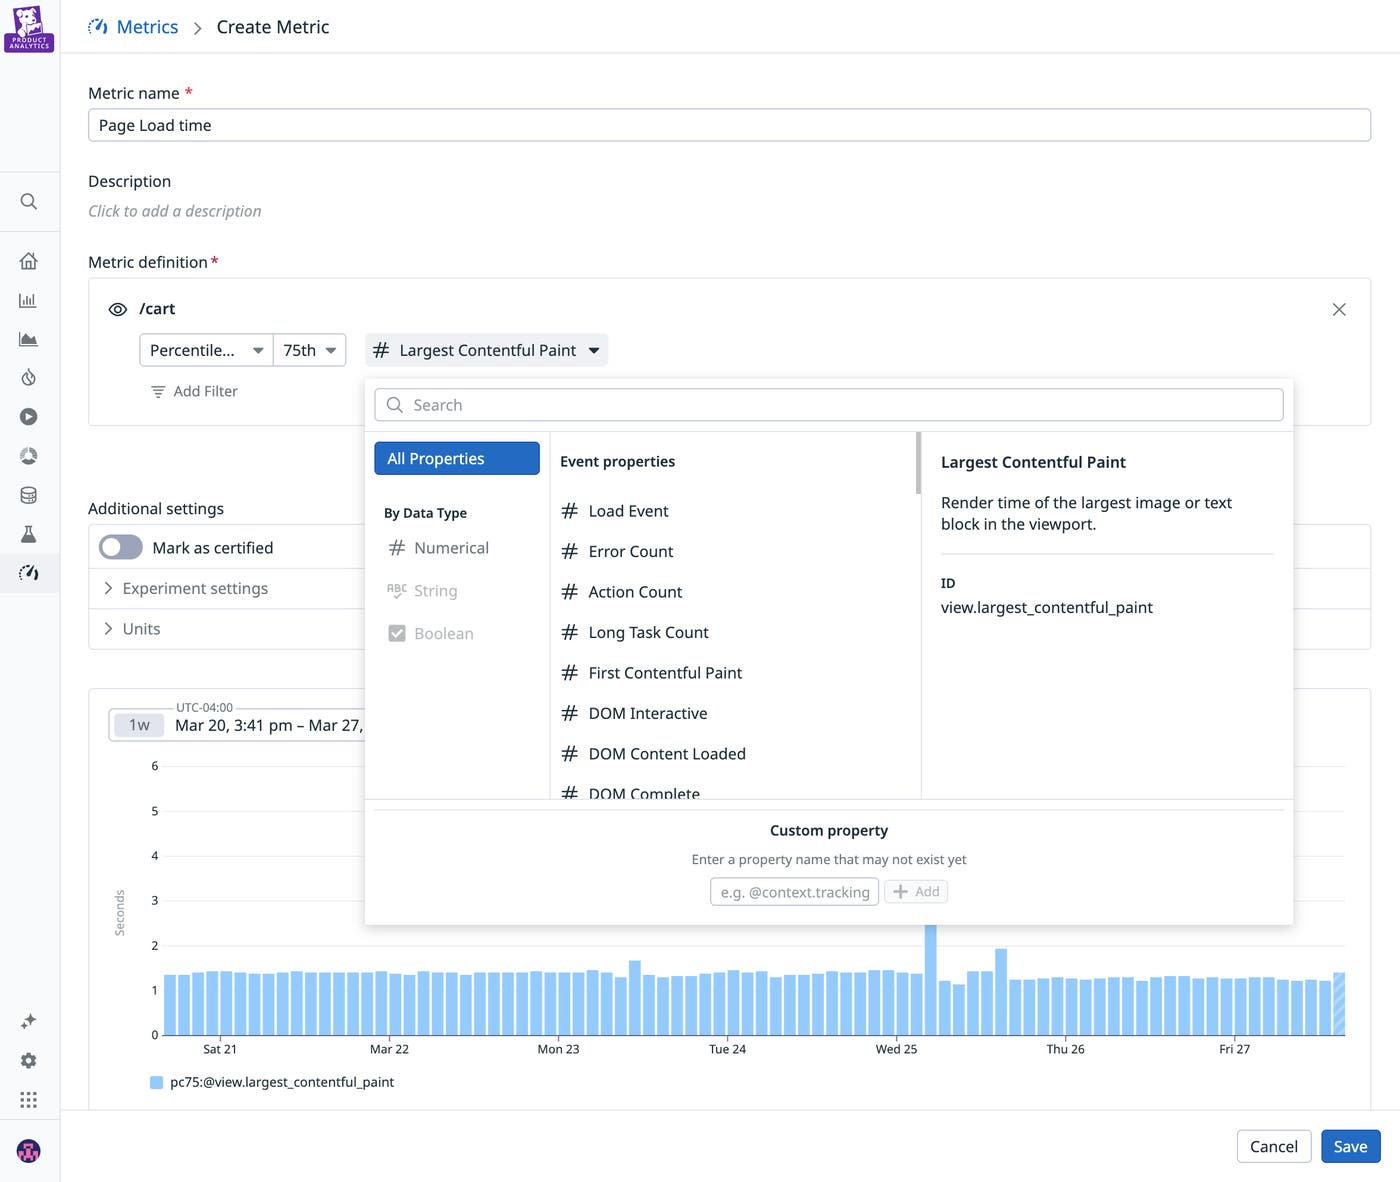
Because different signals emerge at different time scales, Datadog helps teams interpret results in terms of a signal latency spectrum. Immediate performance signals—such as latency or errors—act as an early pulse, while frustration signals like rage clicks surface within minutes as indicators of user pain. Longer-term business outcomes, such as retention or lifetime value, provide proof of sustained impact over time. Viewing these signals together allows teams to understand not only whether an experiment is working but also how its effects evolve from initial rollout through long-term adoption.
This unified visibility helps teams detect performance regressions early. For example, if a new checkout flow increases conversions but also raises API latency, engineers can quickly identify the issue and investigate it by using correlated traces, logs, and infrastructure metrics. Because experiments data and observability telemetry data exist in the same platform, teams can move from experiment analysis to root cause investigation without switching tools.
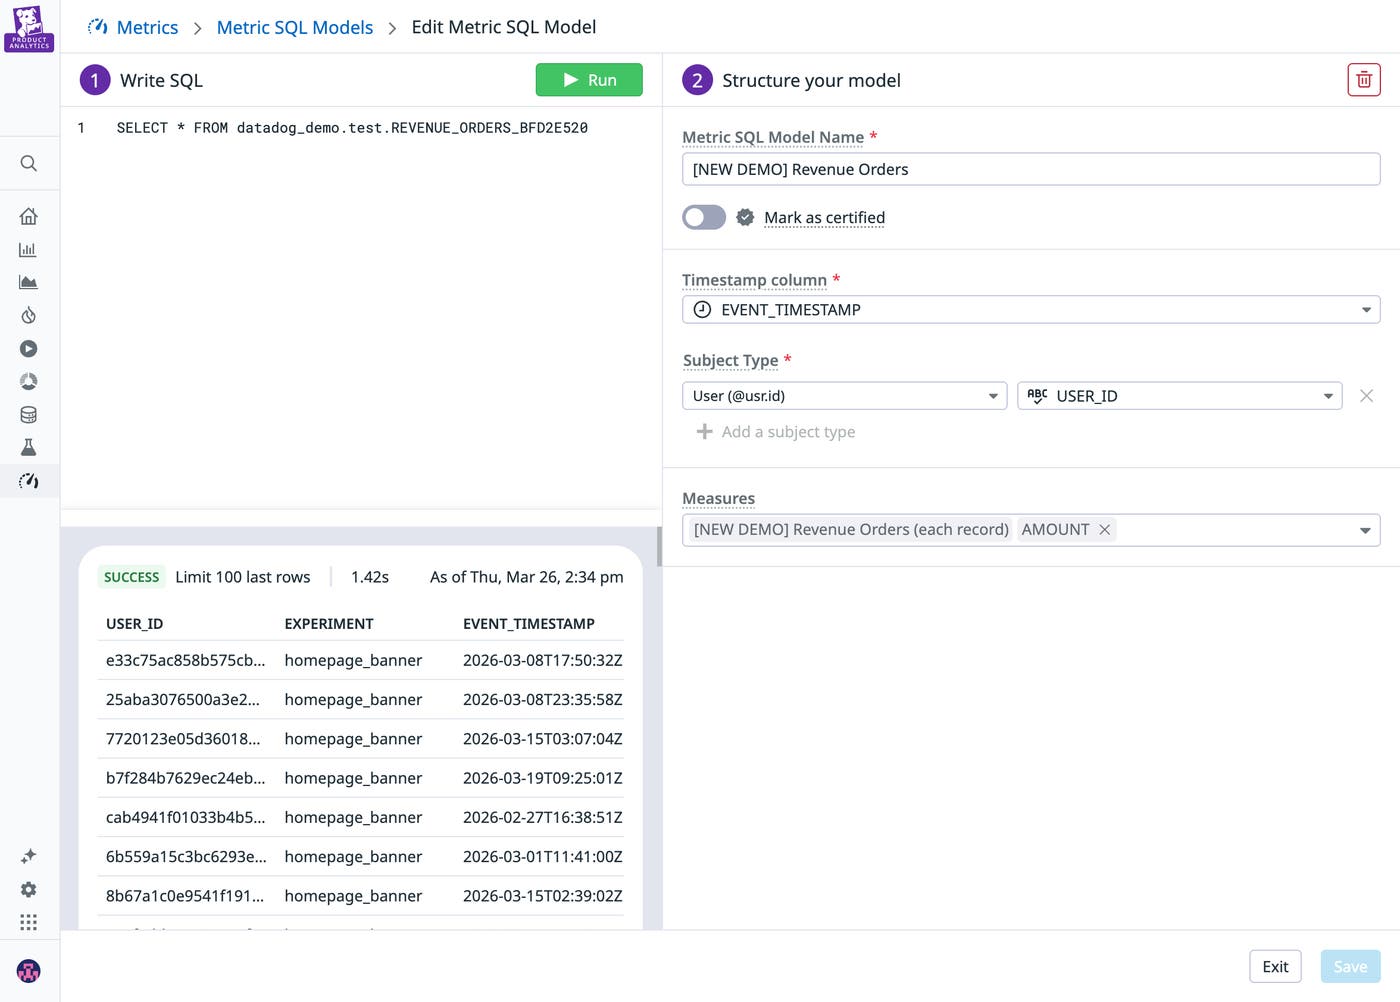
The metrics that matter most to your business and leadership, such as revenue, customer lifetime value, or subscription retention, live in your data warehouse. Most experimentation tools require copying this data into external analytics systems, introducing additional pipelines, governance challenges, and a black box approach to analysis. To support warehouse-native experiments, Datadog Experiments allows teams to analyze results directly against business metrics stored in their existing data warehouse platforms, such as Snowflake, BigQuery, Redshift, or Databricks.
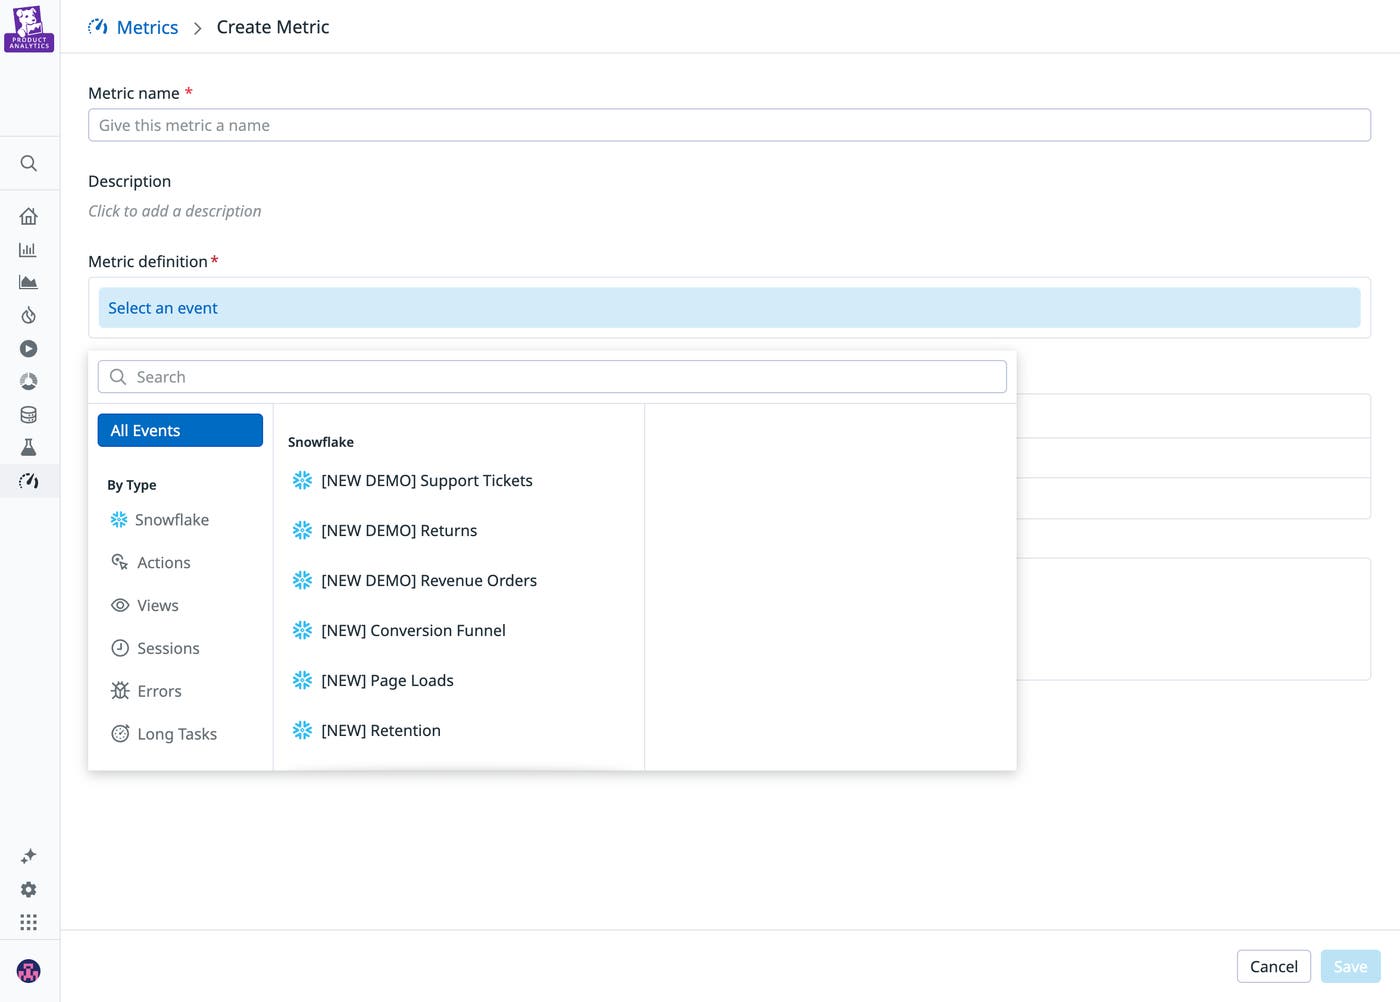
This approach preserves a single source of truth for business metrics. Teams can inspect the SQL definitions and statistical methods used to calculate experiment outcomes, helping ensure transparency and auditability. Because sensitive data remains in the organization’s cloud environment, this model also reduces the operational overhead of maintaining pipelines to external experimentation vendors while maintaining full visibility into how experiment results are calculated.
AI-powered applications are fundamentally harder to evaluate than other types of software. Outputs are non-deterministic, and small changes to prompts, model versions, or retrieval strategies can affect experience, latency, and cost. Teams need a safe, systemic way to evaluate these changes in production without risking regressions.
For example, consider a team improving a customer support agent. They might test two prompt variations to compare latency and token usage. Once they have singled out a new version of their prompt by doing offline evaluations, they can deploy it safely to a subset of users to A/B test and measure business impact with Experiments. By bringing offline evaluations and A/B testing into one platform, Datadog makes it easy to both safely vet ideas offline and understand real-world impact through randomized, controlled experiments. Offline evaluations let you quickly iterate on and validate the changes that are likely to improve the quality and performance of the AI agent, while A/B testing lets you measure the impact these changes have on business metrics such as user satisfaction, resolution rate, and revenue generated.
Experiments make it easier to learn from every product change. Datadog Experiments helps teams run reliable experiments faster by combining product analytics, performance telemetry, and warehouse-native business metrics in a unified workflow. With self-serve analysis, built-in guardrails, performance-aware experiments, and direct access to warehouse metrics, teams can evaluate the full impact of product changes and make decisions grounded in behavioral, performance, and business signals.
To learn more about Datadog Experiments, check out the documentation for running experiments with Datadog Product Analytics and our post on unifying experiment data in Datadog. If you’re new to Datadog, sign up for a 14-day free trial.
此内容由惯性聚合(RSS阅读器)自动聚合整理,仅供阅读参考。 原文来自 — 版权归原作者所有。