





John Sheehan
By John Sheehan, Co-founder and CEO of Runscope, which provides API performance monitoring and testing tools.
Like many companies today, we at Runscope rely on a microservices architecture with 60+ APIs and small services running through our infrastructure. As backend systems increasingly rely on APIs, monitoring those services to know not just when problems occur, but why, have become business imperatives that affect both your front-end applications and your internal operations.

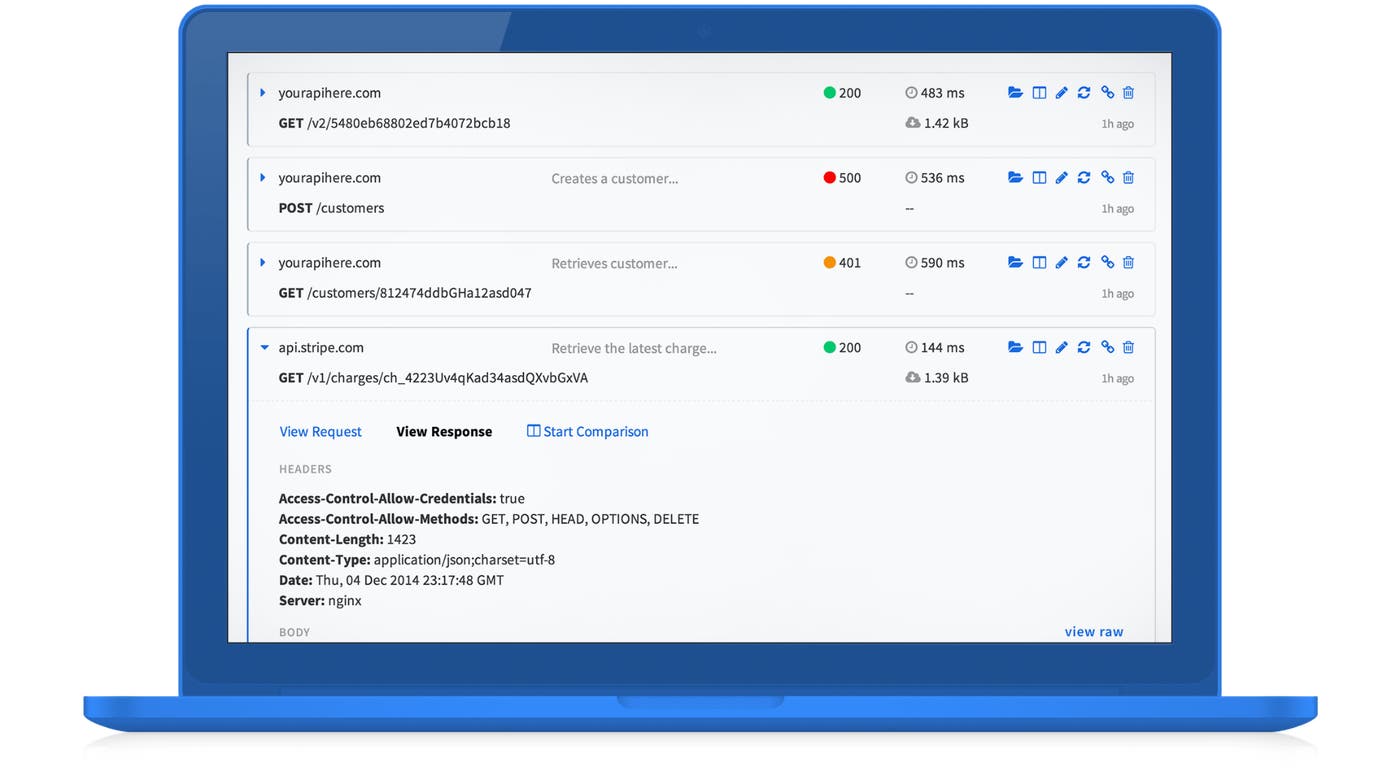
Now, you can get more targeted insights on API health and how it relates to your infrastructure with a turn-key integration with Runscope, a suite of API performance monitoring and testing tools. With Runscope, you can easily create tests, no code required, and monitor your APIs for uptime, performance and correctness.
With Runscope, you’re the first to know about any API-related issues before they impact your system. By integrating Runscope API monitoring with Datadog, it’s even easier to dig deep into API performance with the dashboards you’ve already built for your broader system. Runscope was built for teams, so whether you use APIs for front-end applications or devops, Datadog instantly records the data from your API tests. By measuring API performance against your IT infrastructure data, you can more quickly and precisely discover the cause of API issues that might be related to your infrastructure.

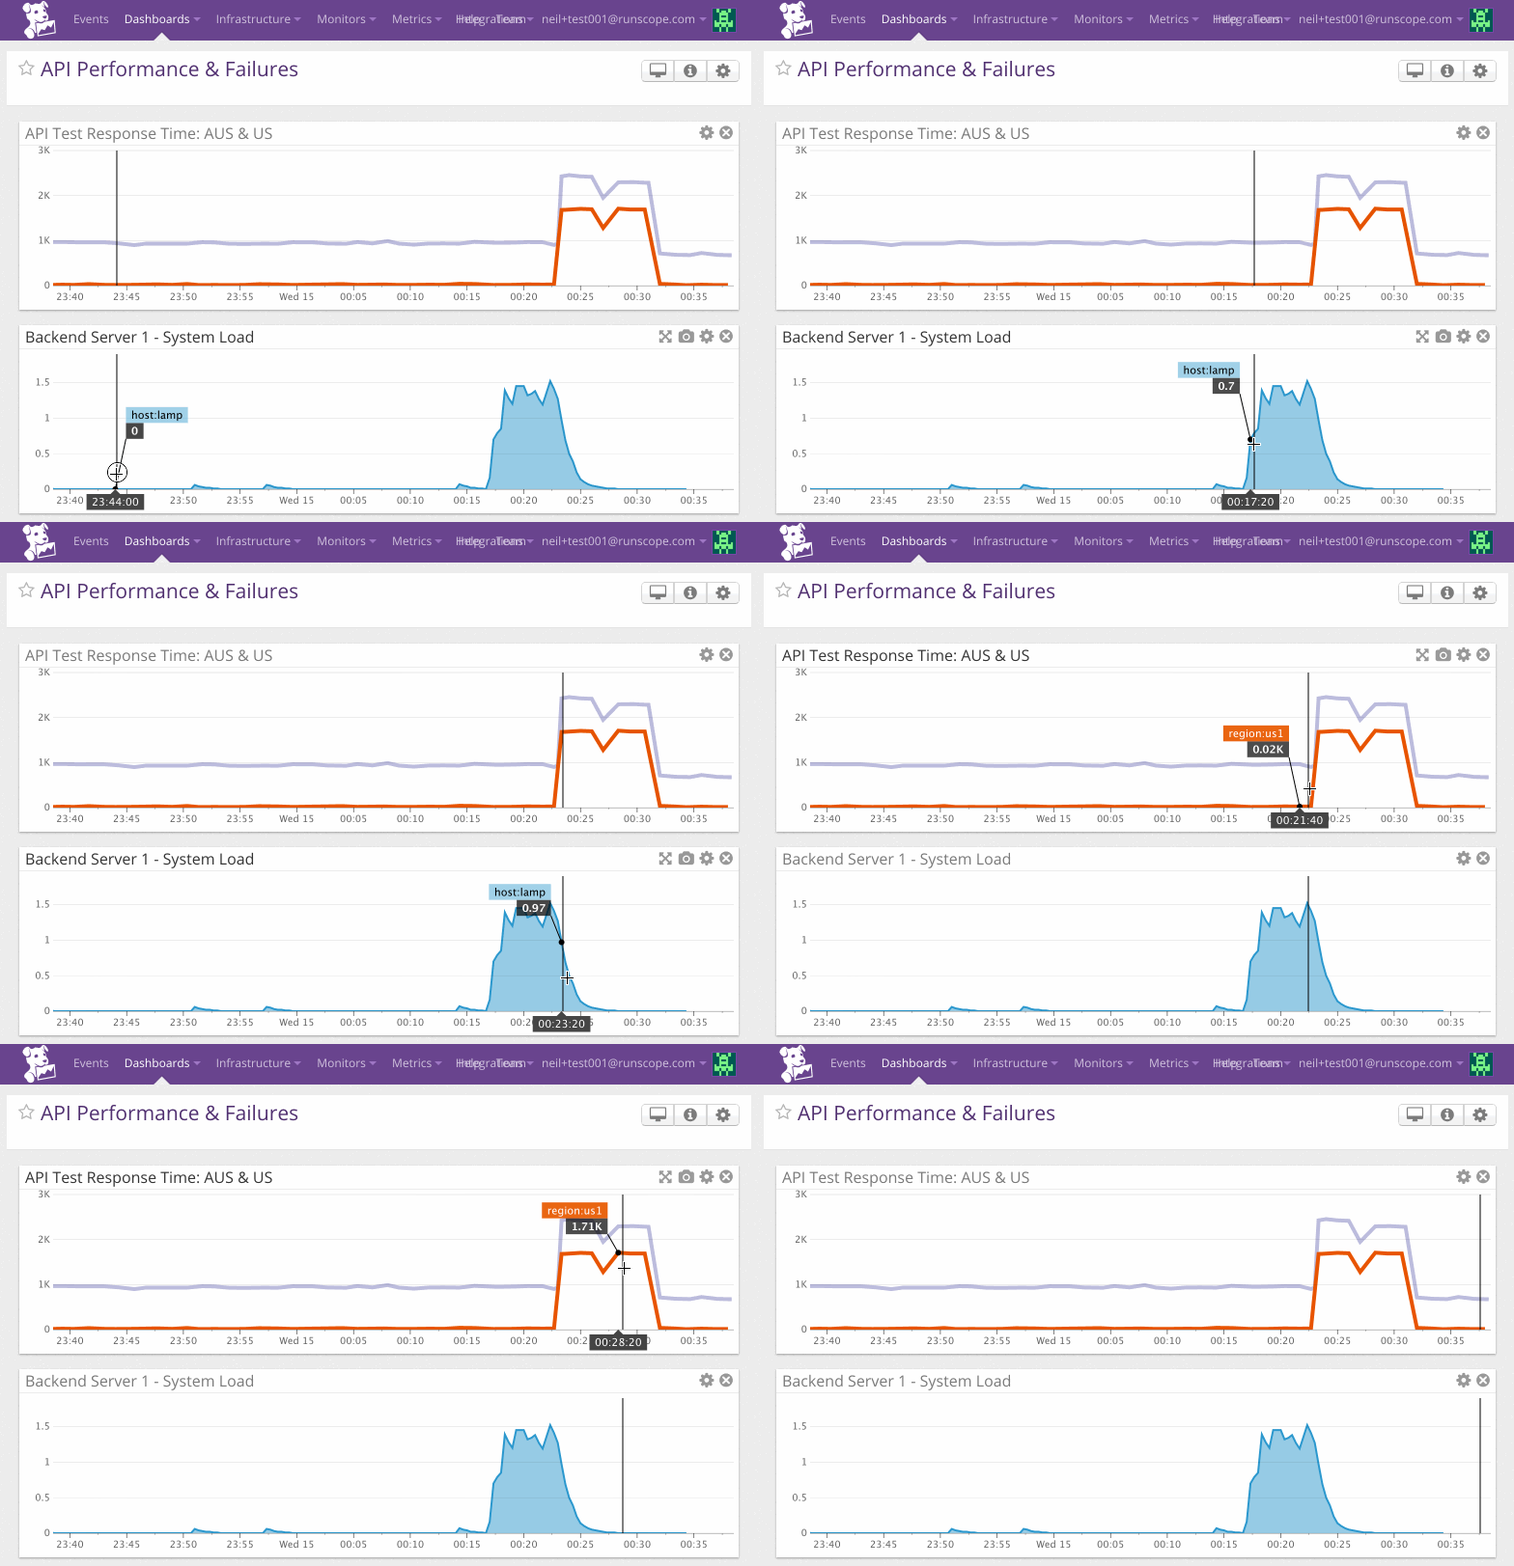
The screenshot above is an example of measuring API performance data from Runscope at the top and CPU load data from a backend server on the bottom. When API response time begins to spike after 00:20 (top), you can use your Datadog dashboard to easily correlate a spike in CPU usage that began several minutes before. After CPU load settles back to its normal near-idle state, the API response times will also begin to fall down.
Keen IO uses Runscope with Datadog to monitor the average duration of queries of various classes and move thresholds into its existing corpus of alerts. Cory Watson, Principal Infrastructure Engineer at Keen IO says, “The combination of Runscope API monitoring with Datadog infrastructure monitoring provides Keen IO with an easy way to integrate our mission-critical API data directly into the Datadog dashboards we already use, which gives us fine-grained control.”
Connecting Runscope tests to your Datadog account is easy. All you have to do is create an API key from your Datadog account and enter your key when you select the Datadog integration for your selected Runscope test in your Runscope instance. Check out the docs or read the blog post for a more detailed walk-through.
If you haven’t started to monitor API performance, sign up for Runscope for free today to see how you can add API monitoring into your existing Datadog dashboards and alerts.
此内容由惯性聚合(RSS阅读器)自动聚合整理,仅供阅读参考。 原文来自 — 版权归原作者所有。