



惯性聚合 高效追踪和阅读你感兴趣的博客、新闻、科技资讯
阅读原文 在惯性聚合中打开

推荐订阅源

WordPress大学
WordPress大学
Stack Overflow Blog
Stack Overflow Blog
人人都是产品经理
人人都是产品经理
Y
Y Combinator Blog
钛媒体:引领未来商业与生活新知
钛媒体:引领未来商业与生活新知
D
DataBreaches.Net
GbyAI
GbyAI
Microsoft Security Blog
博客园_首页
大猫的无限游戏
大猫的无限游戏
Jina AI
Jina AI
OSCHINA 社区最新新闻
OSCHINA 社区最新新闻
Engineering at Meta
Engineering at Meta
IT之家
IT之家
MongoDB | Blog
MongoDB | Blog
The GitHub Blog
The GitHub Blog
月光博客
月光博客
U
Unit 42
Hugging Face - Blog
Hugging Face - Blog
博客园 - 叶小钗
腾讯CDC
B
Blog RSS Feed
博客园 - Franky
爱范儿
爱范儿

Datadog | The Monitor blog

Introducing our open source AI-native SAST Instrument and monitor Boomi integration flows with OpenTelemetry and Datadog Not all index scans are equal: How we cut query latency by over 99% Platform engineering metrics: What to measure and what to ignore Integrate Recorded Future threat intelligence with Datadog Cloud SIEM CI/CD security: threat modeling using a MITRE-style threat matrix CI/CD security: How to secure your GitHub ecosystem Ingress NGINX is EOL: A practical guide for migrating to Kubernetes Gateway API Operating agentic AI with Amazon Bedrock AgentCore and Datadog LLM Observability: Lessons from NTT DATA Introducing the Datadog Code Security MCP Capture and analyze custom heatmaps in Session Replay Understand session replays faster with AI summaries and smart chapters Monitor ClickHouse query performance with Datadog Database Monitoring How we designed empathetic alert sounds for on-call engineers Search and act across Datadog to resolve issues faster with Bits Assistant Measure the business impact of every product change with Datadog Experiments Analyzing round trip query latency Configuring JavaScript caches for better performance Introducing Bits AI Dev Agent for Code Security Datadog achieves ISO 42001 certification for responsible AI Monitor Nutanix clusters, hosts, and VMs with Datadog Monitor Juniper Mist in Datadog A new Host Map for modern infrastructure Annotate traces to improve LLM quality with Datadog LLM Observability What’s new in Cloud SIEM: AI-powered investigations, enhanced threat intelligence, and scalable security operations Explore Kubernetes with native OpenTelemetry data Monitor Oracle Fusion Cloud Applications with Datadog Announcing the Datadog Terraform provider v4.0.0 Scaling Kubernetes workloads on custom metrics How to design cloud environments for AI-powered threat analysis
Resolve performance issues faster with Flowdock and Datadog
Abril Loya McCloud · 2016-05-09 · via Datadog | The Monitor blog

Communication within and across technical teams is key to maintaining infrastructure health, but it can suffer in the face of performance issue emergencies if your team doesn’t have the proper tools. Enter Flowdock, which when integrated with Datadog, allows you to automatically receive alerts, integration statuses, and more directly into your flows so your team can begin problem solving quickly.

Discuss what’s happening as it’s happening

Once you start using this integration you won’t need to check your email for every update from your team or alert from Datadog—you can see the alert notifications populate directly into Flowdock as they are triggered.

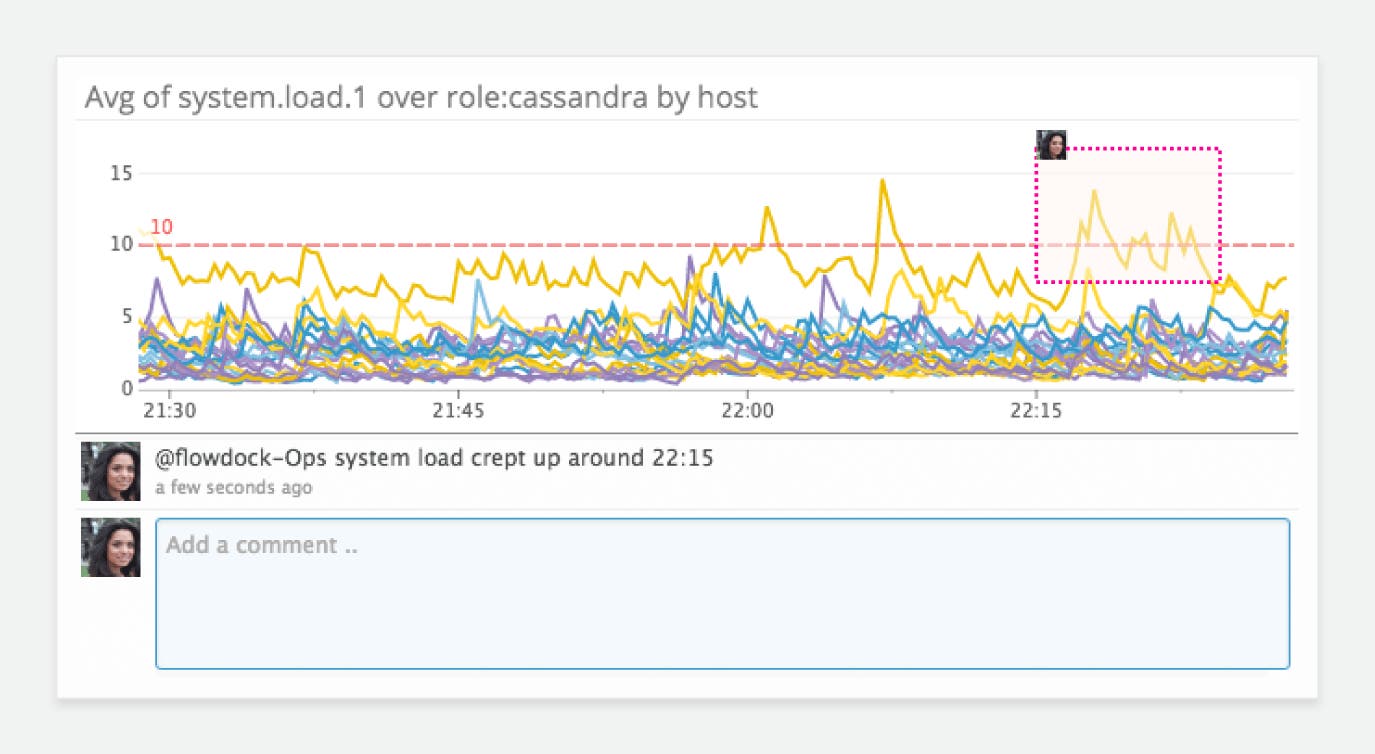
Related alerts from Datadog are compiled into their own Flowdock thread within your main flow so that your main flow remains uncluttered and conducive to discussion. You can also manually post into your flows from within the Datadog app by tagging @flowdock-mention to point out any service anomalies you may find during your investigation.
performance issues

Flowdock + Datadog

The volley of emails back and forth can often impact ops teams’ ability to get to the bottom of service failures quickly. With many people and many emails, it was difficult to keep track of where the conversation was going. This is where Flowdock shines: its superior processing and its ability to keep related conversations within the same “thread” so you don’t lose time looking for previous comments.

Flowdock also allows you to take advantage of Datadog’s automatic outlier detection. With these outlier alerts automatically appearing within the same flow as the conversation, teams are able to pinpoint issues efficiently in a single thread while keeping alerting noise to a minimum.

Get Started

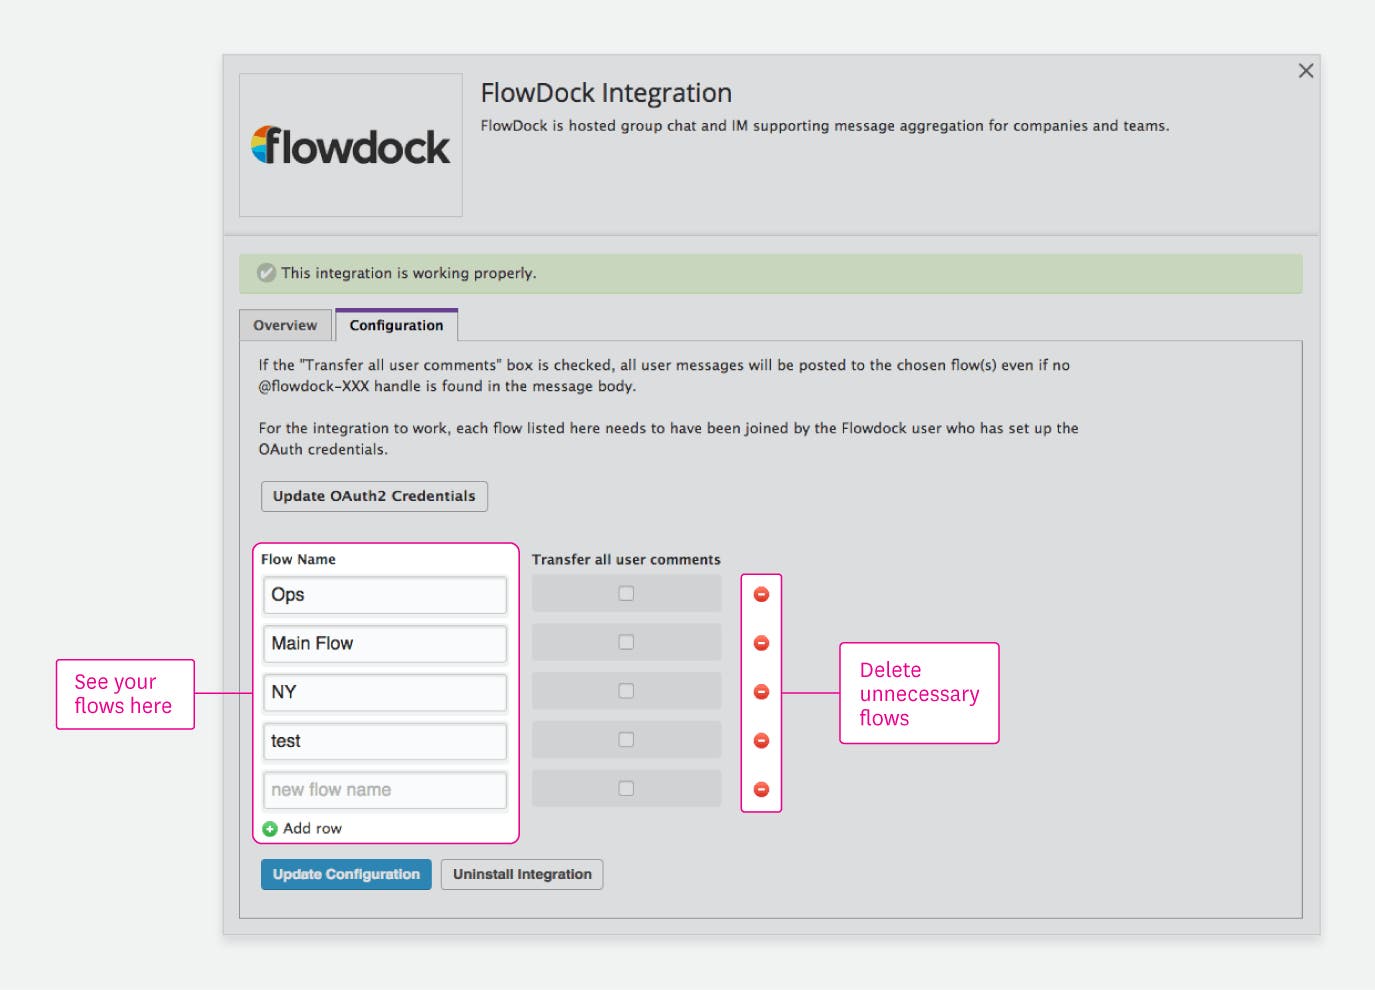
Setting up the Flowdock integration takes just a few minutes. All you need to do is go to the Flowdock tile in your integrations tab within the Datadog app and click on ‘Configuration.’
performance issues

Then, enter your Flowdock credentials and your opened flows will be fetched automatically. You can delete any flows you do not want to be able to post into or from Datadog by clicking the red minus button on the right of the flow name.

If you’re already a Datadog customer, you can go here to set up the Flowdock integration today. Otherwise, you can start a Datadog trial and centralize your communication about performance and infrastructure immediately.