








To complement distributed tracing, runtime metrics, log analytics, Synthetic Monitoring, and Real User Monitoring, we’ve made another addition to the application developer’s toolkit to make troubleshooting performance issues even faster and simpler. Continuous Profiler is an always-on, production code profiler that enables you to analyze code-level performance across your entire environment, with minimal overhead. Profiles reveal which functions (or lines of code) consume the most resources, such as CPU and memory. By optimizing these, you can reduce both your end-user latency and cloud provider bill.
In Datadog, you can:
Visualize all your stack traces in one place
Discover bottlenecks in your code at a glance
Zero in on profiles using tags
Correlate profiles and distributed traces seamlessly
Get actionable insights for performance improvements
Track long-term performance trends
Continuous Profiler allows you to observe how your programs execute in production, so you can effectively diagnose and troubleshoot performance issues that occur under real-world conditions, such as OutOfMemoryError exceptions in Java and lock contention. At the same time, it could potentially surface lines of code that you were not even aware were adding unnecessary overhead to your application.
Continuous Profiler collects representative samples of all your stack traces—regardless of whether they come from your code or third-party libraries—and visualizes them as a flame graph. Each bar represents a function and is arranged vertically, from top to bottom, in the order in which it is called during a program’s execution. In the Java profile shown above, the width of each frame corresponds to its resource consumption, while its color identifies its package.
Inspecting these stack traces can help you understand the different ways your functions are called—and which ones are consuming the most resources. As your application scales, optimizing these resource-intensive sections of code can significantly reduce end-user latency and infrastructure costs. Depending on the language your program is written in, you can explore a variety of profile types, including CPU, memory allocation, lock, and I/O.
Production workloads are complex and it’s not always easy to locate bottlenecks. Datadog aggregates your profiles to help you understand your overall resource consumption and find any hotspots in your code, so you can prioritize the optimizations that will result in the largest performance improvement. If you’re investigating CPU utilization (as shown above), you can use the summary table in the right panel to view a list of packages, methods, and threads sorted in descending order of CPU time or the number of samples collected. You can then easily filter the flame graph to show only the relevant call stacks and identify ways to optimize those sections of your code.
Profile aggregation is currently in Preview, and you can request access here.
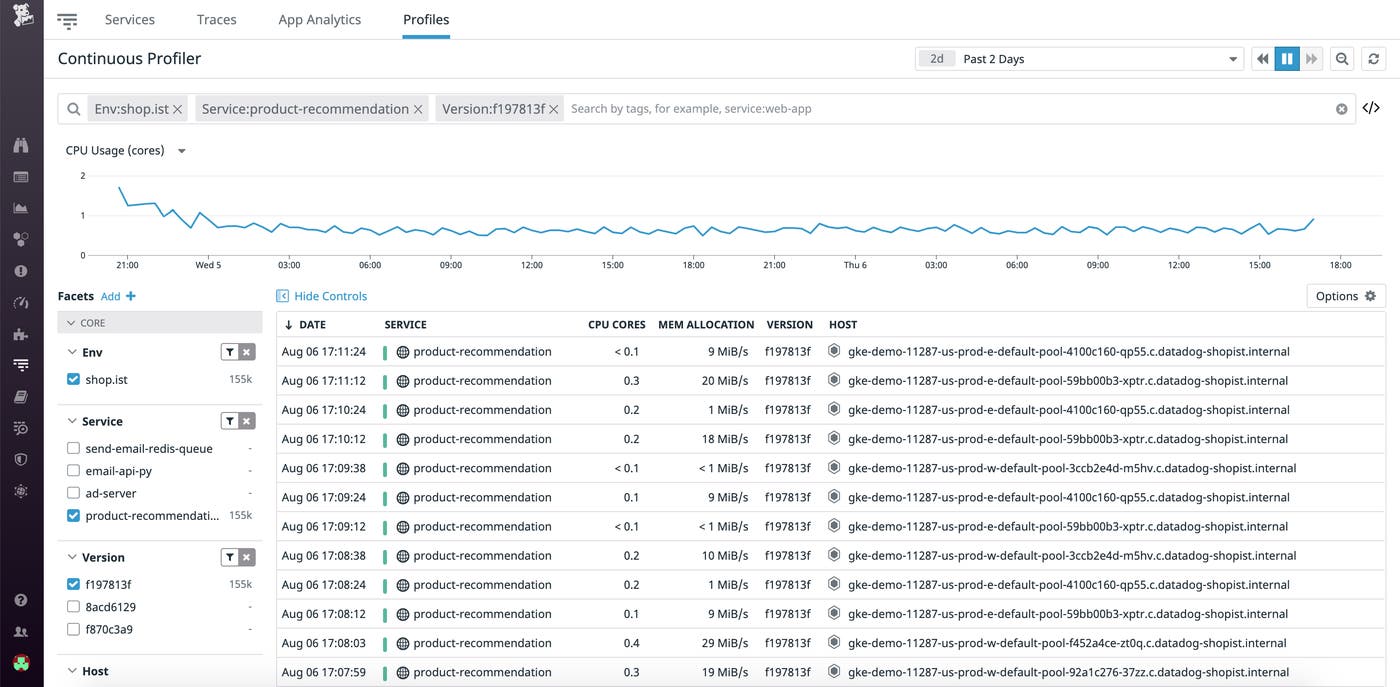
Since Continuous Profiler is built to be always on, developers can effectively debug issues during time-sensitive situations, such as outages, by pulling up profiles captured before and during any downtimes. The Profile Search view displays all your profiles in one place and allows you to use tags to quickly slice and dice your profiles across any dimension—whether it’s a specific host, service, version, or a combination thereof. You can also use the controls in the sidebar to drill down to profiles with the highest CPU or memory consumption. Clicking on any profile then takes you straight to the flame graph of stack traces for a more detailed view.
When developing Continuous Profiler, we wanted to ensure that it was tightly integrated with the rest of the Datadog platform. Distributed tracing and APM allows you to track the path of individual requests across all your services, and identify which step is creating a bottleneck or causing an error. When investigating a particularly slow request in APM, you can pivot with a single click to the related profile to identify this specific request’s resource bottlenecks. Similarly, within a profile, you can identify the most resource-intensive requests and inspect them in APM to understand how they fit into the bigger picture (e.g., what other services were called in this request?)—and how they impact your business (e.g., which customers are using the most resources?).
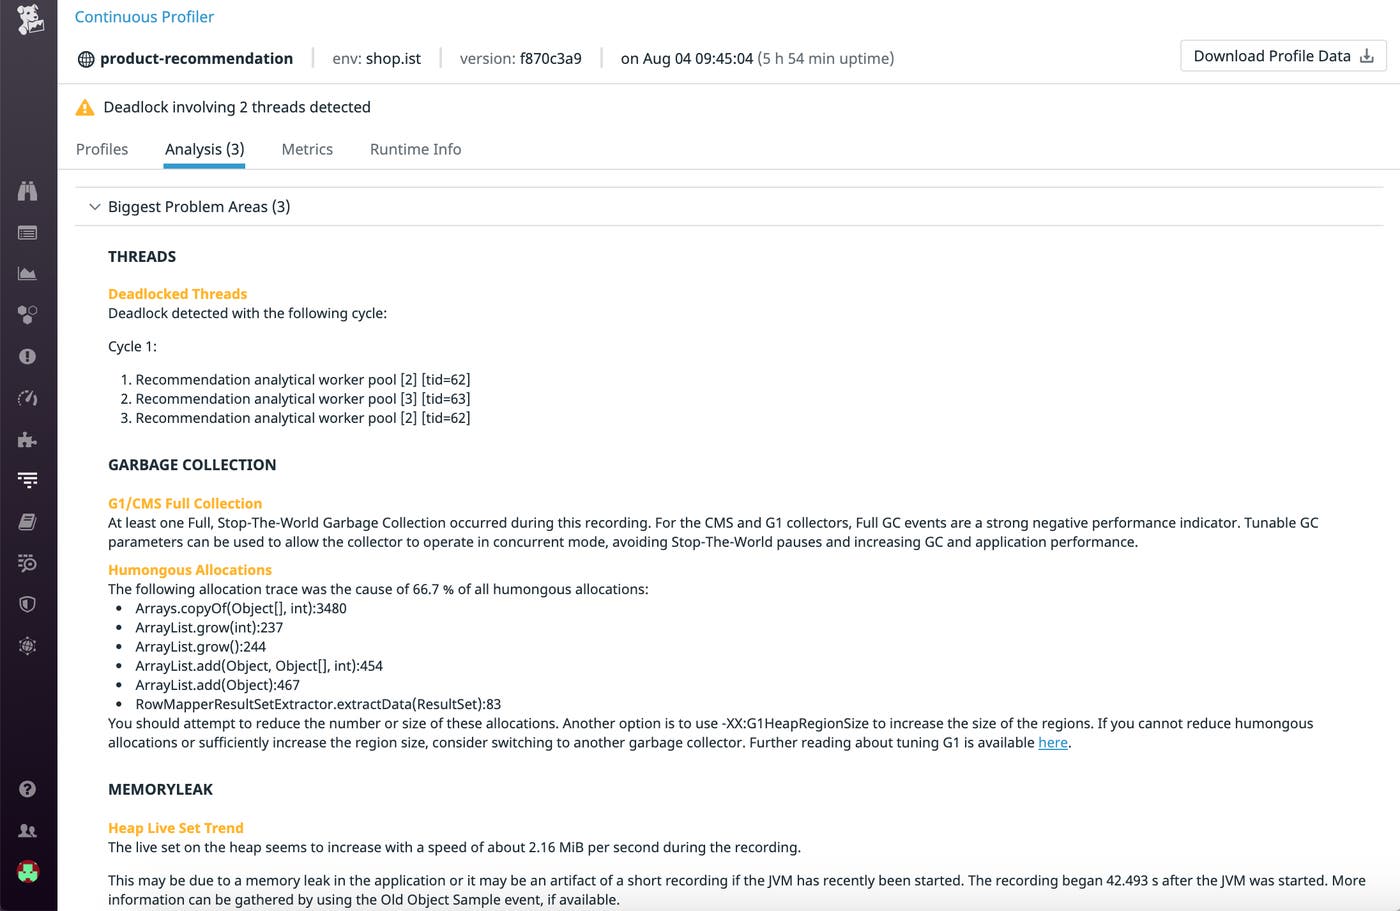
Datadog automatically performs a heuristic analysis of your code and displays a summary of the main problem areas at the top of the Analysis view. In the example below, we can see that the largest performance improvements can be achieved from addressing the deadlocked threads, inefficient garbage collection, and memory leak. For even more granular insight, you can view the complete analysis, broken down by categories such as code cache, class loading, and heap.
Continuous Profiler provides a powerful way to observe long-term performance trends since it collects data from all your hosts, all the time, without requiring access to individual machines. By pivoting to the Metrics tab from within a profile, you can get an overview of key metrics from the service, such as top CPU usage by method, top memory allocations by thread, and garbage collection time by phase.
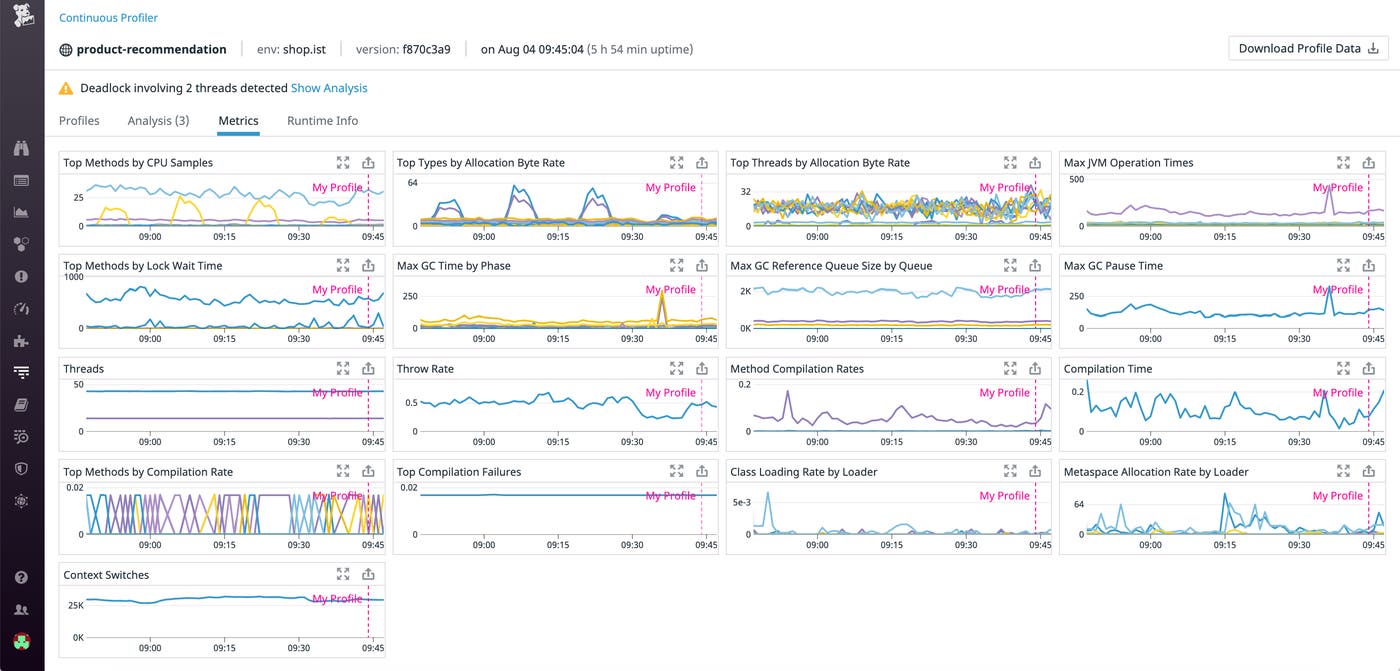
With the time of the profile overlaid on all the graphs, you can determine whether an issue you’re seeing is new or recurring, so that you can take the appropriate course of action. By correlating different metrics, you can get a more comprehensive view of your application’s performance—and if you find any interesting trends, you can add any of these graphs to your custom dashboards, or create alerts to notify your teams when a metric rises or falls beyond a critical threshold.
Together with APM and distributed tracing, log management, Real User Monitoring, Network Performance Monitoring, and Synthetic Monitoring, Continuous Profiler delivers yet another layer of visibility to help you understand how to improve the performance of your code in production and reduce cloud infrastructure costs. Continuous Profiler is now available for Java, Python, and Go, with support for Node.js, Ruby, .NET, and PHP coming soon. If you’re not already using Datadog to monitor your infrastructure, you can get started with a 14-day free trial today.
此内容由惯性聚合(RSS阅读器)自动聚合整理,仅供阅读参考。 原文来自 — 版权归原作者所有。