



惯性聚合 高效追踪和阅读你感兴趣的博客、新闻、科技资讯
阅读原文 在惯性聚合中打开

推荐订阅源

博客园 - 【当耐特】
Stack Overflow Blog
Stack Overflow Blog
V
Visual Studio Blog
小众软件
小众软件
The Cloudflare Blog
T
Tailwind CSS Blog
Apple Machine Learning Research
爱范儿
爱范儿
美团技术团队
WordPress大学
WordPress大学
罗磊的独立博客
Microsoft Azure Blog
A
About on SuperTechFans
Last Week in AI
Last Week in AI
月光博客
月光博客
博客园 - Franky
奇客Solidot–传递最新科技情报
奇客Solidot–传递最新科技情报
G
Google Developers Blog
GbyAI
GbyAI
B
Blog
大猫的无限游戏
大猫的无限游戏
博客园 - 聂微东
Hugging Face - Blog
Hugging Face - Blog
博客园 - 叶小钗

Datadog | The Monitor blog

Introducing our open source AI-native SAST Instrument and monitor Boomi integration flows with OpenTelemetry and Datadog Not all index scans are equal: How we cut query latency by over 99% Platform engineering metrics: What to measure and what to ignore Integrate Recorded Future threat intelligence with Datadog Cloud SIEM CI/CD security: threat modeling using a MITRE-style threat matrix CI/CD security: How to secure your GitHub ecosystem Ingress NGINX is EOL: A practical guide for migrating to Kubernetes Gateway API Operating agentic AI with Amazon Bedrock AgentCore and Datadog LLM Observability: Lessons from NTT DATA Introducing the Datadog Code Security MCP Capture and analyze custom heatmaps in Session Replay Understand session replays faster with AI summaries and smart chapters Monitor ClickHouse query performance with Datadog Database Monitoring How we designed empathetic alert sounds for on-call engineers Search and act across Datadog to resolve issues faster with Bits Assistant Measure the business impact of every product change with Datadog Experiments Analyzing round trip query latency Configuring JavaScript caches for better performance Introducing Bits AI Dev Agent for Code Security Datadog achieves ISO 42001 certification for responsible AI Monitor Nutanix clusters, hosts, and VMs with Datadog Monitor Juniper Mist in Datadog A new Host Map for modern infrastructure Annotate traces to improve LLM quality with Datadog LLM Observability What’s new in Cloud SIEM: AI-powered investigations, enhanced threat intelligence, and scalable security operations Explore Kubernetes with native OpenTelemetry data Monitor Oracle Fusion Cloud Applications with Datadog Announcing the Datadog Terraform provider v4.0.0 Scaling Kubernetes workloads on custom metrics How to design cloud environments for AI-powered threat analysis
Detecting outliers in cloud infrastructure with Datadog h...
Alexis Lê-Quôc · 2013-10-07 · via Datadog | The Monitor blog

When you scale your infrastructure in the cloud, you rely on a large number of servers to work in concert. These servers should have the same performance metrics, as they’re replicas of one another. If some are visibly behaving differently, you should be concerned.

So, how do you find out if they’re behaving differently? Given enough servers the traditional visualizations start to fall short of delivering any actionable information. What can you tell from the graph below? There’s one line at 0, none above 100, and the rest falls somewhere in between. In short, not much.
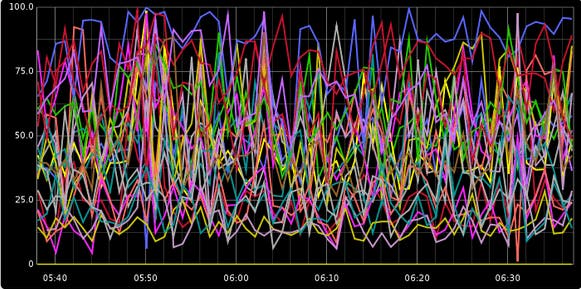
Multiple Line Graphs

What you need to gain an at-a-glance understanding of several server’s state is a third dimension (with time scale and the values themselves making up the first two dimensions), to be able to get an idea of the concentration of specific servers that fall into certain metric bands.

Datadog’s new heatmaps accomplish this. By using color brightness as the third dimension, heatmaps let you instantly grok and identify patterns for a given metric across a large number of servers.

This is helpful for two reasons. First, it gives an understanding of how most servers behave, and thus if they’re performing well, what can be considered “normal” or “expected”.
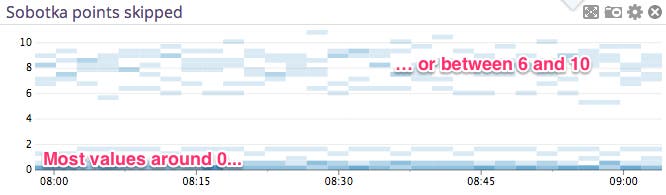
Heatmap normal distribution of values

Second, and more importantly for troubleshooting, it makes it easy to find outliers, as they are instantly visible.
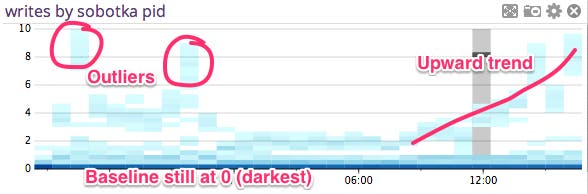
Heatmap with outliers

From there, you can click on a given band to get the details of the affected servers. And not let misbehaving servers get lost in the noise.
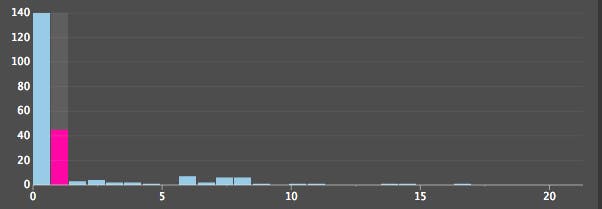
Heatmap drilldown

Getting access to Datadog’s heatmaps for your infrastructure takes just a few minutes. After you sign up for a free Datadog trial, this visualization type will be available on graphs in your dashboards.