









Vera Chan

Nimisha Saxena

Anes Bendimerad

Jesse Mack
Many organizations lack clear visibility into the efficiency of their security processes, making it difficult to accurately assess their security teams’ performance. Without insight into key factors like alert response speed, investigation thoroughness, and the accuracy of detection rules, teams risk operating without a clear view. This can lead to missed threats, inefficient use of resources, and an inability to improve security outcomes.
To give security teams enhanced insights into how they are performing, Datadog Cloud SIEM delivers comprehensive security operational metrics—mean time to detect (MTTD), mean time to acknowledge (MTTA), and mean time to resolve (MTTR)—that offer clear visibility into your teams’ effectiveness. With these insights, security teams can streamline their processes, address threats promptly, and continuously optimize operations to enhance security performance.
In this post, we’ll cover:
How Datadog calculates security operational metrics
How to visualize the metrics in dashboards
How to explore, tag, and track progress on your security operational metrics
Security operational metrics are distribution metrics—these are calculated across the entirety of your distributed infrastructure at specific intervals, providing accurate percentile aggregations, as well as the ability to customize tags.
The three security operational metrics available in Datadog Cloud SIEM are:
Datadog.security.siem_signal.time_to_detect: Time to detect (TTD) measures the time from when a log triggers a security signal (T0) to when the signal is generated (T1), representing the speed of threat detection.
Datadog.security.siem_signal.time_to_acknowledge: Time to acknowledge (TTA) tracks the time from signal generation (T1) to when the signal is marked as under review (T2), showing how quickly teams initiate investigations.
Datadog.security.siem_signal.time_to_resolve: Time to resolve (TTR) measures the total time from signal generation (T1) to when the signal is archived (T3), reflecting the duration required to fully resolve the incident.
These metrics enable security teams to monitor and enhance their detection and response times, ensuring quick action against security threats.
The Cloud SIEM Overview dashboard now includes security operational metrics out of the box, so that teams can quickly and easily start tracking MTTD, MTTA, and MTTR to evaluate and improve the effectiveness of their incident response.
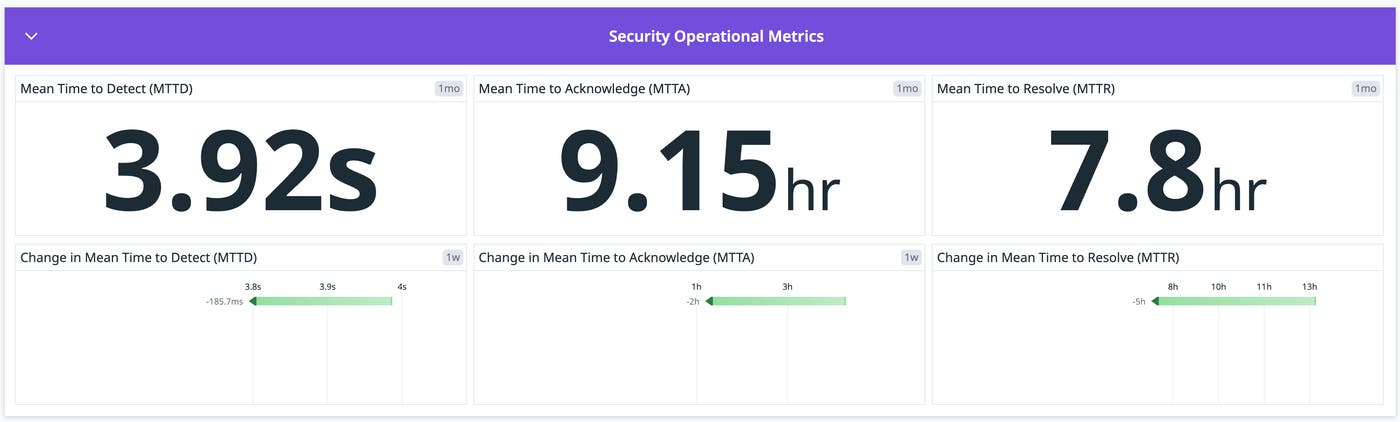
With these metrics, you can spot trends, measure improvements, and ensure your team is consistently optimizing its response workflows to minimize potential security risks. The ability to customize time ranges provides additional flexibility in how you query these metrics. You can also add security operational metrics to your own custom dashboards, giving teams the flexibility to monitor threats and response times in the dashboards they already use.
To explore security operational metrics in greater depth, you can also use the Metrics Summary, which provides a centralized view of all your metrics, including important metadata and context. Here, you can see exactly which dashboards, notebooks, monitors, and SLOs are using your security operational metrics, giving you visibility into how this data is being leveraged across your security operations. This summary helps you ensure that teams are tracing and using all relevant metrics to understand their performance and inform security strategy.
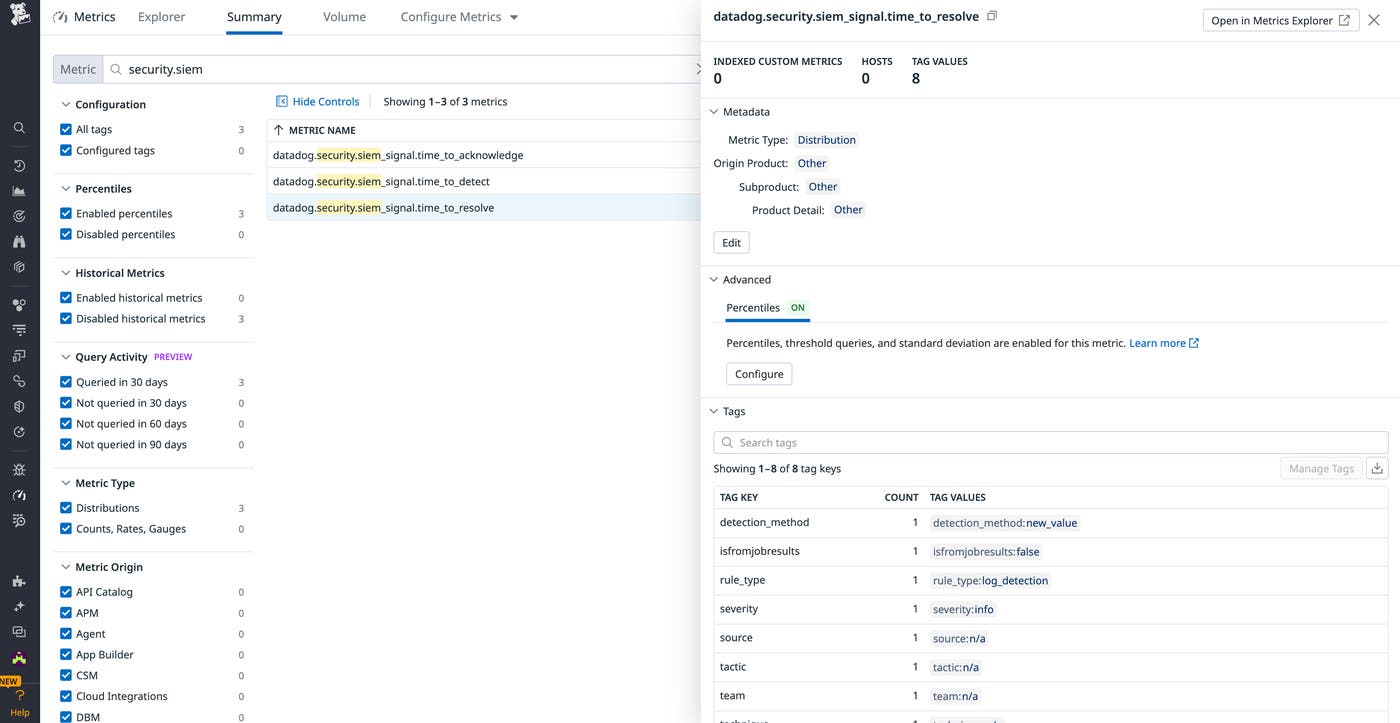
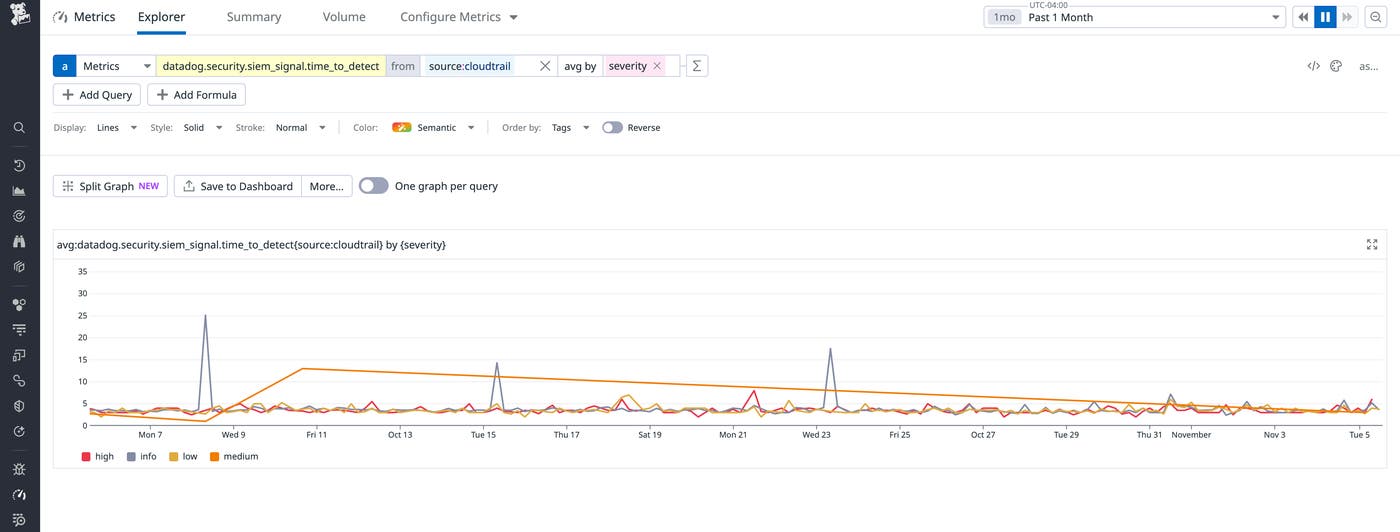
You can also use tags to further enhance the usability of these metrics and filter them based on specific teams, data sources, or environments. This granularity lets you focus on the most relevant data for different segments of your security infrastructure. Once filtered, you can create custom dashboards to visualize key metrics or set up monitors that trigger alerts when certain thresholds are met.
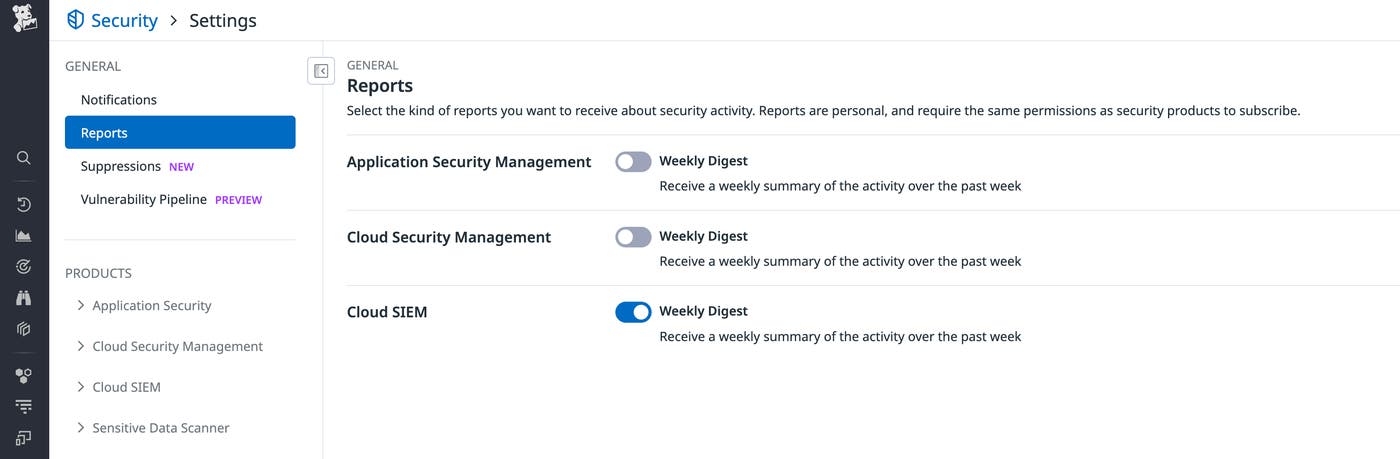
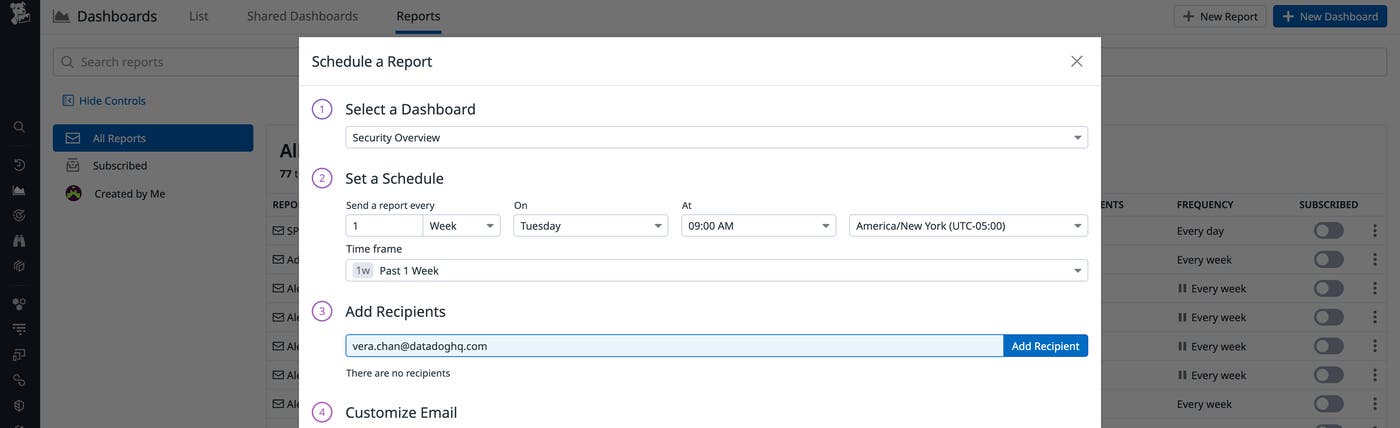
To help you stay on top of your operational metrics, Datadog Cloud SIEM generates weekly digest reports that provide a consolidated overview of key metrics and operational insights. These reports summarize critical information such as alert volumes, response times, and investigation outcomes, allowing teams to assess their performance and identify trends over time so they can proactively address vulnerabilities and optimize their security operations.
Datadog Cloud SIEM security operational metrics offer valuable insights into your teams’ effectiveness and facilitate seamless monitoring, enabling you to respond effectively to evolving threats, maintain a stronger security posture, and ensure that your cloud environments remain secure and resilient. Check out our in-depth guide for more information about monitoring these and other key security metrics.
If you’re already a Datadog customer, see our documentation so you can start exploring security operational metrics in the Cloud SIEM Overview dashboard and start receiving weekly digest reports now. If you’re not a customer, you can get started today with a 14-day free trial.
此内容由惯性聚合(RSS阅读器)自动聚合整理,仅供阅读参考。 原文来自 — 版权归原作者所有。