



In Part 2 of this series, we showed you how to monitor Azure SQL Database metrics and logs using the Azure platform. In this post, we will look at how you can use Datadog to monitor your Azure SQL databases alongside other technologies in your infrastructure. Datadog provides turn-key integrations for Azure along with more than 1,000 other technologies, enabling you to track long-term performance trends across all systems in your infrastructure, not just your SQL databases.
We will walk through how to:
Collect Azure telemetry data via Datadog’s Azure integration
Visualize key performance metrics
Analyze and alert on database logs to get a better understanding of database performance and activity
Use audit logs to surface potential threats to your SQL databases
Datadog’s Azure integration enables you to easily forward telemetry data from your database instances and elastic pools to Datadog in order to monitor key metrics, analyze database performance, and alert on potentially malicious activity on your database instances. The integration collects metrics from Azure Monitor and enables Datadog to generate additional metrics that give you further visibility into resource limits and quotas, the state of your databases’ geo-replication links, and more.
You can integrate Datadog with your Azure account using either the Azure CLI or Azure Portal. In either case, this process will generate client and tenant IDs and a client secret, which are required for creating a new app registration in Datadog’s Azure integration tile.
Once you create a new app registration, Datadog will start collecting metrics from all available Azure resources, such as your virtual machines, app services, load balancers, and SQL database instances. We’ll look at how you can visualize and alert on key database performance metrics in more detail later. Next, we’ll show you how to export diagnostic and audit logs from your Azure SQL databases to Datadog.
Azure SQL Database instances generate diagnostic and audit logs, which you can collect with Datadog to give you better visibility into database activity that could affect performance or pose a security risk. In Part 2, we looked at how to configure your SQL databases to write these logs to an event hub, which is the recommended method for forwarding logs to a third-party service for analysis. To export database resource and audit logs from an event hub to Datadog, you can run an automated script via the cloud shell in Azure Portal, making sure to replace <API_KEY> with your Datadog API key and <SUBSCRIPTION_ID> with your Azure Subscription ID.
Datadog automatically parses and enriches incoming database logs via a built-in Azure SQL log pipeline, enabling you to search them by key attributes, such as a database’s name or availability zone.
Now that you are collecting Azure telemetry data, you can use Datadog to monitor the key performance metrics we discussed in Part 1, create visualizations of your log data to analyze database activity, and build custom threat detection rules to proactively monitor database security.
Datadog provides full visibility into the health and performance of your databases via an out-of-the-box integration dashboard. The dashboard gives you a high-level overview of all of your database instances and elastic pools and includes some of the key metrics we discussed in Part 1, such as CPU utilization and deadlocks.
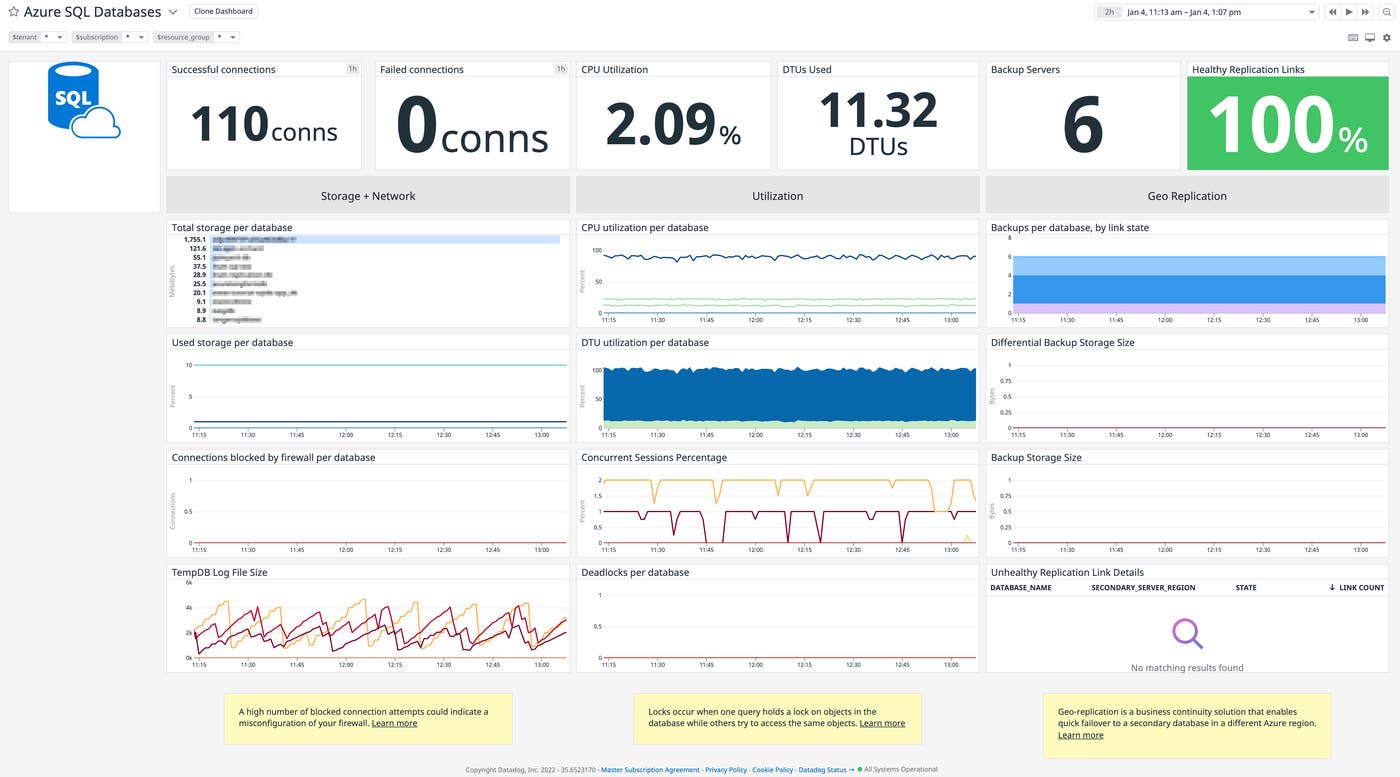
You can also create custom dashboards to track database performance alongside other Azure services and technologies in your stack. This can provide better visibility into how well your databases are performing in relation to the services they support. For example, you can use the dashboard to determine if a sudden increase in database CPU utilization was caused by an increase in the number of incoming requests to an application server. If there is not a correlated spike in server requests, then an inefficient query may be to blame. You can then review your database logs, which provide more details about query performance, to troubleshoot further.
It’s important to always be aware of the status and performance of your database instances, but that can become more difficult as you scale your databases to support growing applications. You can use Datadog Log Analytics to surface performance issues that are easily missed, such as long-running queries. Inefficient queries are often the primary cause of poor database performance because they can quickly consume resources and trigger deadlocks.
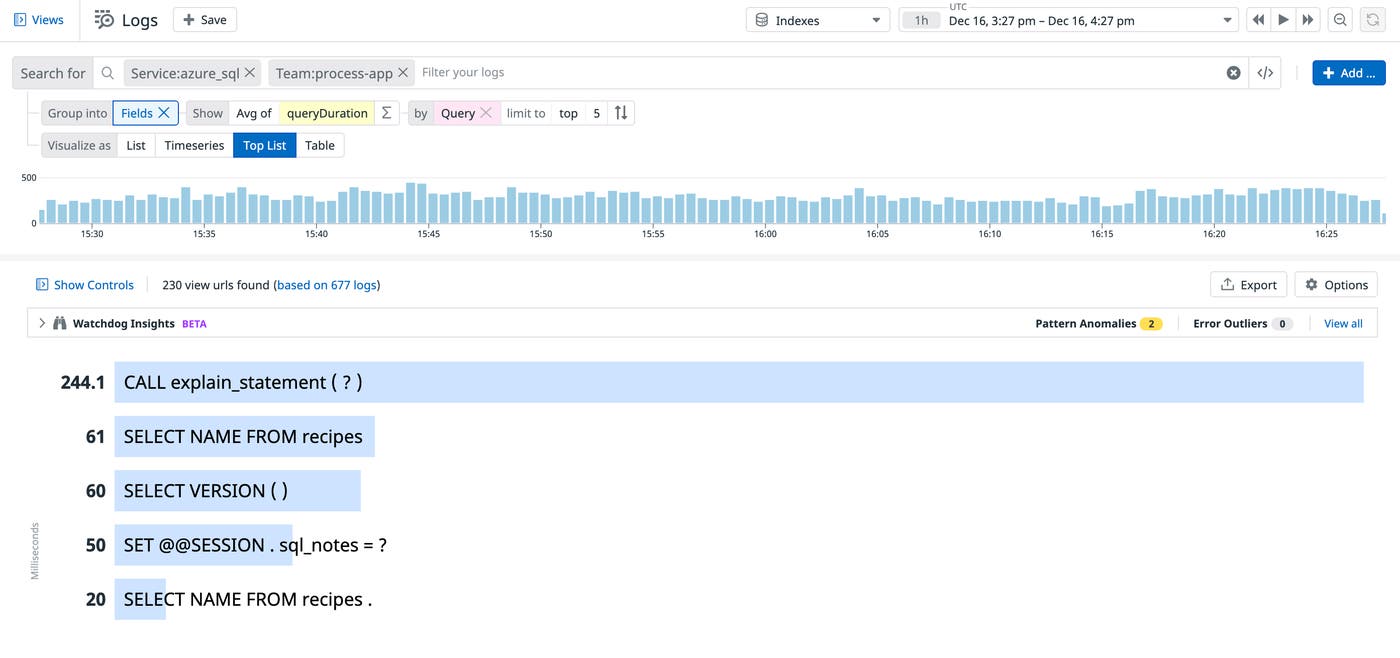
You can also export any log query to create custom alerts that automatically notify you of a decline in database performance, such as when a query’s duration exceeds a specified threshold.
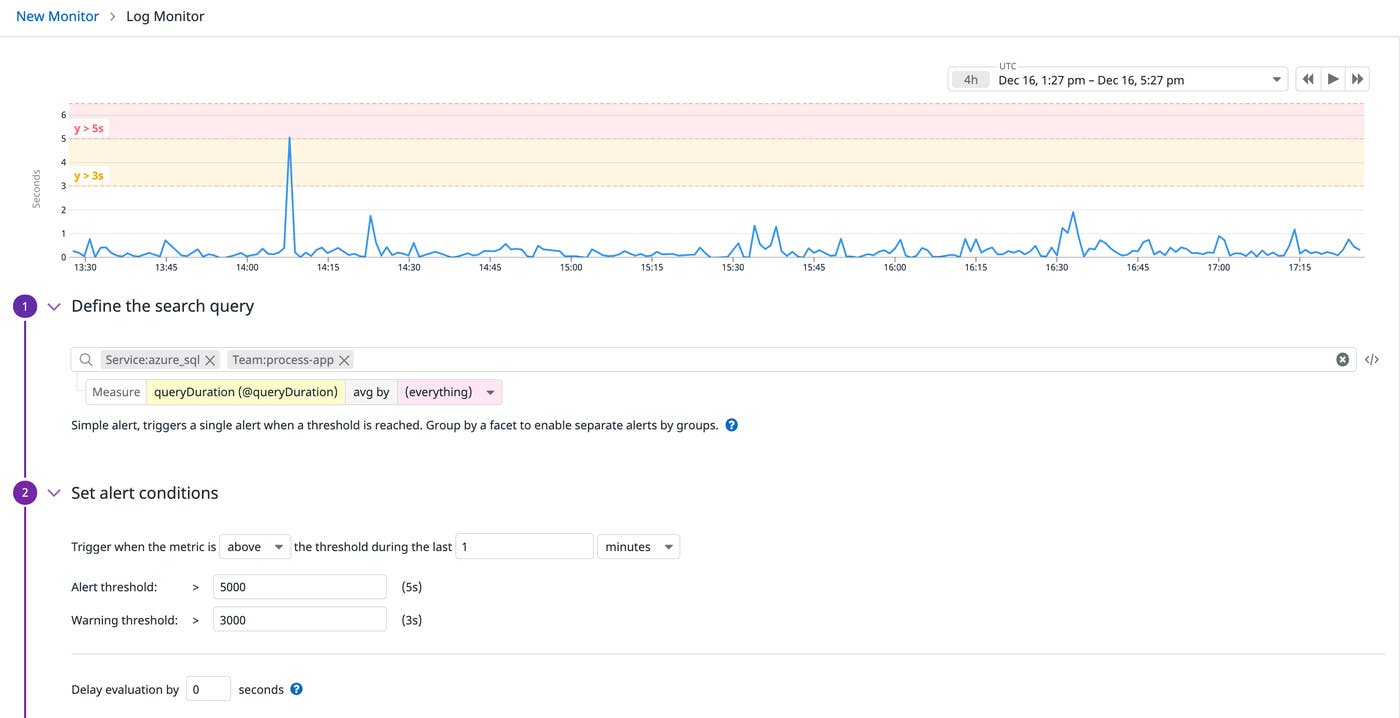
Analyzing and alerting on your SQL Database logs enables you to prioritize the queries that you should optimize. Azure provides several recommendations for optimizing query performance, such as dropping indexes that are no longer used.
Monitoring database performance is one aspect of ensuring that your database instances are able to continue supporting your application. It’s also important to make sure that databases are secure, as they store valuable application and customer data, which make them a primary target for attackers. As mentioned in Part 2, Azure SQL Database can generate audit logs that contain key information about database activity, such as who is connecting to an instance, what queries they ran, and whether they accessed sensitive information. If you’ve enabled auditing for Azure SQL databases, you can use Datadog to collect these logs and surface potential threats to your database instances with Datadog Cloud SIEM.
For example, Datadog’s built-in detection rules can scan your audit logs and notify you when a firewall rule for a database has been modified to allow connections from unauthorized sources.
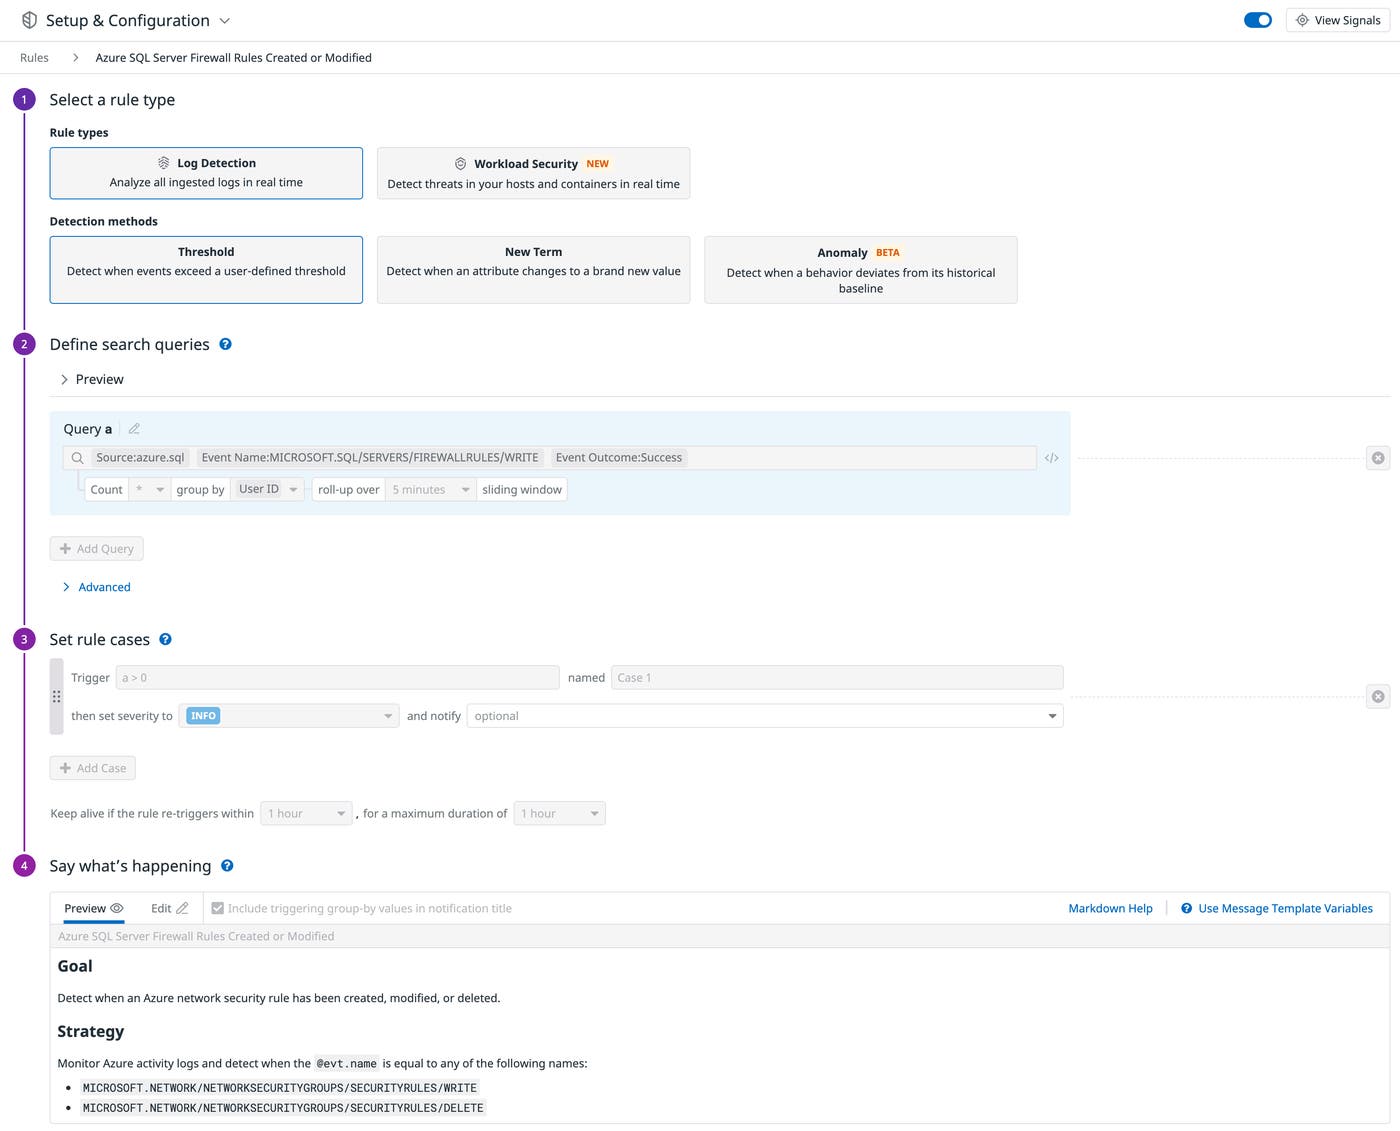
You can also use rules to detect when an source attempts to execute a SQL query as part of an application’s input (e.g., username or password field), which could indicate that the application is vulnerable to SQL injection attacks. This type of activity enables attackers to manipulate SQL queries in order to tamper with a database or get access to sensitive information.
When a detection rule flags an incoming log, Datadog will generate a security signal that provides more context about the activity. You can use signals to share mitigation steps that help teams troubleshoot and resolve the issue faster, such as leveraging stored procedures for a service’s SQL queries or sanitizing application inputs.
In this post, we’ve shown how to collect telemetry data from your Azure SQL databases and get full visibility into their health, performance, and security—alongside the other technologies supporting your applications. Check out our documentation to learn more about Datadog’s Azure integration and start collecting data from your SQL databases, or sign up for a 14-day free trial today.
此内容由惯性聚合(RSS阅读器)自动聚合整理,仅供阅读参考。 原文来自 — 版权归原作者所有。