





More love for your Microsoft stack from Datadog!
Alongside our Microsoft Event Viewer, IIS, and SQL Server integrations, you are now able to monitor custom metrics in your .NET applications with our new DogStatsD C\# client.
DogStatsD is a metrics aggregation server that is bundled with the Datadog Agent. The DogStatsD C\# client is a C\# library that sends custom metrics to the Agent’s DogStatsD server from within .NET web applications and other C\# projects. These metrics will then be sent to Datadog, where they can be graphed and analyzed in realtime. DogStatsD is based on the StatsD protocol. Check out Olivier’s blog post for more information about StatsD, and our DogStatsD guide for more information about DogStatsD.
In order to start using the DogStatsD C\# client in Microsoft Visual Studio 2012, you’ll need the following:
A Datadog account so that you can graph and analyze your custom metrics
The NuGet package manager to easily fetch and install the client
A running Windows Datadog Agent that will receive the metrics sent by the client
Once you’ve got these prerequisites, open the project you want to monitor in Visual Studio. Then, click on the Tools menu, hover over Library Package Manager, and select Package Manager Console.
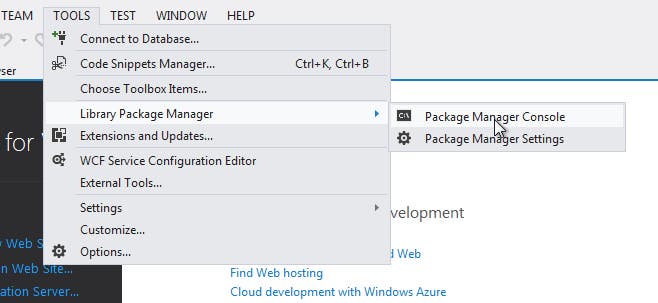
The Package Manager Console will now be displayed. Execute the following command in the console:
Install-Package DogStatsD-CSharp-Client
The output should be similar to the following:
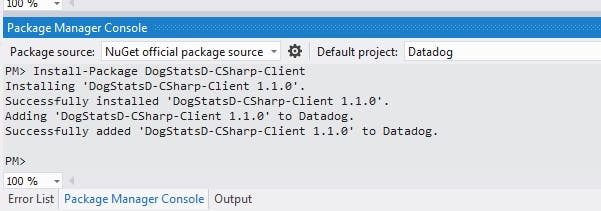
You’re now ready to start using the library!
Now we’ll show you how to quickly get up and running from your ASP .NET MVC 4 web application. We’ll also show some simple ways you can use the client to monitor your application.
Create a file containing a StatsdConfig class in your App_Start folder. Depending on your setup, you may need to modify how you configure the client:
Next, call StatsdConfig.Configure() in your application’s Application_Start() method in Global.asax.cs:
We’re now configured and ready to capture some custom metrics!
I’ve just deployed some new authentication logic and I want to make sure that it hasn’t significantly lengthened the time required to sign in. Here’s the controller method associated with the action:
Let’s wrap the authentication and redirect in a timer. First we have to include the library at the top of the file:
using StatsdClient;
Surround the code we want to time with a timer:
And that’s it! We’ll now start to see this metric appear in Datadog:
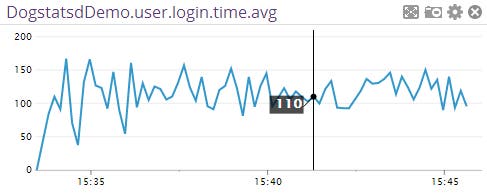
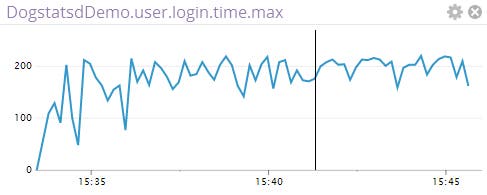
Now that we know how long it’s taking users to sign in, let’s check how many unique users are accessing the site. Here is the controller method that’s responsible for rendering my home page:
I’m going to use the set metric, which counts the number of unique elements in a group. In this case, our elements will be the usernames of authenticated users.
Again, we need to start by including the library at the top of the file:
using StatsdClient;
Then add the code to send the metric:
Now we’ll start seeing the unique users metric in Datadog:
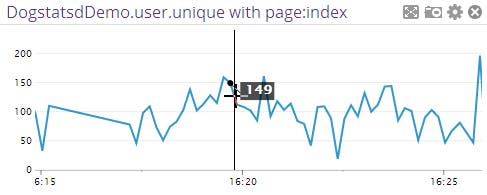
Notice that I’ve tagged the metric with page:index. Once I start adding user.unique metrics for other pages, I’ll be able to graph unique users on specific pages, or across all pages:
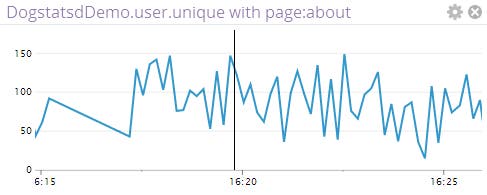
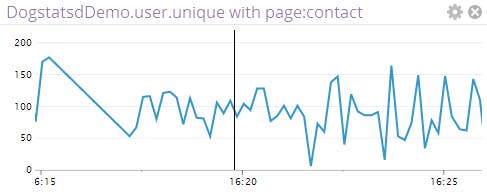
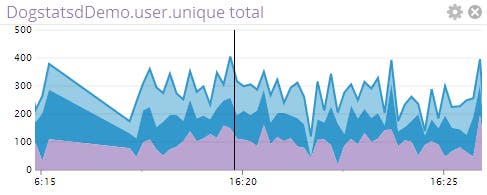
And that’s it! More detailed documentation for the library can be found on the GitHub repository.
Click here to try Datadog for free for 14 days. Happy monitoring!
此内容由惯性聚合(RSS阅读器)自动聚合整理,仅供阅读参考。 原文来自 — 版权归原作者所有。