



惯性聚合 高效追踪和阅读你感兴趣的博客、新闻、科技资讯
阅读原文 在惯性聚合中打开

推荐订阅源

博客园 - 三生石上(FineUI控件)
S
SegmentFault 最新的问题
阮一峰的网络日志
阮一峰的网络日志
freeCodeCamp Programming Tutorials: Python, JavaScript, Git & More
钛媒体:引领未来商业与生活新知
钛媒体:引领未来商业与生活新知
雷峰网
雷峰网
Apple Machine Learning Research
WordPress大学
WordPress大学
博客园 - 司徒正美
奇客Solidot–传递最新科技情报
奇客Solidot–传递最新科技情报
宝玉的分享
宝玉的分享
爱范儿
爱范儿
月光博客
月光博客
The GitHub Blog
The GitHub Blog
M
MIT News - Artificial intelligence
H
Hackread – Cybersecurity News, Data Breaches, AI and More
B
Blog
T
Tailwind CSS Blog
美团技术团队
D
Docker
V
Visual Studio Blog
Martin Fowler
Martin Fowler
博客园 - 聂微东
The Cloudflare Blog

Datadog | The Monitor blog

Introducing our open source AI-native SAST Instrument and monitor Boomi integration flows with OpenTelemetry and Datadog Not all index scans are equal: How we cut query latency by over 99% Platform engineering metrics: What to measure and what to ignore Integrate Recorded Future threat intelligence with Datadog Cloud SIEM CI/CD security: threat modeling using a MITRE-style threat matrix CI/CD security: How to secure your GitHub ecosystem Ingress NGINX is EOL: A practical guide for migrating to Kubernetes Gateway API Operating agentic AI with Amazon Bedrock AgentCore and Datadog LLM Observability: Lessons from NTT DATA Introducing the Datadog Code Security MCP Capture and analyze custom heatmaps in Session Replay Understand session replays faster with AI summaries and smart chapters Monitor ClickHouse query performance with Datadog Database Monitoring How we designed empathetic alert sounds for on-call engineers Search and act across Datadog to resolve issues faster with Bits Assistant Measure the business impact of every product change with Datadog Experiments Analyzing round trip query latency Configuring JavaScript caches for better performance Introducing Bits AI Dev Agent for Code Security Datadog achieves ISO 42001 certification for responsible AI Monitor Nutanix clusters, hosts, and VMs with Datadog Monitor Juniper Mist in Datadog A new Host Map for modern infrastructure Annotate traces to improve LLM quality with Datadog LLM Observability What’s new in Cloud SIEM: AI-powered investigations, enhanced threat intelligence, and scalable security operations Explore Kubernetes with native OpenTelemetry data Monitor Oracle Fusion Cloud Applications with Datadog Announcing the Datadog Terraform provider v4.0.0 Scaling Kubernetes workloads on custom metrics How to design cloud environments for AI-powered threat analysis
Push Datadog alerts and events to VictorOps
Adrien Vaschalde · 2014-08-07 · via Datadog | The Monitor blog
Adrien Vaschalde

Adrien Vaschalde

We’re excited to announce a new integration with our friends at VictorOps. VictorOps is an alert management system that lets you define your team’s on-call schedules and escalation policies and provides a place for team members to collaborate and problem-solve.

With this new integration, you can receive Datadog alerts into your VictorOps timeline, allowing you to get notified (via email, phone, SMS or push) for all critical server, database, and application events. If you are a VictorOps customer this integration is available to you today in Datadog.

Create VictorOps timeline alerts from Datadog

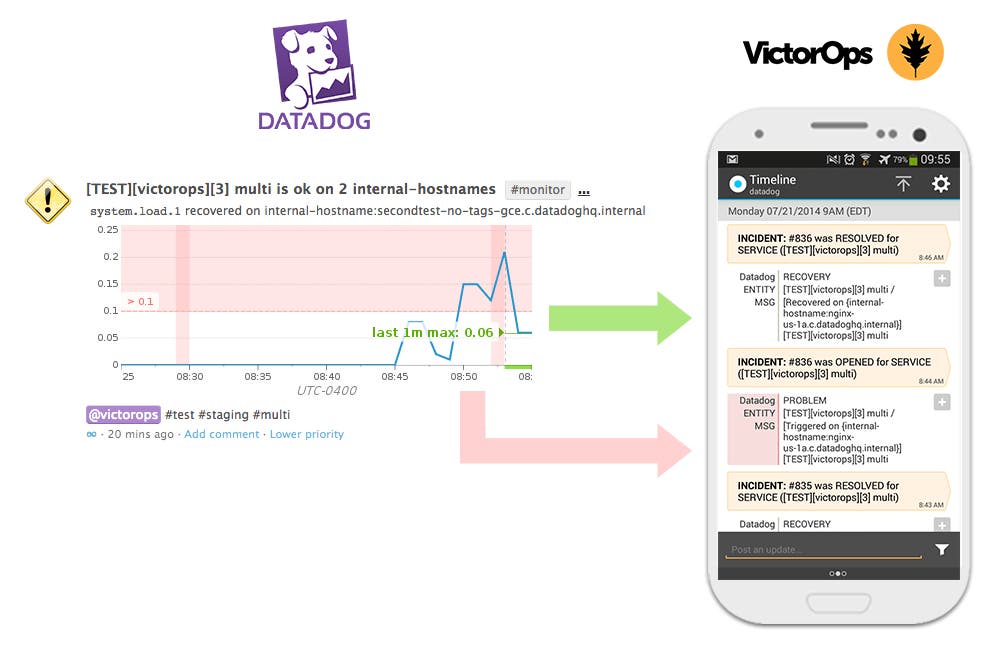
The integration lets you create VictorOps alerts directly from the Datadog stream. Alerts go immediately to the person on-call or people involved in an issue. To do this, you customize notification recipients in VictorOps, and then tell Datadog which group should be reached using @victorops-group. Datadog will send the alert only to the team members defined in the list. For example, the alert below, triggered in Datadog, sends an incident report to each recipient’s mobile phone.
victorops timeline

Update VictorOps alert status from Datadog

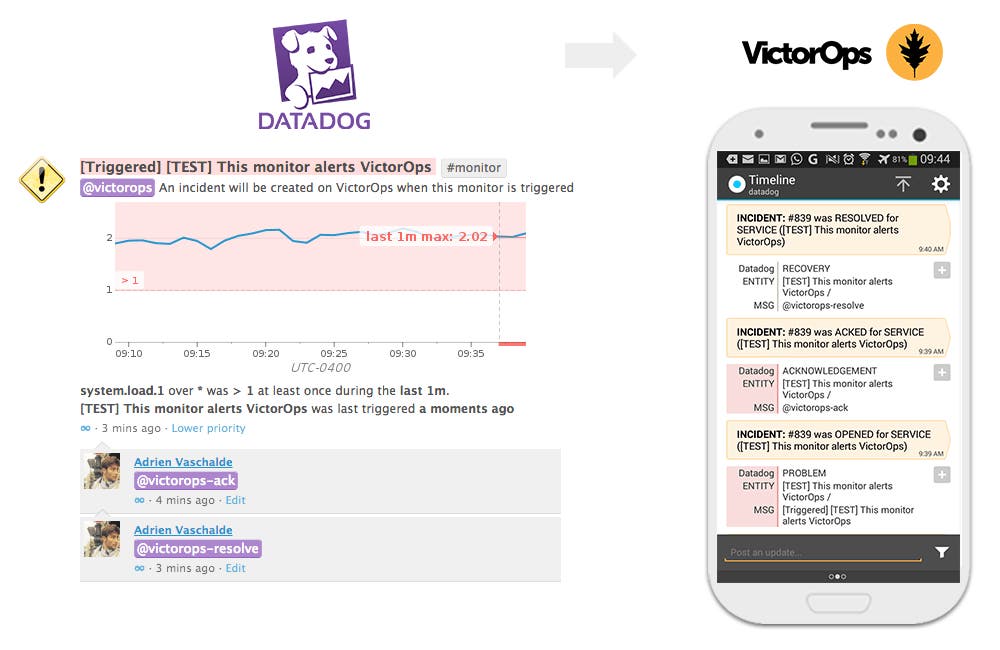
VictorOps then takes the appropriate notification action by sending an alert to a distribution list you have set up. Your team can claim an issue and update the alert status in VictorOps using the @victorops-acknowledge and @victorops-close tags from the Datadog Events Stream.
victorops timeline

Find out what caused the alert in Datadog

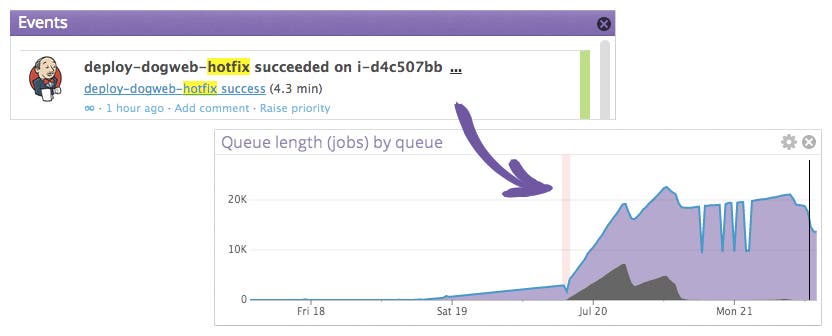
Once you are notified of an alert, you can immediately log-in to Datadog and begin to correlate system metrics to events. In the example below, Datadog alerted a VictorOps team when a queue length grew over 20K. Once in Datadog, you can overlay build events on the queue size and see that the queue size starts growing right after a build completed. As a result, you are able to correlate the build event to the alert and revert back to a stable release to reduce the queue size.
victorops timeline

To monitor and receive important server, database, and application events and alerts to your phone, sign up for a 14-day free trial of Datadog and then sign up for a free trial of VictorOps for rapid alert notifications and responses.

For more information about how to configure the Datadog integration, check out the VictorOps Knowledge Base article.