


惯性聚合 高效追踪和阅读你感兴趣的博客、新闻、科技资讯
阅读原文 在惯性聚合中打开

推荐订阅源

D
DataBreaches.Net
F
Fortinet All Blogs
D
Docker
让小产品的独立变现更简单 - ezindie.com
WordPress大学
WordPress大学
罗磊的独立博客
Y
Y Combinator Blog
Cyber Security Advisories - MS-ISAC
J
Java Code Geeks
T
The Blog of Author Tim Ferriss
U
Unit 42
N
Netflix TechBlog - Medium
OSCHINA 社区最新新闻
OSCHINA 社区最新新闻
V
V2EX
云风的 BLOG
云风的 BLOG
钛媒体:引领未来商业与生活新知
钛媒体:引领未来商业与生活新知
T
Tailwind CSS Blog
Hugging Face - Blog
Hugging Face - Blog
Stack Overflow Blog
Stack Overflow Blog
爱范儿
爱范儿
酷 壳 – CoolShell
酷 壳 – CoolShell
P
Proofpoint News Feed
G
Google Developers Blog
H
Help Net Security

Datadog | The Monitor blog

Introducing our open source AI-native SAST Instrument and monitor Boomi integration flows with OpenTelemetry and Datadog Not all index scans are equal: How we cut query latency by over 99% Platform engineering metrics: What to measure and what to ignore Integrate Recorded Future threat intelligence with Datadog Cloud SIEM CI/CD security: threat modeling using a MITRE-style threat matrix CI/CD security: How to secure your GitHub ecosystem Ingress NGINX is EOL: A practical guide for migrating to Kubernetes Gateway API Operating agentic AI with Amazon Bedrock AgentCore and Datadog LLM Observability: Lessons from NTT DATA Introducing the Datadog Code Security MCP Capture and analyze custom heatmaps in Session Replay Understand session replays faster with AI summaries and smart chapters Monitor ClickHouse query performance with Datadog Database Monitoring How we designed empathetic alert sounds for on-call engineers Search and act across Datadog to resolve issues faster with Bits Assistant Measure the business impact of every product change with Datadog Experiments Analyzing round trip query latency Configuring JavaScript caches for better performance Introducing Bits AI Dev Agent for Code Security Datadog achieves ISO 42001 certification for responsible AI Monitor Nutanix clusters, hosts, and VMs with Datadog Monitor Juniper Mist in Datadog A new Host Map for modern infrastructure Annotate traces to improve LLM quality with Datadog LLM Observability What’s new in Cloud SIEM: AI-powered investigations, enhanced threat intelligence, and scalable security operations Explore Kubernetes with native OpenTelemetry data Monitor Oracle Fusion Cloud Applications with Datadog Announcing the Datadog Terraform provider v4.0.0 Scaling Kubernetes workloads on custom metrics How to design cloud environments for AI-powered threat analysis
Where is open source monitoring going?
Alexis Lê-Quôc · 2013-04-03 · via Datadog | The Monitor blog

We are really proud to have sponsored the very first edition of Monitorama, the conference of open source monitoring that took place in Boston on March 28th and 29th.

Datadog as a monitoring service would not exist without open source and we make sure to open source all our client code, libraries and in general, contribute back in any way we can (such as being sponsors of community conferences such as this and DevOpsDays).

The Conversation

Meeting at the Microsoft NERD center in Boston, the audience was here in numbers, proof that monitoring is a topic on everybody’s mind.
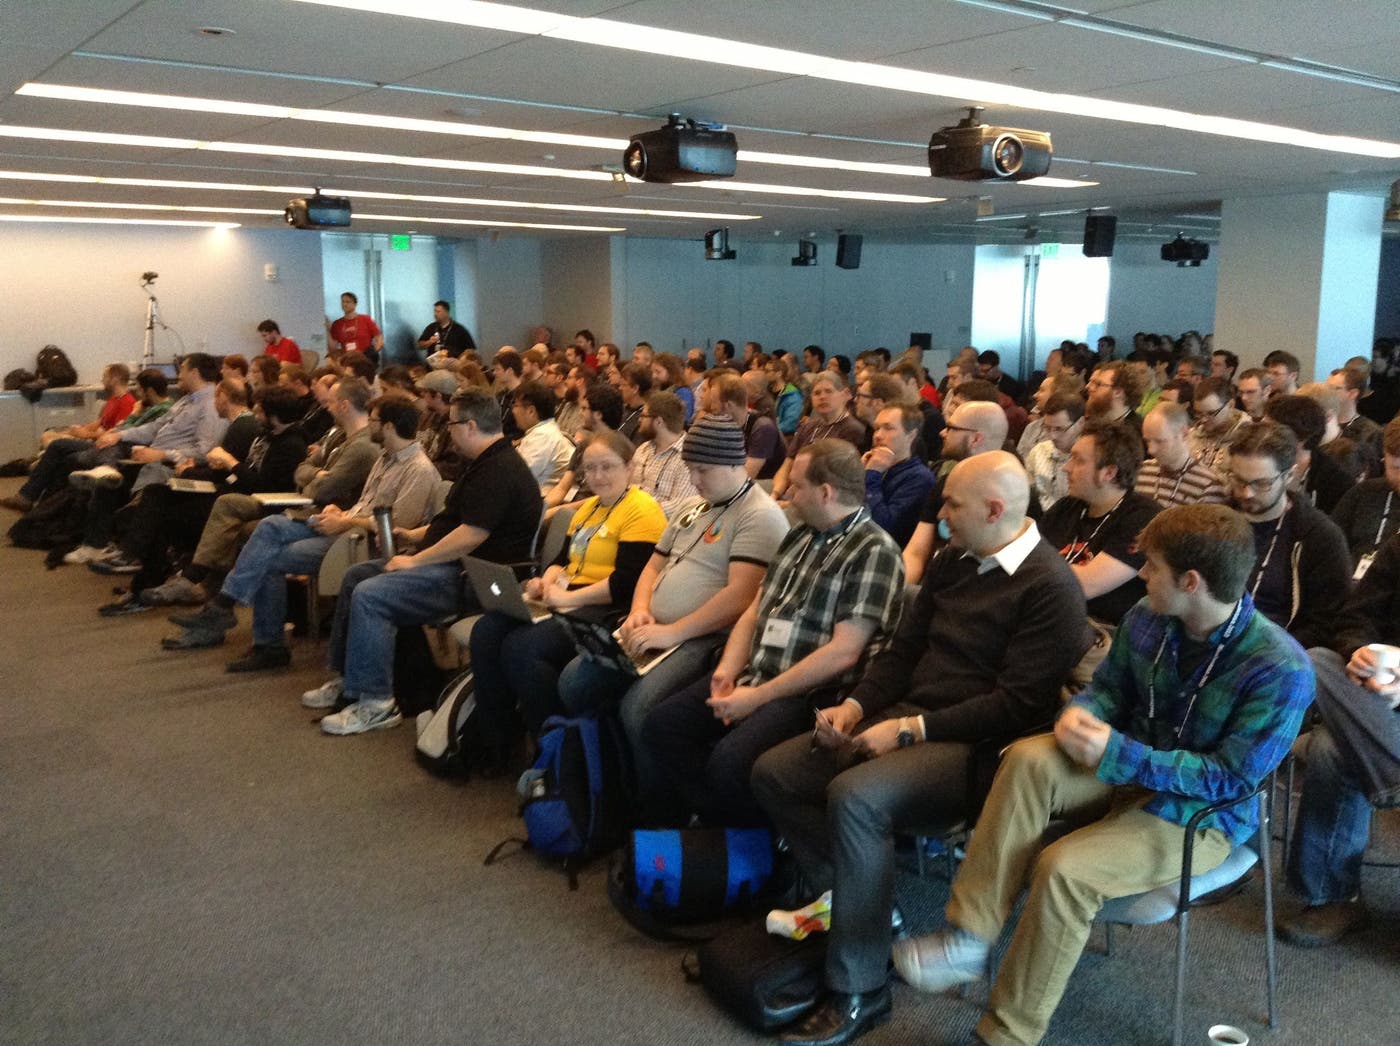
open source monitoring

Speakers covered a whole range of topics but generally fell into 3 categories:

  1. High-level, fundamental presentations on new design directions for monitoring tools with a strong focus on alert response (John Allspaw’s keynote) and on the fundamentals of interpreting monitoring data (Dr. Neil Gunther’s keynote)

  2. Culture tweaks to make the lives of operations teams easier through monitoring (e.g. Jesse Newland on Optimizing Ops for Happiness)

  3. New tools and visualizations (e.g. Kyle Kingsbury’s hilarious, hand-drawn presentation of his clojure-based, event stream monitor, Riemann)

Speaker presentations will be available on Monitorama’s SpeakerDeck account.

Many thanks to Jason Dixon and his team of volunteers to have made this excellent first edition a wild success.