









Built on Postgres, Supabase is an open source, all-in-one backend platform for developers who want to ship applications without managing infrastructure. This makes it especially popular with frontend developers and vibe coders who may have little to no database expertise. Datadog’s Supabase integration provides high-level infrastructure metrics, but developers also need query-level visibility to easily diagnose, optimize, and trace performance issues back to their source. Without that visibility, it’s difficult to determine whether slowdowns originate in the service layer or in Postgres itself.
Datadog Database Monitoring (DBM) for Supabase gives developers query-level metrics, explain plans, and optimization recommendations in a single platform. Its setup is agentless and can be completed in one click. After setup, developers can detect regressions, trace slowdowns from the application layer to the database, and act on issues even if they lack deep Postgres expertise.
In this post, we’ll show how Database Monitoring for Supabase helps app developers:
Monitor Supabase instances with one click
Catch performance regressions as soon as they happen
Discover and test optimizations to improve performance
Trace application slowdowns to their source in the database
When teams are focused on shipping fast, setting up deep database monitoring can seem like a burdensome task that is easy to deprioritize. But without visibility into database activity, regressions can go undetected until users start reporting slowdowns.
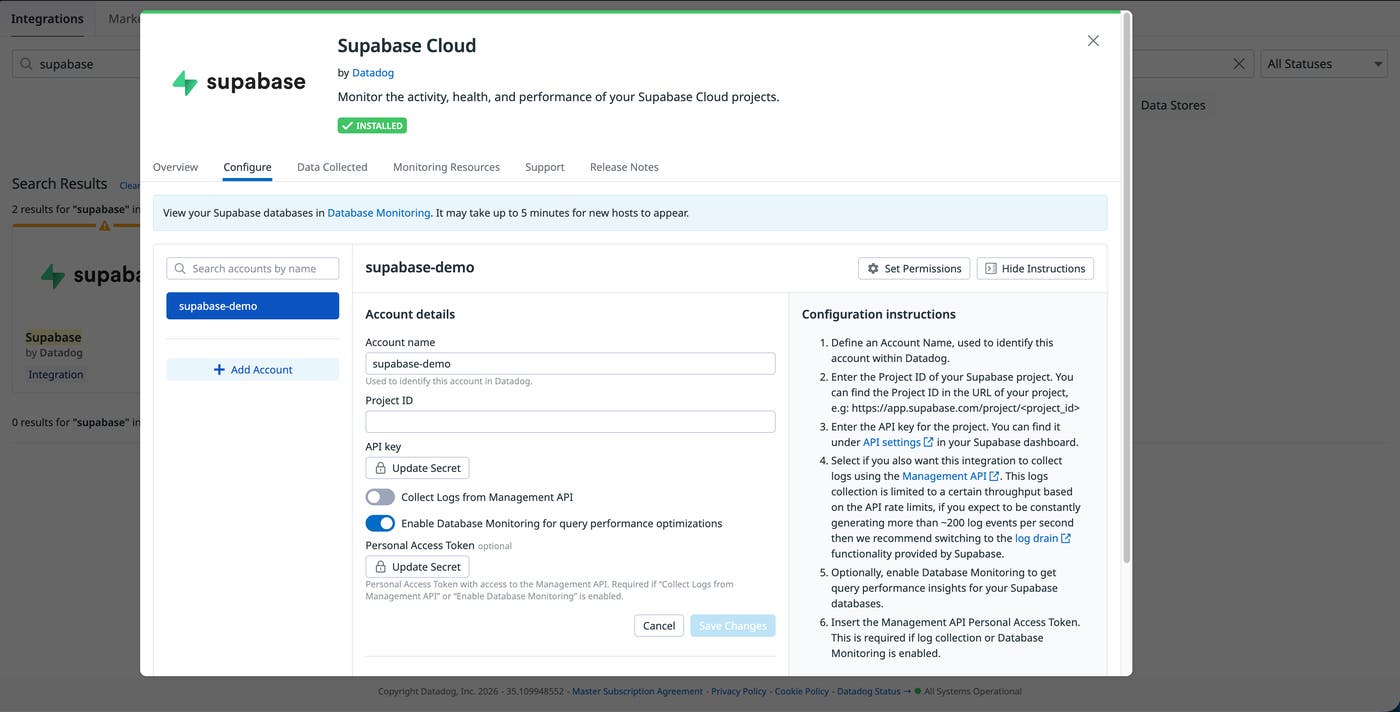
DBM for Supabase resolves this problem with a one-click, agentless setup. Traditionally, enabling deep database monitoring requires deploying and managing an agent. With the Supabase Cloud integration, you can enable Database Monitoring directly from within Datadog. Datadog connects directly to your database and immediately surfaces the query-level telemetry data that helps you diagnose database performance issues.
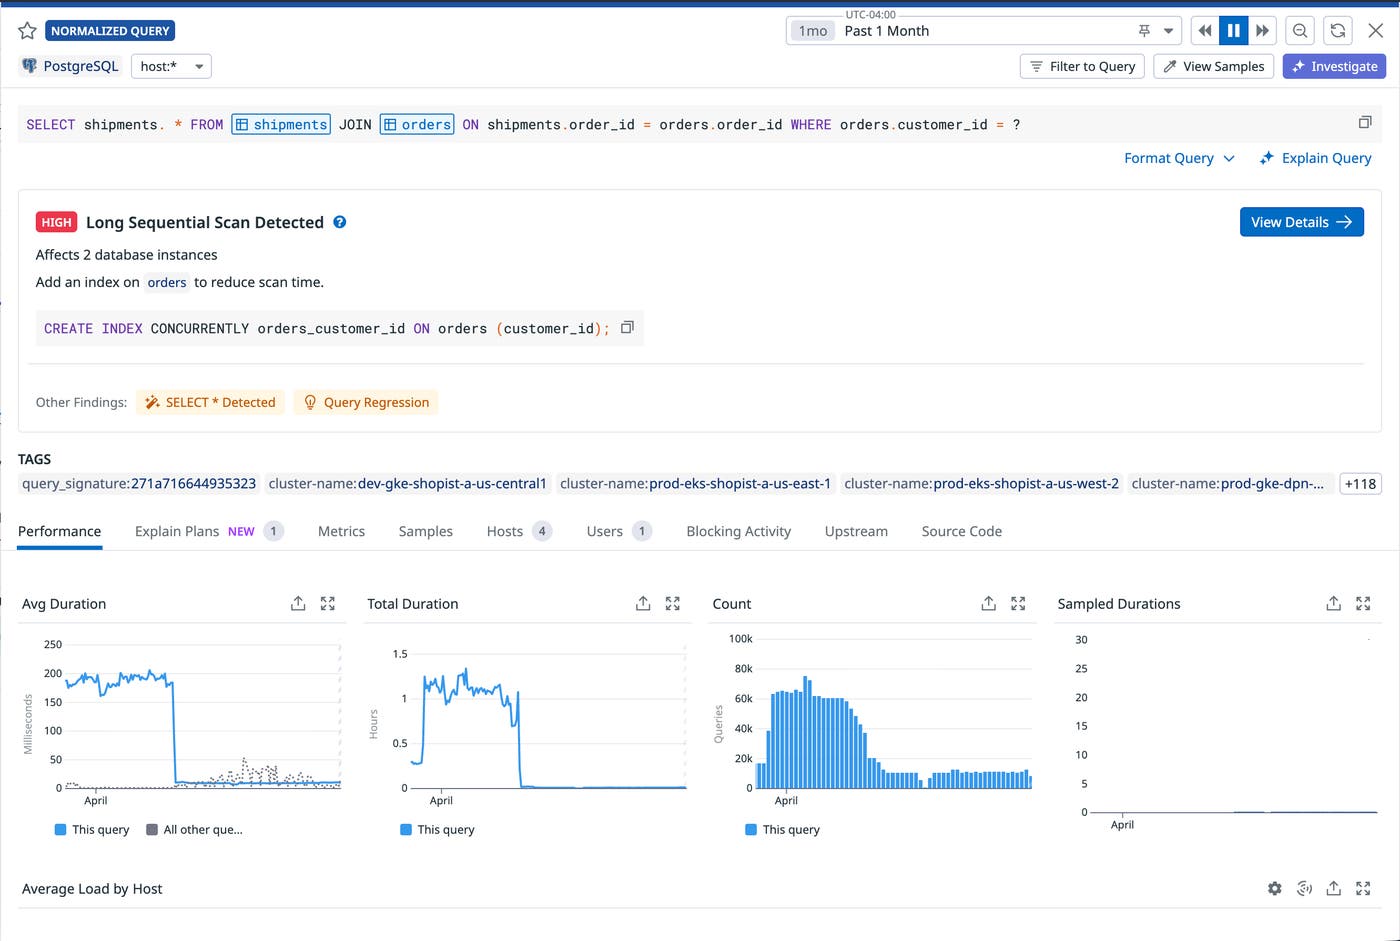
Rising query execution times are the clearest signal that database performance is degrading. Page loads that were once quick begin to lag, and longer execution times consume more resources. This in turn leads to blocking and timeouts in your application.
With Recommendations, DBM can automatically detect when a query performance has degraded. It then runs diagnostics to check for variations in workload, traffic, deployments, and schema, giving you a starting point for your investigation. You can also configure monitors to capture regressions based on your own rules.
Identifying a slow query is only part of the problem. Knowing whether to rewrite the query, change the schema, or modify application code requires understanding the impact each option will have on the database overall.
DBM provides built-in recommendations so that developers can act on query insights without having deep Postgres expertise. For each recommendation, DBM identifies where the bottleneck in query performance is coming from and provides a solution to resolve it. For example, for the query regression shown above, the screenshot below shows how DBM points to a long sequential scan as the cause. DBM also recommends adding an index to resolve the issue.
When application performance degrades, it’s not always clear whether the root cause is in the service layer or the database. Without a link between application behavior and database performance, developers end up switching between tools to find the culprit. This makes determining the source of an issue especially difficult for app developers without database expertise.
With Datadog Application Performance Monitoring (APM) and DBM, teams can trace performance issues from the application layer to their Supabase database by using end-to-end telemetry data. Starting from an impacted service or endpoint in APM, you can drill into the underlying Supabase queries. From there, DBM provides the query-level metrics and investigation context to identify what changed and why, without requiring you to switch tools.
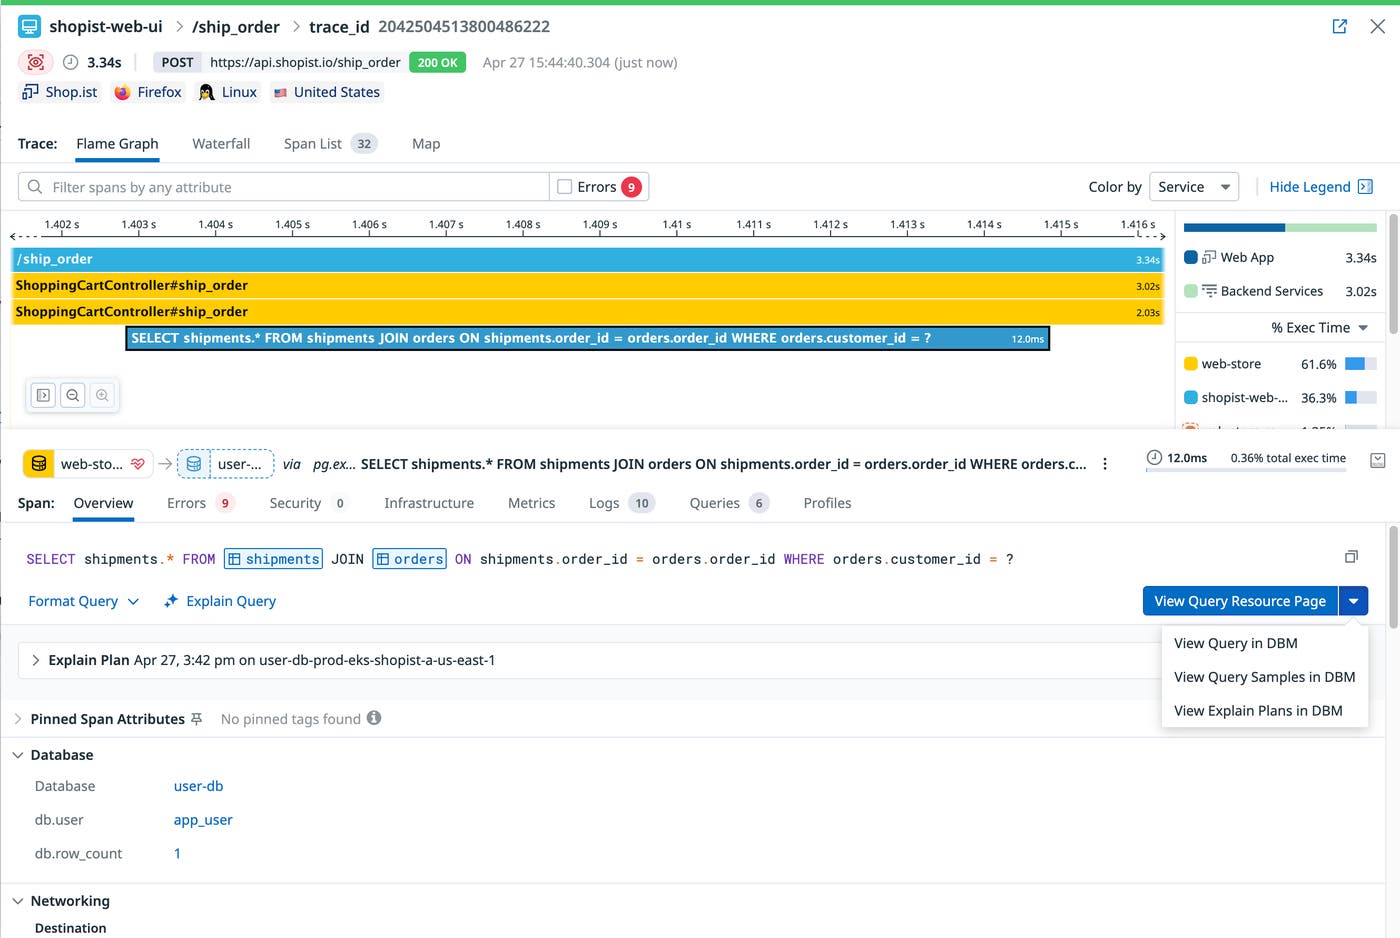
Database Monitoring for Supabase gives app developers, regardless of their Postgres experience, the tools to identify, diagnose, and resolve database performance issues. With APM and DBM connected, you can easily trace a slow request from the application layer to the query responsible for any issue. From there, built-in recommendations tell you what to fix to resolve the issue.
To get started, visit the docs on setting up Database Monitoring for Supabase. And if you’re new to Datadog, you can sign up for a 14-day free trial.
此内容由惯性聚合(RSS阅读器)自动聚合整理,仅供阅读参考。 原文来自 — 版权归原作者所有。