








Even in an era where container, serverless, and cloud-computing technologies garner considerable attention, many companies continue to run a sizeable share of their mission-critical applications on highly resilient, fault-tolerant systems such as IBM AIX on Power-series hardware. AIX, one of the most popular Unix-based operating systems, is trusted by large companies that process critical data such as medical health records and banking transactions. As such, AIX tends to power large, complex systems that require accurate, real-time performance monitoring.
We are proud to announce our release of the Datadog Unix Agent for AIX as generally available. The Agent is written with AIX in mind and, similar to our Agents for other operating systems, is completely open source.
The Agent currently supports the following AIX versions for the GA release:
Our new Agent installer ships in an AIX-native .BFF file format, so there’s no need for fetching and fiddling with multiple scripts and components. Installation is as easy as navigating to our Agent download page within Datadog and running the one-line install script.
Once installed, the Agent runs as a daemon, which you can control using the default Subsystem Resource Controller (SRC) commands that you are already familiar with. Obtaining Agent information and submitting flares for troubleshooting also work the same as in other operating systems, so if you’ve used the Datadog Agent on Linux or Windows, you should feel right at home.
Additionally, we recognize that security is of the utmost importance for our customers on AIX, so the agent runs as a separate (non-root) user with options to enable privileged access within certain integrations should you need it.
Monitoring system-level metrics forms the basis for any infrastructure monitoring strategy. The Agent automatically collects several detailed metrics in real time from your AIX servers, which you can use for visualization, correlation, and intelligent alerting in Datadog:
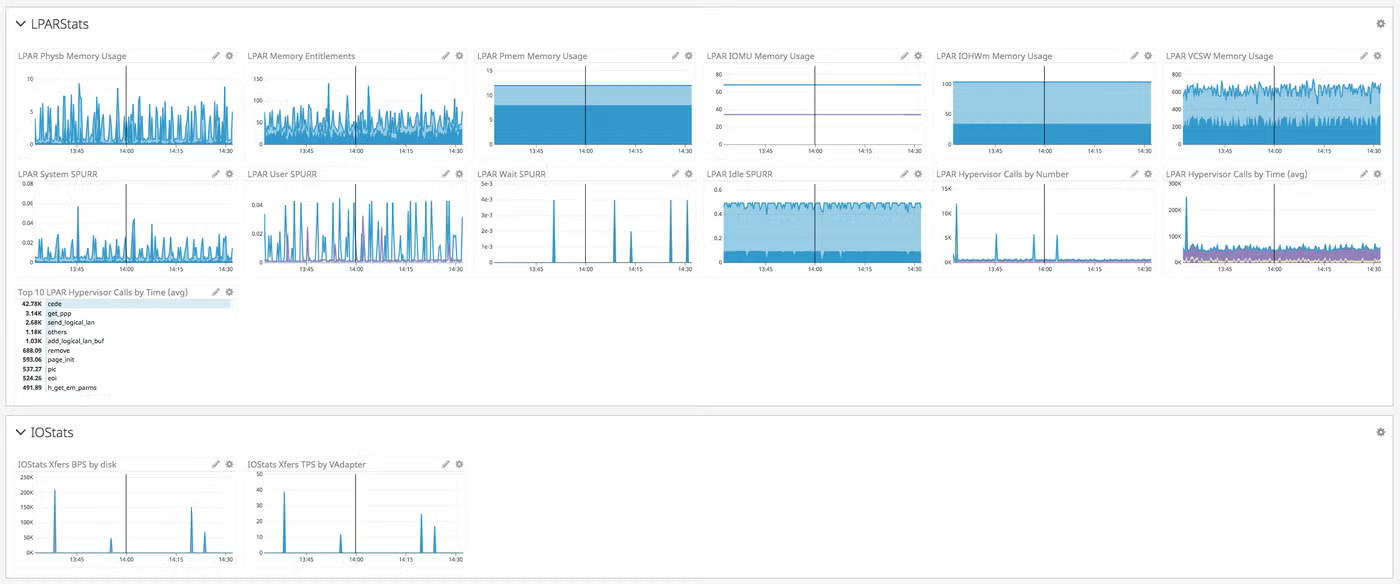
Datadog’s support for monitoring AIX extends beyond those core system-level metrics, so you can collect metrics from lparstat and iostat; monitor individual AIX processes; gather data from custom integrations running on AIX; and submit custom metrics via DogStatsD.
The iostat tool provides I/O data on physical and virtual devices. The Agent uses this data to report metrics on disk read/writes, xfers (transfers), queue times, and more.
Similarly, the lparstat tool provides information and usage statistics on the Logical Partition (LPAR) and hypervisor. The Agent collects useful data reported from this tool, such as processor utilization metrics from the Scaled Processor Utilization Resource Register (SPURR).
The Datadog process check, which ships with the Datadog Agent, allows you to collect resource usage metrics for specific running processes. This check can be used alongside a process monitor to set up alerts based on process uptime.
If you’re running custom applications on AIX that you need to monitor, it’s easy to write your own Python-based integration checks (or port ones already written for other operating systems) for the AIX Agent. Refer to our developer guide to get started with your own custom checks.
You can also collect and submit custom metrics from your applications via beta support for Dogstatsd in the AIX Agent. Once enabled, Dogstatsd will listen on a predefined UDP port for any custom metrics that you send to it.
We’d love for you to try the Unix Agent for AIX and provide us with your feedback. We look forward to increasing our integration support on AIX, starting with metrics from the IBM Hardware Management Console (HMC).
If you’re already using Datadog, you can visit our documentation and start using the new AIX Agent today. If you don’t yet have a Datadog account, you can get started right away with a 14-day free trial.
此内容由惯性聚合(RSS阅读器)自动聚合整理,仅供阅读参考。 原文来自 — 版权归原作者所有。