






As organizations continue to heavily invest in AI and build more agentic workflows, their telemetry data volumes can surge quickly, and the associated costs can become unpredictable. To regain control of their data, many AI-forward teams are turning to high-throughput, low-latency pipelines to collect and route data to tools such as OpenTelemetry (OTel) and ClickHouse.
But these self-hosted solutions come with drawbacks. While the OTel Collector standardizes how telemetry data is collected and formatted, it lacks the ability to route data flexibly or to enrich, transform, and monitor your data pipelines.
Using Datadog’s vendor-agnostic Observability Pipelines, you can easily collect logs and metrics from the OTel Collector, transform and enrich data, and route them to both ClickHouse and your preferred SIEM.
In this post, we’ll show you how to:
Collect OpenTelemetry data and flexibly route to ClickHouse, Datadog, and your preferred SIEM
Parse, transform, and enrich your telemetry data before it reaches ClickHouse
Monitor your data pipeline’s health and performance
Teams standardizing on OpenTelemetry for vendor-neutral telemetry collection need a reliable and high-performance way to get that data into ClickHouse and their preferred SIEMs. While OTel provides an open source schema and export method, using OTel alone doesn’t give you full data-collection flexibility, which is often required for teams operating in hybrid or multi-cloud environments. Additionally, most security sources do not natively emit telemetry data in the OpenTelemetry Protocol (OTLP) format. This security data often needs to be collected over syslog, HTTP, or through proprietary aggregators. Without the ability to standardize telemetry pipelines in a unified format, teams end up managing separate collection and routing for OTel and non-OTel sources.
To address this issue, you can use Observability Pipelines to collect telemetry data from OTel and third-party sources before routing it to your preferred destinations. Observability Pipelines can be deployed in any environment, cloud provider, and deployment model. This includes different infrastructure types like Kubernetes, VMs, or containers, or different locations like on-premises infrastructure or cloud platforms like AWS, Microsoft Azure, or Google Cloud.
Observability Pipelines also gives you flexibility about the telemetry data source. It natively collects logs and metrics from the OTel Collector by using the OTLP format over either gRPC or HTTP. Using Observability Pipelines, you also can rely on either Splunk’s distribution or Datadog’s Distribution of the OTel Collector as a source.
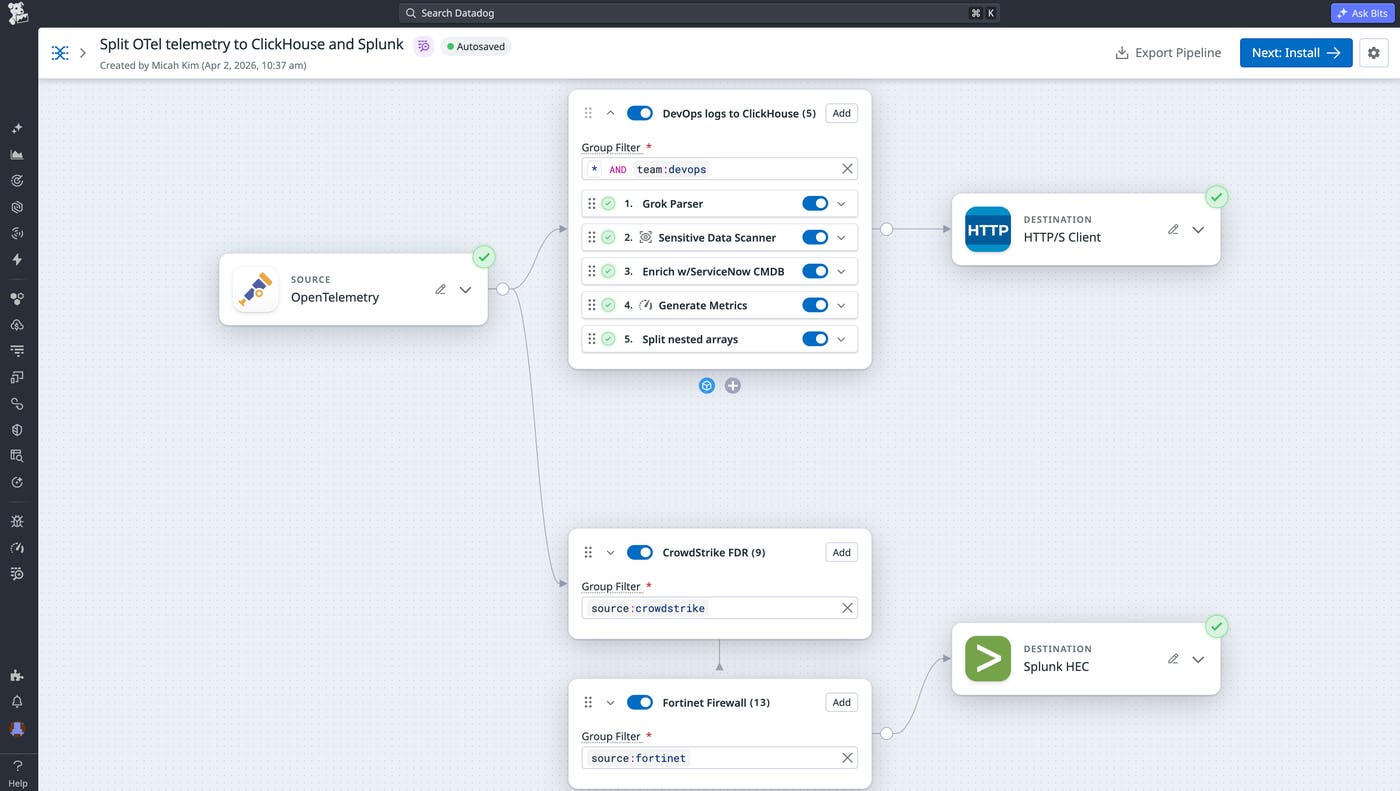
To illustrate how you can use Observability Pipelines for flexible routing, let’s say you’re a platform engineer at an AI-native company where agentic workflows are generating terabytes of logs daily. To begin with, you use Observability Pipelines to manage data routing to ClickHouse and Splunk. Once data is collected from OTel, you can also add Packs for both Cisco ASA and Fortinet Firewall logs to reduce the volume going to Splunk. Additionally, you can add application dependency information from ServiceNow CMDB to your custom application logs routing to ClickHouse.
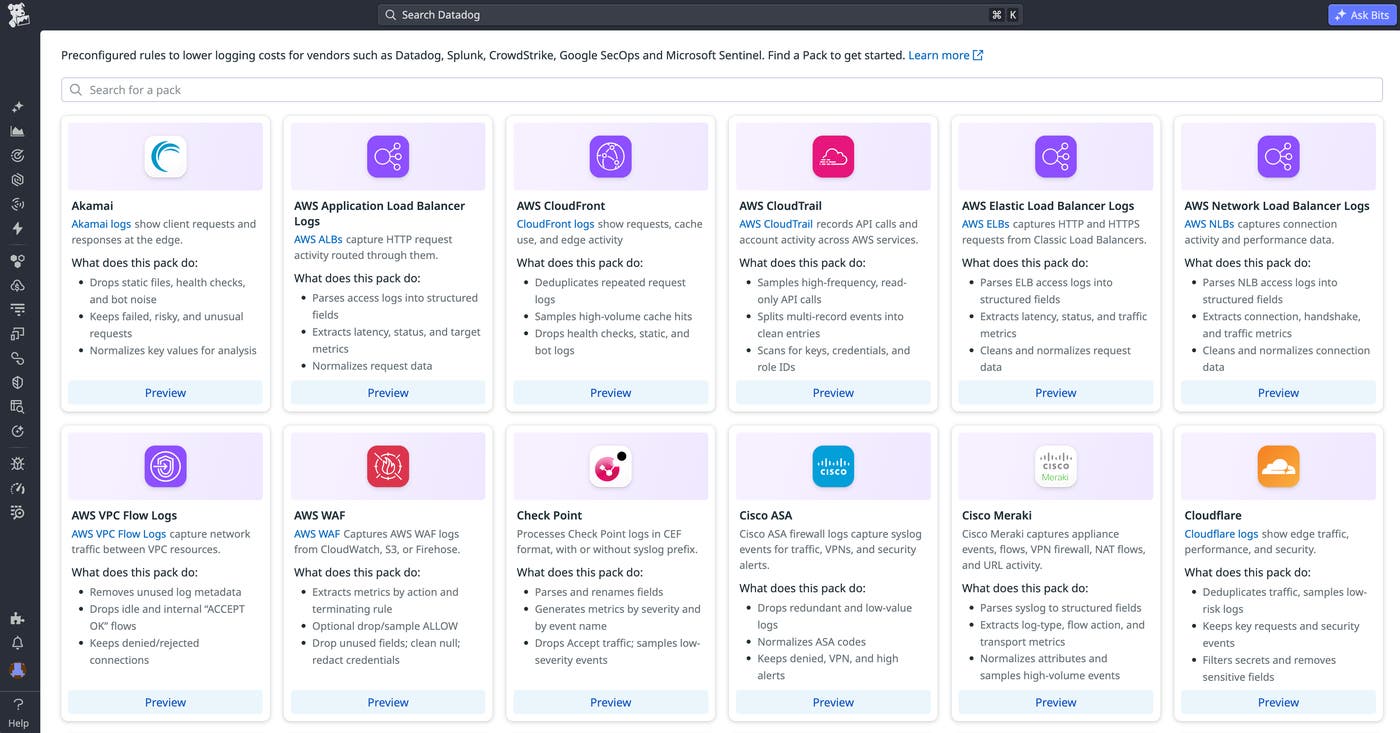
For other vendor-specific log sources like Cloudflare, Okta, Akamai CDN, and more, you can add Packs to your pipeline with one click to automatically parse and reduce volume.
Many teams have multiple observability tools and vendors, each with its own agents, formats, and costs. ClickHouse can consolidate that telemetry into a single, fast query layer, but its performance depends on the data quality. The OTel Collector handles basic processing, and ClickStack streamlines the OTel data to ClickHouse path with optimized schemas and the HyperDX UI for querying.
However, none of these tools handle on-stream enrichment and normalization at scale. These features are especially important for teams running agentic workflows, where log formats vary across model layers, tool calls, and custom applications. This is why standardization is critical before data hits ClickHouse.
Observability Pipelines lets teams shape data however desired to help ensure that logs arriving in ClickHouse can be analyzed quickly, without requiring manual configuration. For example, using Observability Pipelines and Reference Tables together, you can centrally enrich logs with context from dynamically updating datasets before sending to ClickHouse. You can also automatically append information from cloud-hosted integrations like ownership/dependency relationships from ServiceNow CMDB, anomaly scores from Databricks, threat intelligence from Snowflake, and customer profiles from Amazon S3 before logs leave your environment. This eliminates the need to manually maintain local CSVs.
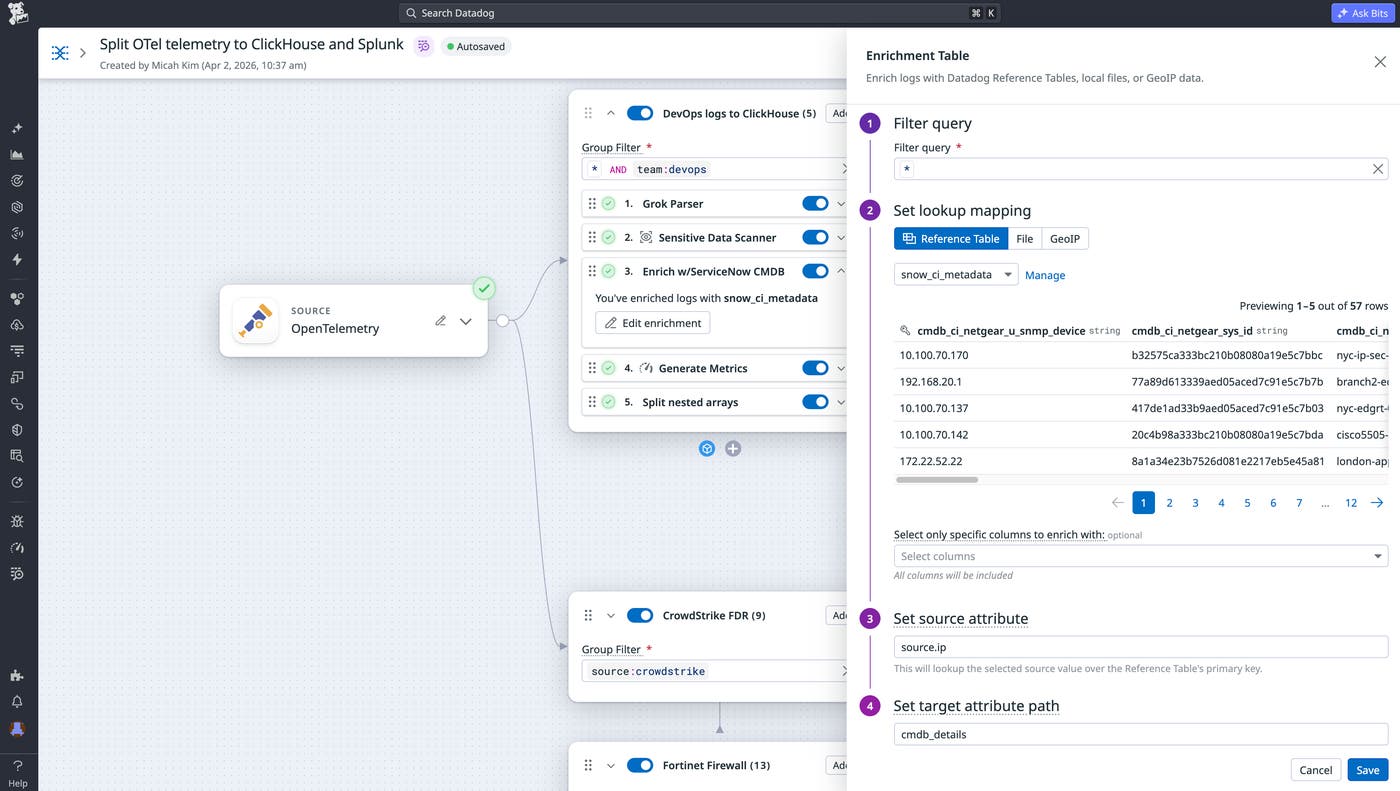
Next, you can maintain compliance by redacting sensitive data on premises via the Sensitive Data Scanner processor. With more than 180 built-in detection rules, your team can hide personally identifiable information (PII) before it leaves your environment.
Observability Pipelines also lets you apply custom data formats like internal applications or systems. For this purpose, Observability Pipelines supports Grok parsing with out-of-the-box parsing rules, JSON parsing, and XML parsing.
Finally, you can also control the shape of your metrics before they reach ClickHouse. While metrics are typically more affordable for long-term analytics compared to logs, the costs and noise from high metric cardinality and volumes may force you to make trade-offs on how to slice and dice. The Custom Processor lets you run your own code within the pipeline by using the open source standard Vector Remap Language (VRL). For example, you can add or manipulate tags to enforce consistent metrics structures before data reaches ClickHouse.
Once you have data routing to your destinations, teams need insight into the pipeline’s performance, reliability, and health. However, keeping that insight available across multiple collectors, formats, and routes can be hard. This is especially important for teams running with unpredictable, AI-driven systems, where log volumes can spike suddenly as workflows scale.
Observability Pipelines provides built-in monitors and an out-of-the-box dashboard to help you track your pipelines, troubleshoot issues, and verify that data is flowing reliably. The Observability Pipelines Overview dashboard, shown below, gives you a full view of your pipeline throughput, component health, buffer metrics, and troubleshooting indicators.
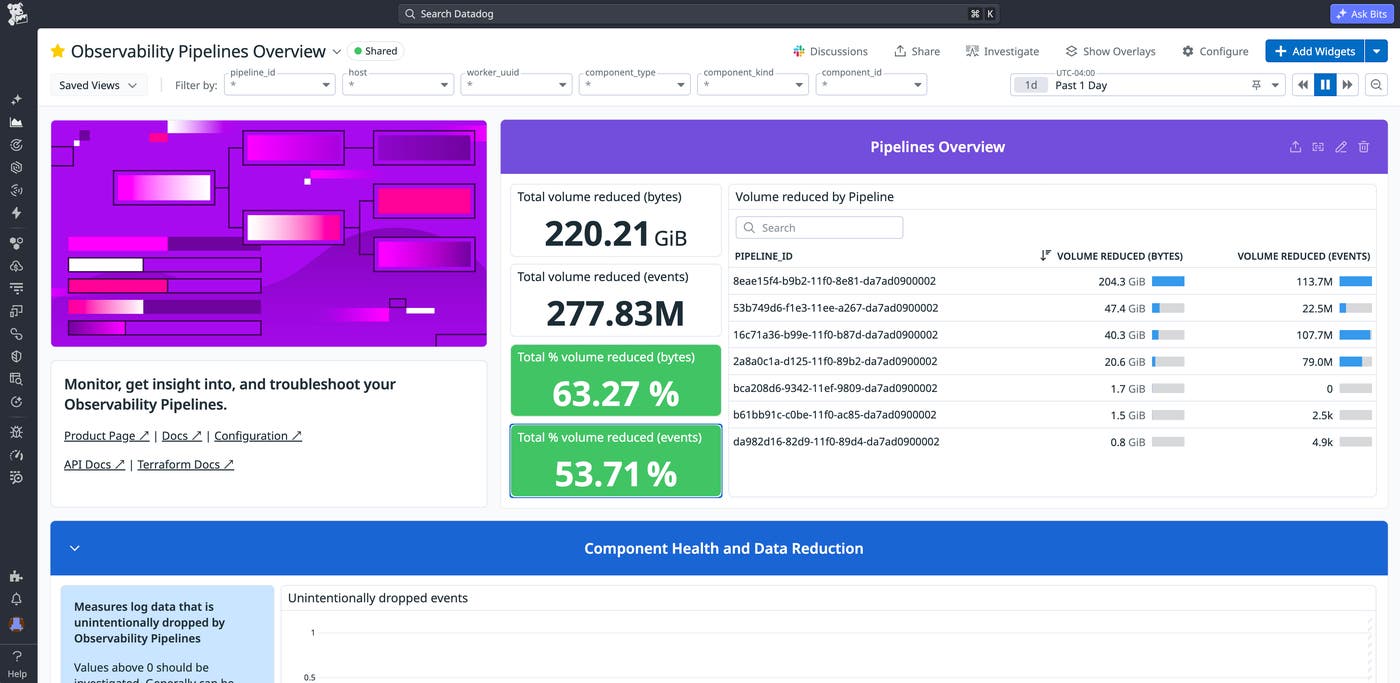
Observability Pipelines publishes diagnostic metrics across four categories: host, process, components, and buffering. Key metrics are shown in the following table:
| Metric | What it tells you |
|---|---|
pipelines.component_received_events_total pipelines.component_received_bytes_total pipelines.component_sent_events_total pipelines.component_sent_bytes_total | Events/bytes flowing in and out of each component. Compare these per pipeline to see how much data is being reduced or routed at each step. |
pipelines.component_discarded_events_total | Distinguishes intentional drops (intentional:true) from filtering, quotas, and sampling versus unintentional drops (intentional:false) from errors or backpressure. Unintentional drops should be investigated immediately. |
pipelines.component_errors_total | The number of errors encountered by the component. |
pipelines.utilization | Component activity from 0 to 1. A component at 1.0 is fully saturated and likely creating backpressure, which can cause events to be dropped. |
pipelines.cpu_usage_seconds_total | CPU usage per worker. Use this to determine when to scale workers before they become a bottleneck. |
pipelines.buffer_size_events / pipelines.buffer_size_bytes | Events and bytes sitting in a destination’s buffer. If these values are climbing, the destination (such as ClickHouse or your SIEM) is likely slow or unavailable. |
Alongside metrics and the dashboard, Observability Pipelines includes prebuilt monitor templates that your teams can set up such as:
Components dropping data: Alerts on unexpectedly discarded events to catch data loss early
Components producing errors: Tracks errors from processing data in unexpected formats or interacting with external resources
High CPU usage: Monitors CPU per core so that you can scale workers before they bottleneck
High memory usage: Tracks memory to identify when workers need more resources
Quota usage: Monitors individual quota utilization so that you can adjust limits before critical data is dropped
With the dashboards, metrics, and out-of-the-box monitors, your team can proactively detect pipeline issues like backpressure from ClickHouse, spikes in dropped events, or CPU utilization before they impact downstream destinations.
Whether you’re splitting data between ClickHouse and your preferred SIEM or running a full ClickStack deployment, Observability Pipelines gives you lightweight, native processing to control where your telemetry data goes. It enables you to parse, enrich, and route telemetry data at scale from any cloud, region, or deployment model. To learn more, check out the documentation for Observability Pipelines. Also see specific information on collecting logs and metrics from OpenTelemetry and on routing telemetry data to ClickHouse.
For teams that want to keep the full Datadog experience while storing logs in their own infrastructure, Datadog Bring Your Own Cloud (BYOC) Logs lets you ingest, process, and search logs at petabyte scale in any region. Observability Pipelines integrates directly with BYOC Logs for enrichment and parsing before data is ingested. If you don’t already have a Datadog account, you can sign up for a 14-day free trial to get started.
此内容由惯性聚合(RSS阅读器)自动聚合整理,仅供阅读参考。 原文来自 — 版权归原作者所有。