


Jee Rim
When you want to spot hosts that are behaving differently from others, the outlier algorithms MAD and DBSCAN work well in most situations. You can tune the behavior of the algorithms by adjusting the parameters based on the expected variability of the data. In certain situations, however, you might be puzzled by your algorithm flagging outliers in a group of metrics that have very similar values.
For example, comparing usable memory across a group of Cassandra nodes using the Median Absolute Deviation (MAD) outlier algorithm with tolerance 3 and pct 30:
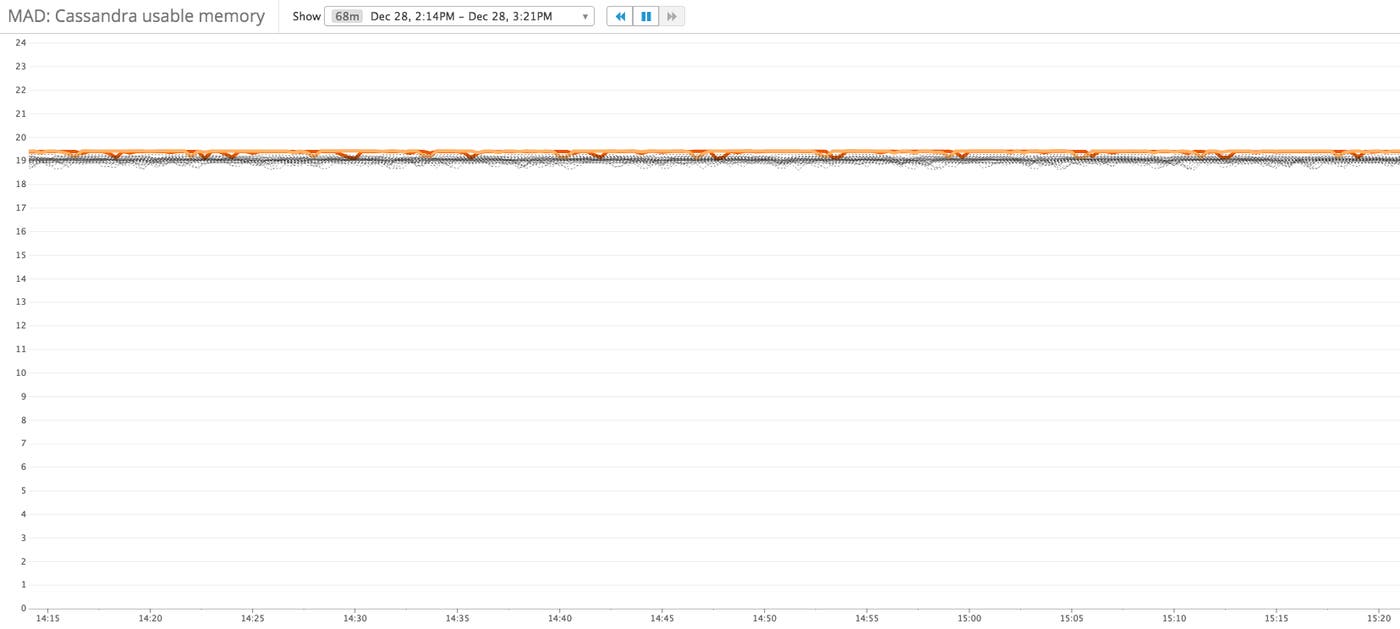
Two of the hosts are identified as outliers even though their metric values seem very similar to those of the other hosts. Increasing the tolerance or the pct parameter removes the outliers, but it certainly seems odd that there was an outlier among such tightly grouped hosts in the first place.
This is because the MAD algorithm is designed to find outliers independent of the overall scale of the metrics. If we shift the origin of the y-axis to around 18 GB, it’s easy to see why those two hosts are outliers. But this difference is hardly noticeable at the original scale!
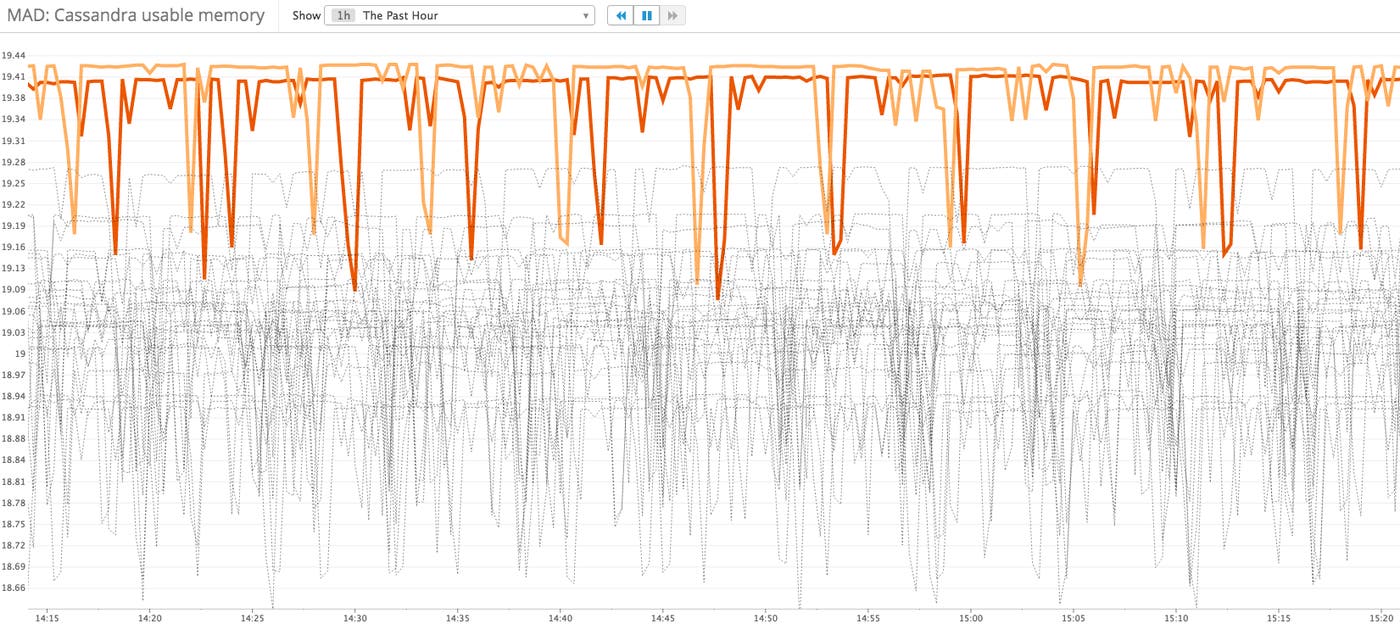
There are situations where you want to be notified of the absolute deviation of a host regardless of the overall scale of the metrics. For instance, the system cache read ratio for Kafka nodes is an important metric that can be considered equivalent to a database’s cache-hit ratio. In healthy deployments, the cache read ratio rarely drops below 80 percent, but a host with this metric at 96 percent would rightly be considered an outlier if the other hosts were all showing 99 to 100 percent. In this case, the DBSCAN or MAD algorithms are the right choices, but consider shifting the origin of the y-axis in your graphs so that the deviation can be easily identified.
However, if the dispersion in your metrics is more meaningful in the context of the overall magnitude of the metrics, try switching to one of our new scaled outlier algorithms, ScaledMAD or ScaledDBSCAN. Here is a good post about meaningful differences and overall scale in timeseries data.
The ScaledMAD algorithm considers the relative scales of the divergence and the median of the data. In most cases, it will behave the same as the MAD algorithm. However, when the dispersion of the data set shrinks in comparison to the median, the distance threshold for determining whether a point is an outlier becomes a proportion of the median.
Following the example above, unlike MAD the ScaledMAD algorithm will not identify any of the hosts as an outlier since the disparity between the hosts is very small relative to the overall magnitude of the metrics. Here MAD is on the left, and ScaledMAD is on the right:

And here is the same timeseries, with the y-axis adjusted to expand the area of interest:

Similar considerations apply to the density-based spatial clustering of applications with noise (DBSCAN) and ScaledDBSCAN algorithms.
As for the MAD algorithm, in the DBSCAN algorithm the distance threshold that determines whether the metrics of two hosts are close is independent of the overall scale of the metrics. This can lead to outliers within a closely clustered group of metrics when the overall scale of the metrics is large compared to the median distance between hosts and the median series.
The ScaledDBSCAN algorithm scales the initial distance threshold according to the relative magnitudes of the median series and the hosts’ distances to the median series. In most situations, it will behave the same as regular DBSCAN does. However, when the median series is large compared to the distances to the median series, assessing whether two timeseries are close will depend on the scale of the median series.
Here is a comparison of DBSCAN and ScaledDBSCAN with tolerances of 3 on field data size in a group of Elasticsearch nodes: none of the hosts are identified as outliers under the ScaledDBSCAN algorithm since the distances between the hosts and the median series are very small relative to the overall magnitude of the metrics. DBSCAN is applied to the graph on the left, and ScaledDBSCAN is on the right:

And here is the same timeseries, with the y-axis adjusted to expand the area of interest:

These outlier detection improvements are just some of the many algorithmic monitoring features we’re working on. Our data science and data engineering teams are constantly adding new algorithmic graphing and alerting capabilities. Keep an eye out for new features and improvements as we roll out new tools and improve existing ones to make your monitoring as dynamic as your infrastructure.
此内容由惯性聚合(RSS阅读器)自动聚合整理,仅供阅读参考。 原文来自 — 版权归原作者所有。