


惯性聚合 高效追踪和阅读你感兴趣的博客、新闻、科技资讯
阅读原文 在惯性聚合中打开

推荐订阅源

U
Unit 42
博客园 - 司徒正美
博客园 - 三生石上(FineUI控件)
博客园_首页
IT之家
IT之家
The Cloudflare Blog
奇客Solidot–传递最新科技情报
奇客Solidot–传递最新科技情报
酷 壳 – CoolShell
酷 壳 – CoolShell
爱范儿
爱范儿
让小产品的独立变现更简单 - ezindie.com
Y
Y Combinator Blog
A
About on SuperTechFans
Microsoft Azure Blog
美团技术团队
S
SegmentFault 最新的问题
T
Tailwind CSS Blog
freeCodeCamp Programming Tutorials: Python, JavaScript, Git & More
M
MIT News - Artificial intelligence
WordPress大学
WordPress大学
B
Blog RSS Feed
Cyber Security Advisories - MS-ISAC
博客园 - 【当耐特】
小众软件
小众软件
有赞技术团队
有赞技术团队

Datadog | The Monitor blog

Introducing our open source AI-native SAST Instrument and monitor Boomi integration flows with OpenTelemetry and Datadog Not all index scans are equal: How we cut query latency by over 99% Platform engineering metrics: What to measure and what to ignore Integrate Recorded Future threat intelligence with Datadog Cloud SIEM CI/CD security: threat modeling using a MITRE-style threat matrix CI/CD security: How to secure your GitHub ecosystem Ingress NGINX is EOL: A practical guide for migrating to Kubernetes Gateway API Operating agentic AI with Amazon Bedrock AgentCore and Datadog LLM Observability: Lessons from NTT DATA Introducing the Datadog Code Security MCP Capture and analyze custom heatmaps in Session Replay Understand session replays faster with AI summaries and smart chapters Monitor ClickHouse query performance with Datadog Database Monitoring How we designed empathetic alert sounds for on-call engineers Search and act across Datadog to resolve issues faster with Bits Assistant Measure the business impact of every product change with Datadog Experiments Analyzing round trip query latency Configuring JavaScript caches for better performance Introducing Bits AI Dev Agent for Code Security Datadog achieves ISO 42001 certification for responsible AI Monitor Nutanix clusters, hosts, and VMs with Datadog Monitor Juniper Mist in Datadog A new Host Map for modern infrastructure Annotate traces to improve LLM quality with Datadog LLM Observability What’s new in Cloud SIEM: AI-powered investigations, enhanced threat intelligence, and scalable security operations Explore Kubernetes with native OpenTelemetry data Monitor Oracle Fusion Cloud Applications with Datadog Announcing the Datadog Terraform provider v4.0.0 Scaling Kubernetes workloads on custom metrics How to design cloud environments for AI-powered threat analysis
Supervisor monitors your processes. Datadog monitors Supe...
Isaac Sadaqah · 2015-07-02 · via Datadog | The Monitor blog
Isaac Sadaqah

Isaac Sadaqah

Supervisor is a popular tool for managing an application’s long-running processes. Supervisor starts processes, monitors, and restarts them when they die. With tens, or even hundreds, of supervisord instances running in production, each supervising groups of processes, it becomes difficult to track all processes or to identify problematic ones.

With our supervisord integration, all managed process counts, uptimes, and states are automatically sent to Datadog. And in Datadog you can set up dashboards and alerts for Supervisor across your infrastructure or narrow your monitoring to specific Supervisor servers, depending on your needs.

Monitor Supervisor processes in Datadog

Processes controlled by Supervisor have a variety of basic states, such as stopped, starting, running, exited, fatal, and unknown.

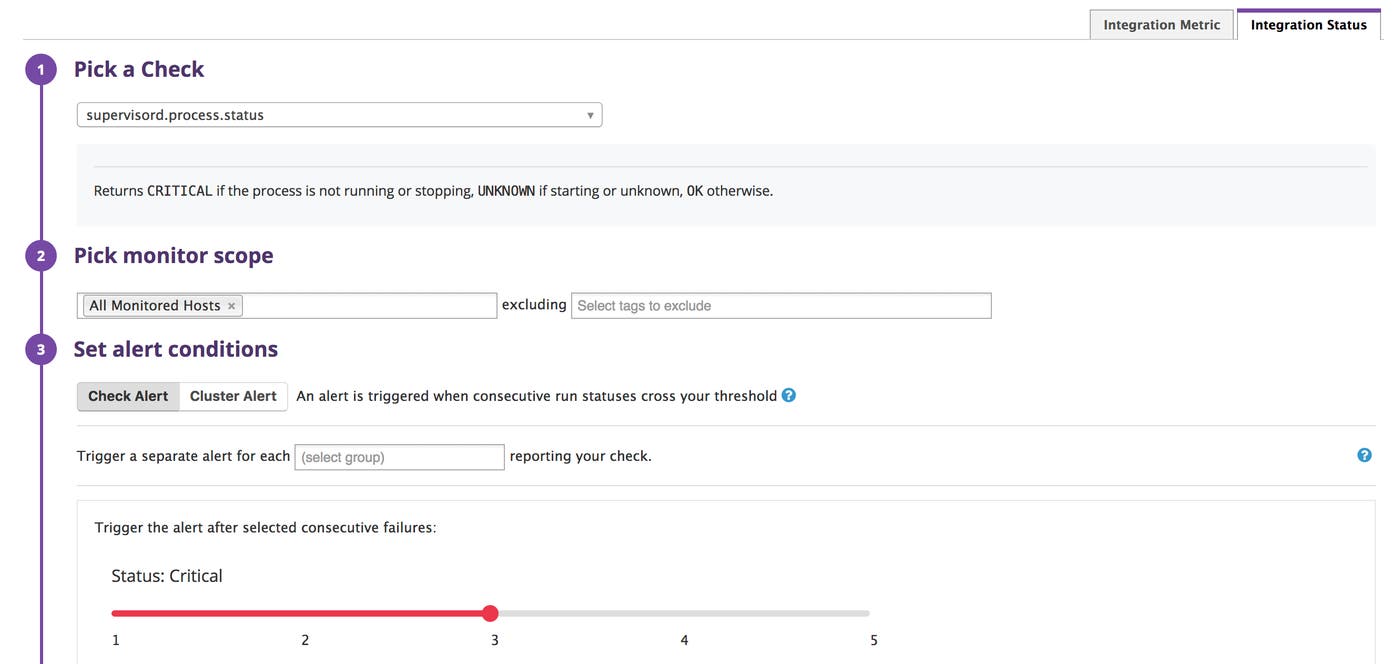
You can set up a customizable check to alert you when certain processes enter a critical state by creating a new monitor for your account’s supervisord integration and clicking on the Integration Status tab.

monitor supervisor
monitor supervisor

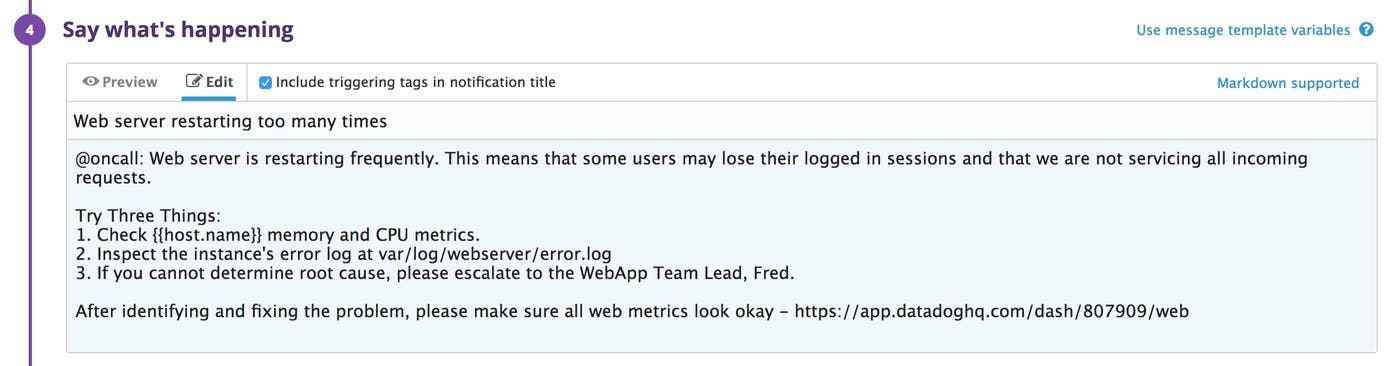
In the monitor message, you can provide context, such as the affected host name, which is helpful for the person receiving the alert.
monitor supervisor

To learn more about the different monitor types, you can read our monitoring guide.

Pinpoint problems

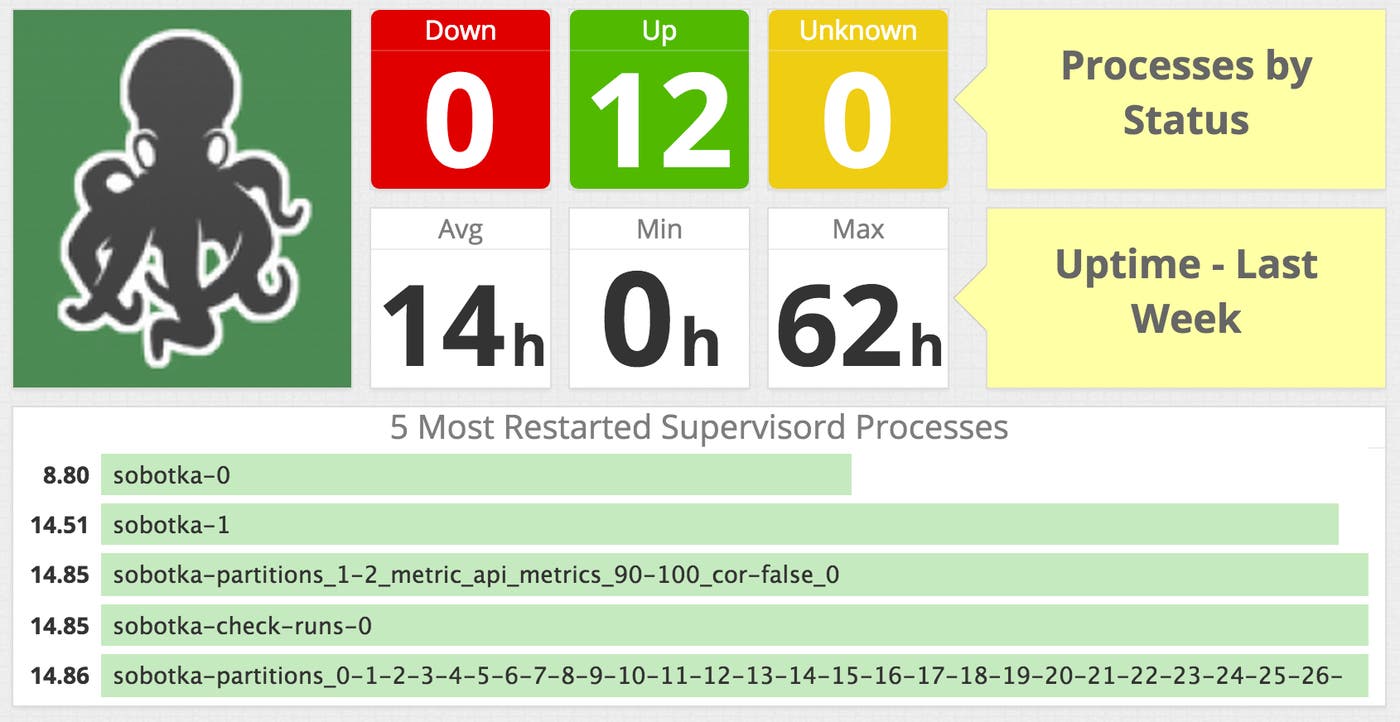
In addition to alerting on failing processes, you can build a screenboard that shows the overall status of your Supervisor deployment. The example below shows the number of processes by their status, as well as their uptime statistics. It also lists processes by their uptime, with the shortest uptimes first. This can help identify which processes are experiencing problems and need your attention.
monitor supervisor

Track supervisord itself

Besides being able to monitor Supervisor managed processes, you can also monitor Supervisor’s availability with this integration. By monitoring Supervisor’s availability, you know that you can rely on Supervisor to restart your processes. While supervisord is a well-tested app, it is not infallible so when an issue presents itself in supervisord, you’ll be able to get alerted in Datadog.

Do you use Supervisor? Try a free 14-day trial of Datadog to see how much more easily you can monitor your app’s performance.