


惯性聚合 高效追踪和阅读你感兴趣的博客、新闻、科技资讯
阅读原文 在惯性聚合中打开

推荐订阅源

P
Proofpoint News Feed
WordPress大学
WordPress大学
Help Net Security
Help Net Security
Jina AI
Jina AI
Security Latest
Security Latest
Y
Y Combinator Blog
Project Zero
Project Zero
freeCodeCamp Programming Tutorials: Python, JavaScript, Git & More
GbyAI
GbyAI
Know Your Adversary
Know Your Adversary
Threat Intelligence Blog | Flashpoint
NISL@THU
NISL@THU
Cisco Talos Blog
Cisco Talos Blog
博客园 - 司徒正美
MyScale Blog
MyScale Blog
Cyberwarzone
Cyberwarzone
D
Docker
T
The Blog of Author Tim Ferriss
G
Google Developers Blog
C
CERT Recently Published Vulnerability Notes
B
Blog
L
LangChain Blog
Exploit-DB.com RSS Feed
SecWiki News
SecWiki News
The Hacker News
The Hacker News
C
Check Point Blog
L
Lohrmann on Cybersecurity
V2EX - 技术
V2EX - 技术
S
Securelist
T
Threat Research - Cisco Blogs
Stack Overflow Blog
Stack Overflow Blog
TaoSecurity Blog
TaoSecurity Blog
云风的 BLOG
云风的 BLOG
Latest news
Latest news
人人都是产品经理
人人都是产品经理
L
LINUX DO - 最新话题
Application and Cybersecurity Blog
The Register - Security
Webroot Blog
Webroot Blog
Simon Willison's Weblog
奇客Solidot–传递最新科技情报
奇客Solidot–传递最新科技情报
Microsoft Security Blog
AWS News Blog
AWS News Blog
C
Cybersecurity and Infrastructure Security Agency CISA
cs.AI updates on arXiv.org
小众软件
小众软件
T
Tailwind CSS Blog
cs.CL updates on arXiv.org
宝玉的分享
宝玉的分享
O
OpenAI News

Datadog | The Monitor blog

Introducing our open source AI-native SAST Instrument and monitor Boomi integration flows with OpenTelemetry and Datadog Not all index scans are equal: How we cut query latency by over 99% Platform engineering metrics: What to measure and what to ignore Integrate Recorded Future threat intelligence with Datadog Cloud SIEM CI/CD security: threat modeling using a MITRE-style threat matrix CI/CD security: How to secure your GitHub ecosystem Ingress NGINX is EOL: A practical guide for migrating to Kubernetes Gateway API Operating agentic AI with Amazon Bedrock AgentCore and Datadog LLM Observability: Lessons from NTT DATA Introducing the Datadog Code Security MCP Capture and analyze custom heatmaps in Session Replay Understand session replays faster with AI summaries and smart chapters Monitor ClickHouse query performance with Datadog Database Monitoring How we designed empathetic alert sounds for on-call engineers Search and act across Datadog to resolve issues faster with Bits Assistant Measure the business impact of every product change with Datadog Experiments Analyzing round trip query latency Configuring JavaScript caches for better performance Introducing Bits AI Dev Agent for Code Security Datadog achieves ISO 42001 certification for responsible AI Monitor Nutanix clusters, hosts, and VMs with Datadog Monitor Juniper Mist in Datadog A new Host Map for modern infrastructure Annotate traces to improve LLM quality with Datadog LLM Observability What’s new in Cloud SIEM: AI-powered investigations, enhanced threat intelligence, and scalable security operations Explore Kubernetes with native OpenTelemetry data Monitor Oracle Fusion Cloud Applications with Datadog Announcing the Datadog Terraform provider v4.0.0 Scaling Kubernetes workloads on custom metrics How to design cloud environments for AI-powered threat analysis Monitor Aruba Central in Datadog How we centralize and remediate risks with Datadog Case Management Accelerate incident response with Datadog and ServiceNow Monitor your application and network load balancer logs Understanding Karpenter architecture for Kubernetes autoscaling Tools for collecting metrics and logs from Karpenter Monitor Karpenter with Datadog What your product data is actually saying Key metrics for monitoring Karpenter Securing Datadog’s platform in the AI age: The role of observability data Four ways engineering teams use the Datadog MCP Server to power AI agents Approaching your observability migration with the right mindset Meet the new Bits AI SRE: Deeper reasoning, twice as fast Key learnings from the 2026 State of DevSecOps study Use plain English to query your multi-cloud infrastructure in Resource Catalog Simplifying troubleshooting across the user journey with Datadog Synthetic Monitoring Protect your OCI resources with Datadog Cloud Security This Month in Datadog - February 2026 Amazon EC2 security: How misconfigured and public AMIs expand your cloud attack surface Enable end-to-end visibility into your Java apps with a single command Measure and improve mobile app startup performance with Datadog RUM Evaluating our AI Guard application to improve quality and control cost Identify untested code across every level of your codebase Make use of guardrail metrics and stop babysitting your releases Monitor Versa Networks SD-WAN performance in Datadog Improve performance and reliability with APM Recommendations Remediate transitive vulnerabilities faster with Datadog Software Composition Analysis Generate audit-ready vulnerability and compliance reports with Datadog Sheets Monitor Fortinet FortiManager performance in Datadog Improve test coverage across codebases with Datadog Code Coverage Move fast, don’t break things: Consistent testing standards at scale Enrich logs with ServiceNow CMDB context before routing to any SIEM or logging tool Monitor Lustre with Datadog Make faster, better product decisions with Datadog Product Analytics Surface and remediate runtime posture issues with Workload Protection Findings Protect agentic AI applications with Datadog AI Guard How to optimize JavaScript code with CSS Trace Google Pub/Sub workloads in Cloud Run with Datadog Detect human names in logs with ML in Sensitive Data Scanner How we cut our NLQ agent debugging time from hours to minutes with LLM Observability Debug PostgreSQL query latency faster with EXPLAIN ANALYZE in Datadog Database Monitoring Datadog acquires Propolis Unify and correlate frontend and backend data with retention filters Scale compliance across global frameworks with Datadog Cloud Security Monitor Arista VeloCloud SD-WAN performance with Datadog Building reliable dashboard agents with Datadog LLM Observability Simplify log collection and aggregation for MSSPs with Datadog Observability Pipelines Mitigation for Node.js denial-of-service vulnerability affecting Datadog APM Automate flaky test fixes with the Bits AI Dev Agent and Test Optimization How we built an AI SRE agent that investigates like a team of engineers Datadog integrations 2025 recap: Observability for AI, security, and hybrid cloud Design effective executive dashboards with Datadog Implement dbt data quality checks with dbt-expectations Bring faster visibility into AWS Lambda functions with remote instrumentation Troubleshoot faster with the GitLab Source Code integration in Datadog How Cambia Health Solutions saved $30,000 monthly with Cloud Cost Management and the Datadog Resource Catalog Normalize any logs for Cloud SIEM with Datadog's OCSF processor Optimizing Datadog at scale: Cost-efficient observability at Zendesk Detect, diagnose, and resolve network issues easily with CNM Network Health Connect engineering errors to user impact in early-stage products Cilium configuration for Kubernetes operations at scale Designing feedback loops for progressive delivery Ship features faster and safer with Datadog Feature Flags Choosing the right OpenTelemetry Collector distribution Route your monitor alerts with Datadog monitor notification rules Automate Cloud SIEM investigations with Bits AI Security Analyst Cloud threat detection: How to identify risky activity across control and data planes Collecting Kafka performance metrics Monitoring Kafka with Datadog Monitoring Kafka performance metrics
Introducing ARFBench: A time series question-answering benchmark based on real incidents
Othmane Abou-Amal, Ben Cohen, Ameet Talwalkar, Stephan Xie · 2026-04-24 · via Datadog | The Monitor blog

More than a trillion dollars are lost every year due to system failures. To resolve them, engineers must troubleshoot outages quickly.

An important task in incident response involves analyzing observability metrics, or time series data that captures a snapshot of the health of software systems. For example, an engineer for a service may use Datadog to answer questions like “When did latency start increasing?” and “What metrics outside of latency are also behaving abnormally?” to localize the root cause of the anomalous behavior.

These time series question-answering (TSQA) tasks are essential for engineers, and present challenging and necessary tasks for SRE models and agents to perform. In this work, we explore the degree to which AI models can perform TSQA tasks.

To this end, we’re excited to introduce the Anomaly Reasoning Framework Benchmark (ARFBench), a TSQA benchmark derived from real internal incidents at Datadog, using Datadog’s own internal telemetry data (Figure 1). In this post, we’ll present three key takeaways from our benchmarking experiments:

  • Leading LLMs, vision-language models (VLMs), and time series foundation models (TSFMs) have substantial room for improvement on ARFBench.

  • We introduce a new hybrid TSFM-VLM that yields comparable overall performance to top frontier models on ARFBench, demonstrating promising new approaches to TSQA modeling.

  • We observe markedly different error profiles between our top TSFM-VLM and human experts on ARFBench. These results suggest that their strengths are complementary. We introduce a model–expert oracle that establishes a new superhuman frontier for LLMs, VLMs, and TSFMs.
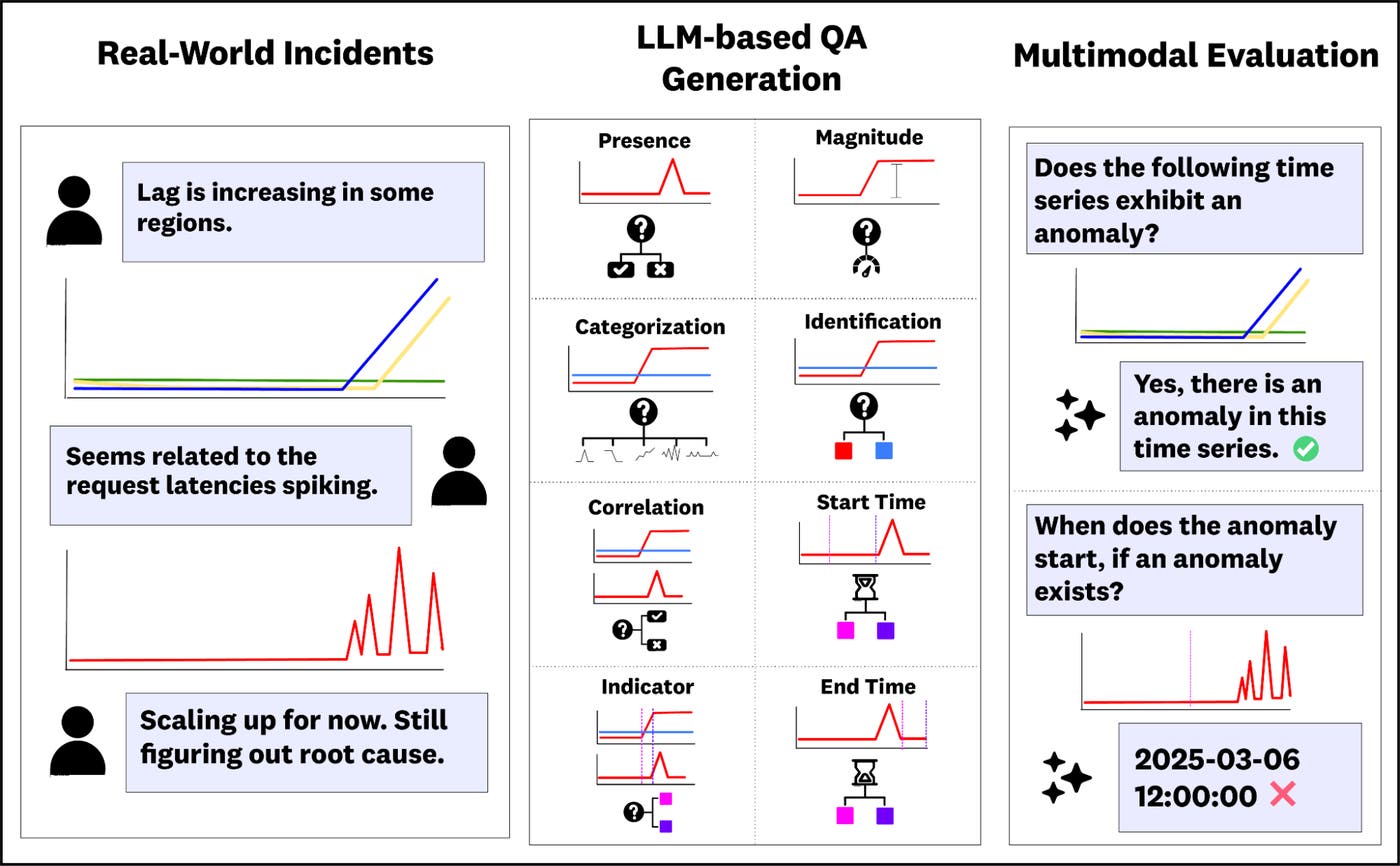
Figure 1: Workflow of ARFBench question-answer generation. Engineers use commercial messaging platforms to respond to incidents, where they typically send time series widgets that visualize relevant metrics. Time series and incident timelines from internally monitored incidents are used as input to an LLM pipeline and fit to eight different question templates testing various aspects of anomalies. The resulting multiple-choice question-answer pairs can be used to evaluate various predictive models.
Diagram showing the ARFBench pipeline, where time series data and incident timelines are used to generate templated question-answer pairs for evaluating models.
Figure 1: Workflow of ARFBench question-answer generation. Engineers use commercial messaging platforms to respond to incidents, where they typically send time series widgets that visualize relevant metrics. Time series and incident timelines from internally monitored incidents are used as input to an LLM pipeline and fit to eight different question templates testing various aspects of anomalies. The resulting multiple-choice question-answer pairs can be used to evaluate various predictive models.

ARFBench: Using real-world incident data to create a TSQA benchmark

ARFBench is a TSQA benchmark based on real incidents internal to Datadog, using our own internal telemetry data. Compared to existing benchmarks, ARFBench differs in three key aspects:

  • It uses real time series data from production systems.

  • Each question-answer (QA) example is grounded in expert annotations and additional context.

  • Tasks are designed to test compositional reasoning: Questions are organized into three tiers of increasing difficulty, with higher-tier tasks depending on correct reasoning performed in lower tiers (Figure 2).
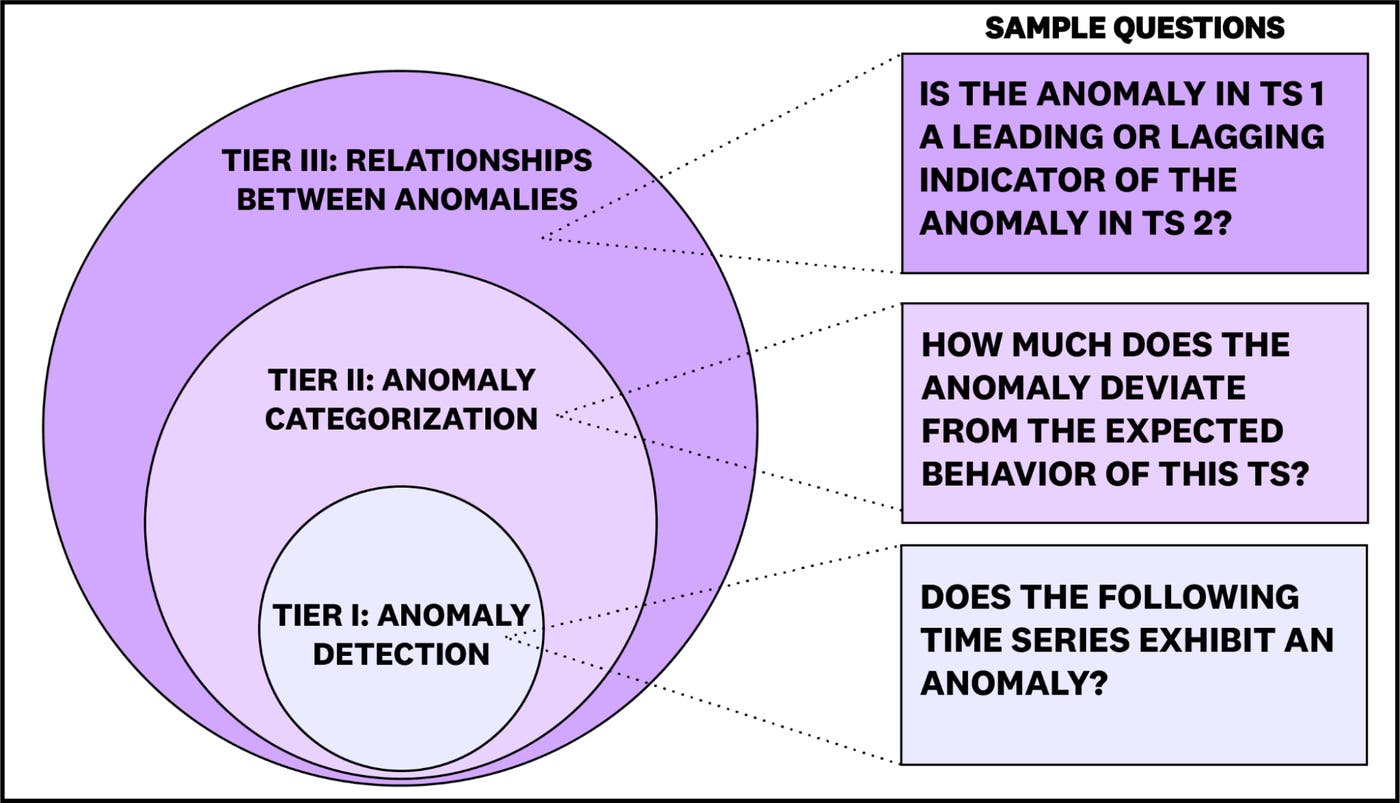
Figure 2: Example questions from each tier of ARFBench. ARFBench questions are designed in three tiers of increasing difficulty, with higher-tier tasks depending on correct reasoning on lower tiers.
Examples of ARFBench questions across three difficulty tiers, illustrating increasing reasoning complexity.
Figure 2: Example questions from each tier of ARFBench. ARFBench questions are designed in three tiers of increasing difficulty, with higher-tier tasks depending on correct reasoning on lower tiers.

ARFBench consists of 750 QA pairs drawn from 142 time series and 63 incidents. Time series in ARFBench have a maximum of 2,283 variates and 40,000 time steps, which present a challenging setting for context-limited models.

To create ARFBench, we built a VLM pipeline for extracting the time series widgets from internal incident discussion threads to help generate and filter QA pairs. We then manually verified every generated question for correctness and privacy concerns, and threw away questions that we found unsuitable.

Reasoning about time series and anomalies requires meaningful context across data modalities. ARFBench enriches time series with two types of context: time series captions, which describe what the time series represent, and multivariate groupings, which contextualize each channel relative to a larger relevant collection of time series channels. For instance, while it may not always matter that a single pod fails and restarts in a service, the combination of many pods failing and restarting simultaneously could indicate a significant anomaly. This level of complexity reflects real-world conditions that many existing unimodal, synthetic datasets fail to capture (Figure 3).
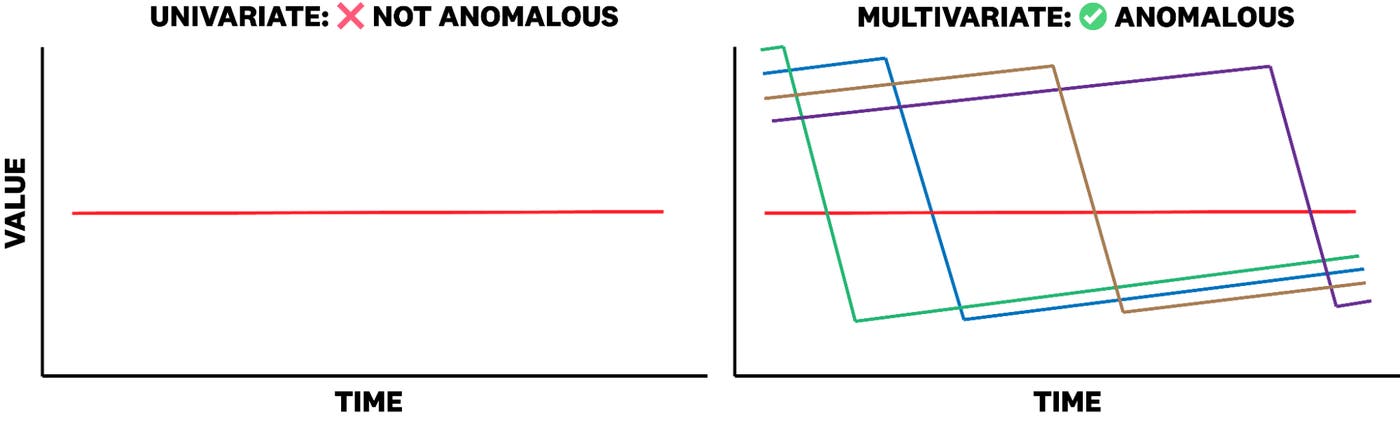
Figure 3: When analyzed alone, variates of a time series may not be anomalous. However, in the context of a grouping of variates, the same variate may be considered anomalous. The multivariate time series in this figure is based on the average remaining TLS certificate lifetime across different clusters and IDs of a particular service.
Multivariate time series showing how individual variates may appear normal alone but reveal anomalies when viewed within a group.
Figure 3: When analyzed alone, variates of a time series may not be anomalous. However, in the context of a grouping of variates, the same variate may be considered anomalous. The multivariate time series in this figure is based on the average remaining TLS certificate lifetime across different clusters and IDs of a particular service.

Frontier VLMs outperform existing baselines

We evaluated three categories of existing models on ARFBench:

  • LLMs, which take time series as text input

  • VLMs, which take time series plots as image input

  • Time series LLMs, which use a time series encoder with an LLM backbone

We compared the models to two human baselines: observability experts and time series researchers without extensive observability experience. The human experts were evaluated on a randomly sampled 25% subset of ARFBench.

Among existing models, GPT-5 (VLM) yielded the top performance at 62.7% accuracy and 51.9% F1 (Figure 4). This is much higher than the random choice baseline at 22.5% F1, but still underperforms domain experts and is far below a model-expert oracle at 87.2% accuracy and 82.8% F1 (further discussion follows below). As expected, model performance tends to worsen as the tier difficulty increases.
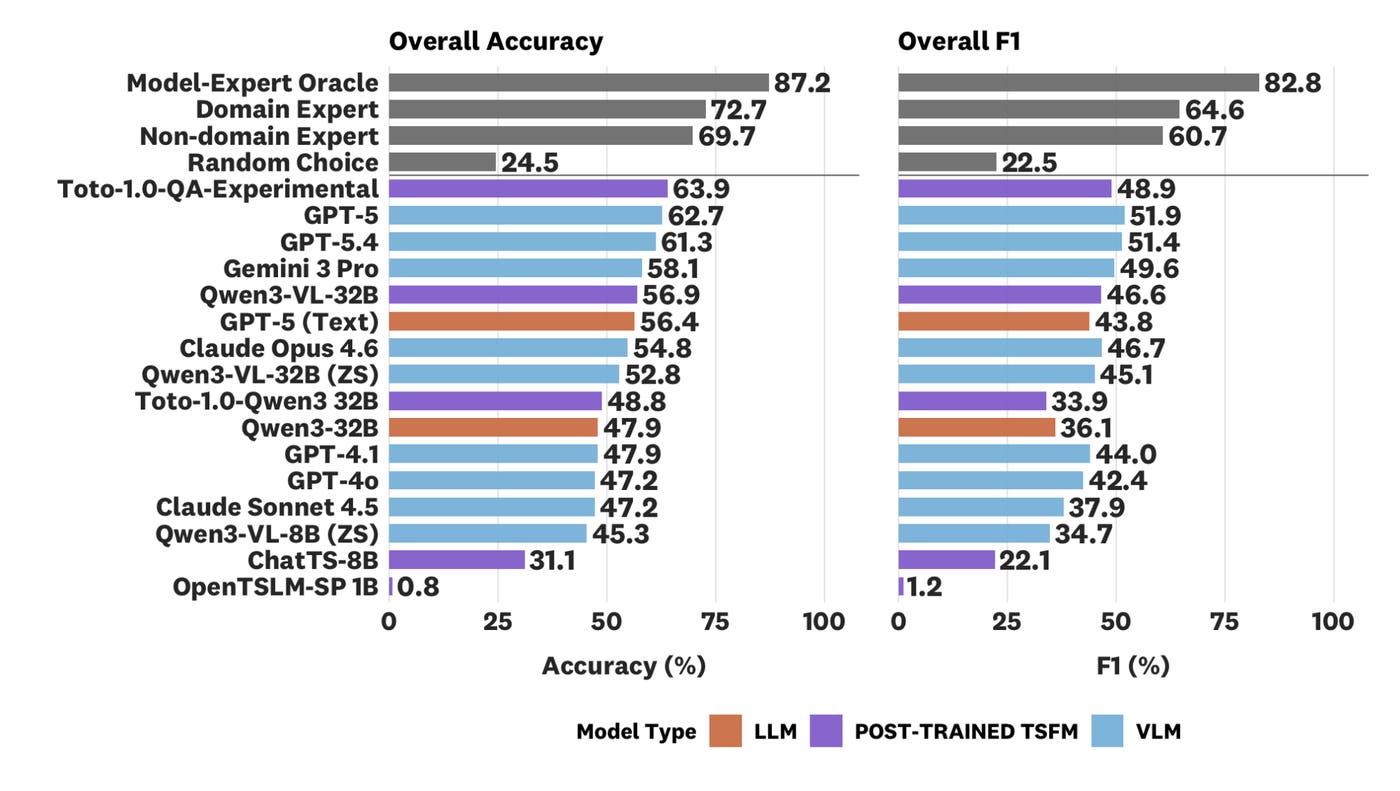
Figure 4: Overall accuracy and F1 of various baselines and foundation models on ARFBench. Models are sorted by decreasing accuracy. The Toto-1.0-QA-Experimental achieves the top accuracy on ARFBench and yields comparable F1 to top frontier models.
Bar chart comparing accuracy and F1 scores of foundation models and human experts on ARFBench.
Figure 4: Overall accuracy and F1 of various baselines and foundation models on ARFBench. Models are sorted by decreasing accuracy. The Toto-1.0-QA-Experimental achieves the top accuracy on ARFBench and yields comparable F1 to top frontier models.

We also observe several trends with our evaluations on ARFBench. Corroborating previous works in time series classification and QA such as Daswani et al. (2024), we find that VLMs outperform LLMs. The top proprietary models and open source models also showed a substantial gap in performance. However, we find that some open source models perform better than many older proprietary models or models from the Claude family.
Hybrid TSFM-VLMs show promise for specialized TSQA modeling

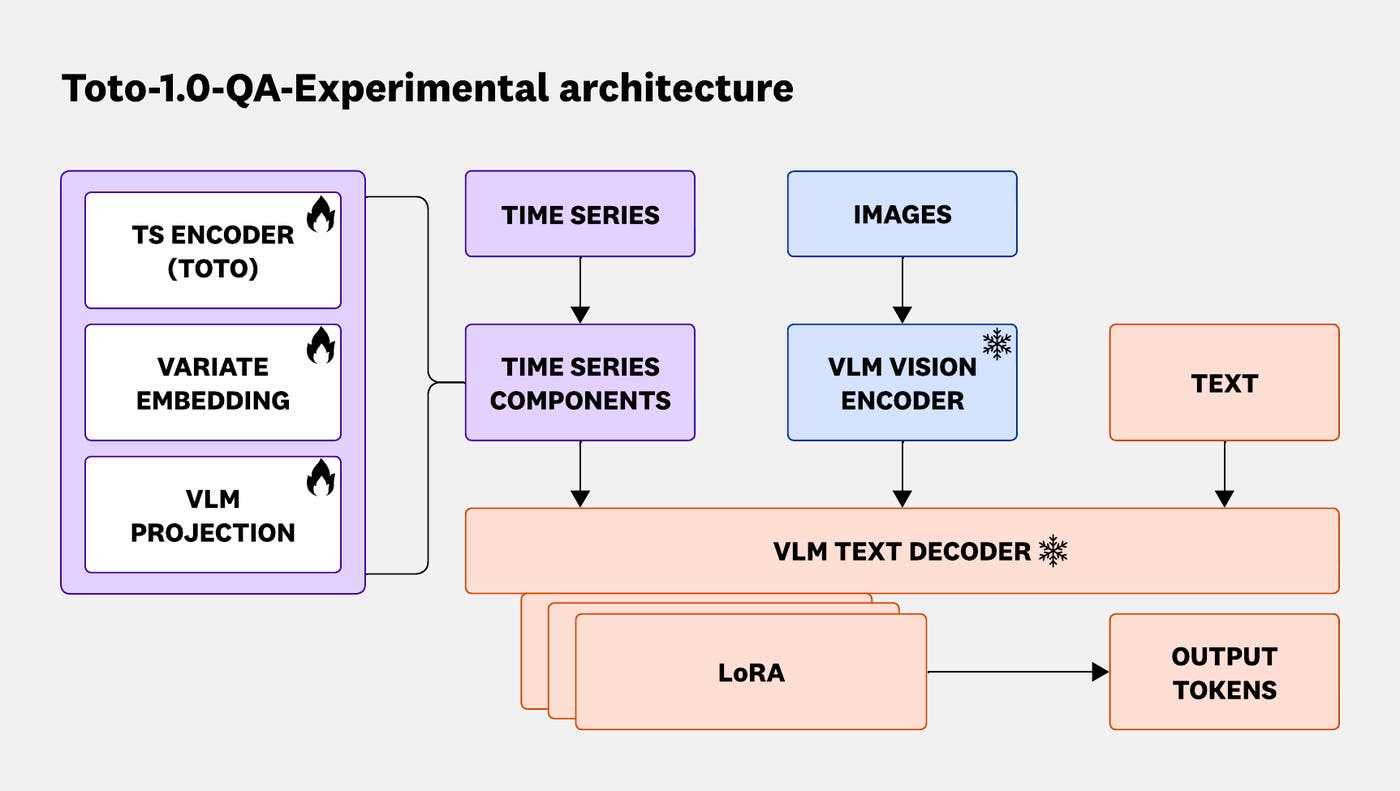
Figure 5: Architecture diagram of the Toto-1.0-QA-Experimental (Toto-Qwen3-VL) model. Frozen weights are denoted with a snowflake, while trainable weights are marked with a flame. We use low-rank adaptation (LoRA), a parameter-efficient fine-tuning method that adds a small number of trainable parameters, to align TSFMs and VLMs and yield novel abilities.
Architecture diagram of a hybrid model combining a time series encoder, vision encoder, and text decoder with LoRA (low-rank adaptation) layers to process time series, images, and text inputs.
Figure 5: Architecture diagram of the Toto-1.0-QA-Experimental (Toto-Qwen3-VL) model. Frozen weights are denoted with a snowflake, while trainable weights are marked with a flame. We use low-rank adaptation (LoRA), a parameter-efficient fine-tuning method that adds a small number of trainable parameters, to align TSFMs and VLMs and yield novel abilities.

Though VLMs yielded the highest accuracy and F1 score among existing models, we found that plotting and input representation was a challenge for both VLMs and LLMs. For example, due to the high number of variates, we often could not plot the time series without repeating colors or occluding different variates. This motivated a native time series approach alongside the VLM model in which we could utilize time series, plots, and text as joint input.

To test this, we trained a hybrid model (Figure 5) by combining Toto, our state-of-the-art observability TSFM, with Qwen3-VL-32B, a leading open source VLM. We used both synthetic (Figure 6) and real multimodal data in a multi-stage post-training pipeline incorporating both supervised fine-tuning (SFT) and reinforcement learning (RL).

The resulting model, Toto-1.0-QA-Experimental, yielded the top accuracy score of 63.9% and comparable F1 to top frontier models (48.9%). In the anomaly identification task category, where a model selects anomalous variates in the time series, Toto-1.0-QA-Experimental outperforms all models by at least 8.8 percentage points in F1 and achieves best per-category accuracy, suggesting that TSFM-VLM modeling can highly benefit performance on particular tasks. Furthermore, Toto-1.0-QA-Experimental’s parameter count is several orders of magnitude lower than frontier models, thus providing potential efficiency gains at inference time.
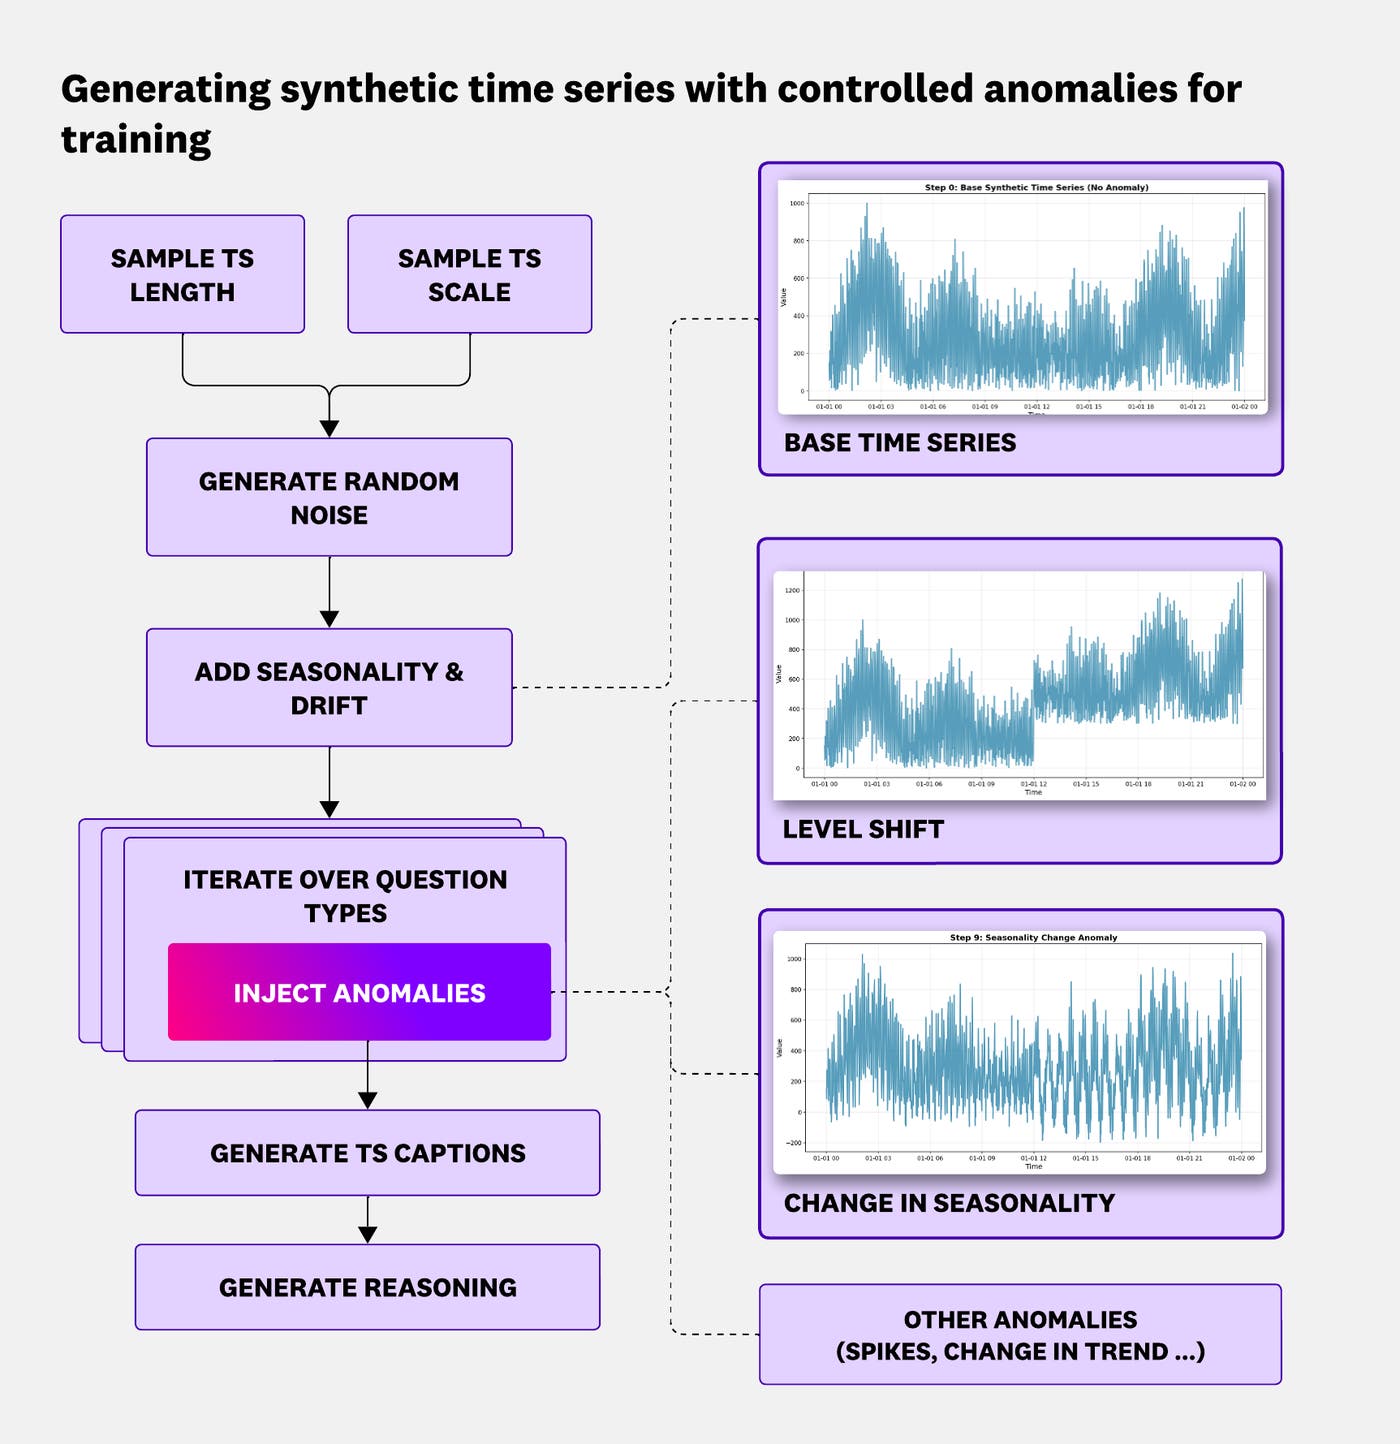
Figure 6: Synthetic data generation flow for post-training hybrid TSFM-VLM and TSFM-LLM models. Time series are generated by first sampling different lengths and scales and then by sampling each datapoint from a normal distribution. To add variation, we add seasonality and drift components into the time series, yielding different base time series (top right). For each base time series, we apply question templates and inject different anomalies (for example, level shift, change in seasonality) at various points of the time series (bottom right). Finally, we generate time series captions and reasoning for the question-answer pair using a VLM.
Flow diagram of synthetic time series generation, including noise sampling, adding seasonality and drift, injecting anomalies, and generating captions and reasoning.
Figure 6: Synthetic data generation flow for post-training hybrid TSFM-VLM and TSFM-LLM models. Time series are generated by first sampling different lengths and scales and then by sampling each datapoint from a normal distribution. To add variation, we add seasonality and drift components into the time series, yielding different base time series (top right). For each base time series, we apply question templates and inject different anomalies (for example, level shift, change in seasonality) at various points of the time series (bottom right). Finally, we generate time series captions and reasoning for the question-answer pair using a VLM.

We refer interested readers to our paper for more experimental details, error analysis, and case studies.

Models complement domain experts and set a new superhuman frontier

The current aggregate gap on ARFBench between the best models (Toto-1.0-QA-Experimental & GPT-5) and the two human domain experts is only 8.8 percentage points in accuracy and 12.7 percentage points in F1. However, at the individual question level, we observe noticeably different behavior between GPT-5 and the human experts. GPT-5 answers 48% of questions correctly that both experts get incorrect; on these questions, the human experts tend to make errors in instruction-following or fine-grained perception. Meanwhile, at least one expert correctly answers 79% of questions that GPT-5 gets incorrect. On these sets of questions, model errors tend to involve hallucination and incorrect domain knowledge. We provide examples of both groups of errors in the paper.

Due to the large difference in error distribution, we hypothesize that when experts are complemented with models, their joint capability becomes much higher than any single expert or model alone. To establish this, we compute a model-expert oracle, a best-of-2 metric where an oracle perfectly chooses the best answer between the model and the expert, which yields 87.2% accuracy and 82.8% F1 on our data. This is far above existing model capabilities and sets a new superhuman frontier for LLMs, VLMs, and TSFMs to achieve.

What’s next: Time series reasoning as a core component of agents

In the broader scope of incident response, ARFBench only contains questions targeting diagnosis and reasoning. However, we envision that strong diagnosis and reasoning abilities will play a large part in end-to-end agentic systems (for example, SRE or incident response agents) that require time series reasoning as a subroutine in understanding the incident. While ARFBench can be used to evaluate time series agents, it is not currently a multi-turn benchmark. However, we believe that future agents and models that perform well on the single-turn ARFBench will ultimately perform better on end-to-end tasks.

Getting started with ARFBench

If you are interested in testing your model on ARFBench, you can find the benchmark, leaderboard, and model weights on Hugging Face, and the evaluation code on GitHub.

To learn more, read our technical paper.

If you’re interested in building the next generation of AI-powered observability, we’re hiring.