





John Matson
In the previous article, we covered four types of alerts that evaluate the instantaneous status of different infrastructure components. In this post we’ll explore alerts that trigger on timeseries metrics and discrete events. The great benefit of these alerts is that they can evaluate not just instantaneous values, but also trends over time:
Threshold alerts
Change alerts
Outlier alerts
Anomaly alerts
Event alerts
Composite alerts
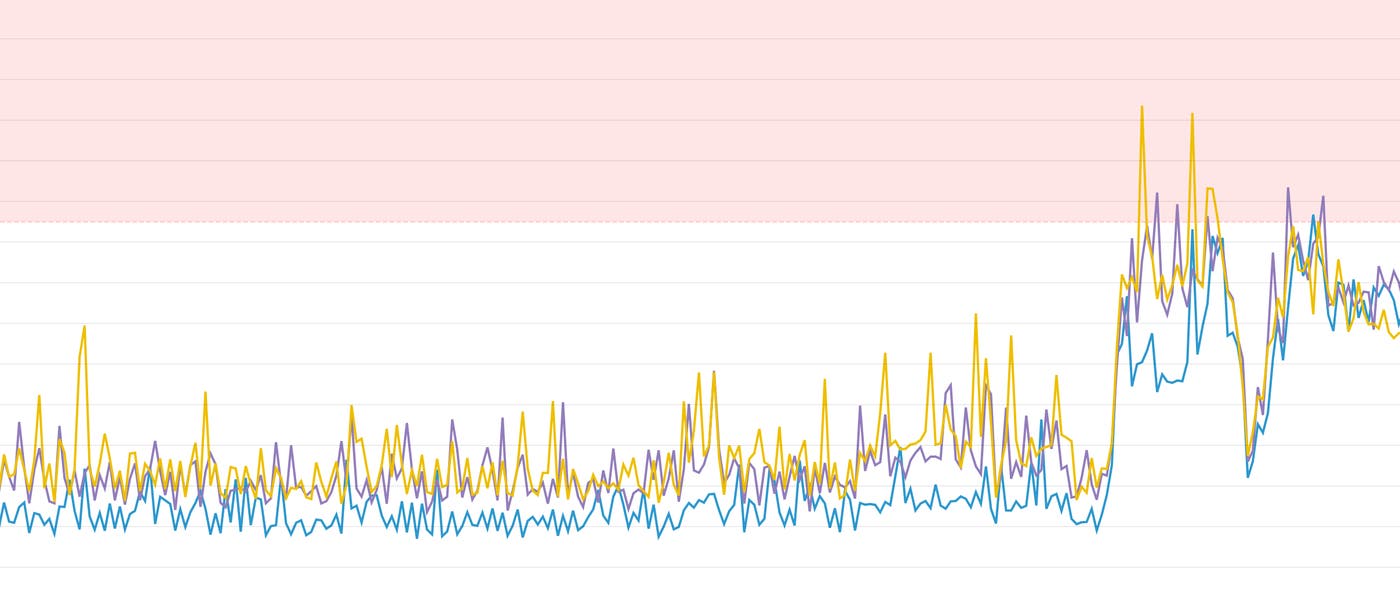
Along with basic availability checks, a threshold alert is one of the simplest kinds of alerts. These alerts trigger whenever the monitored metric goes above (or below) a user-defined threshold. An alert may have multiple thresholds with different responses—for example, a warning threshold that posts a message in an ops channel, and a critical threshold that pages an on-call responder.
Importantly, a threshold alert need not be an absolute red line—you can include a time component in your alert evaluation to avoid false positives caused by momentary blips. For instance, you might wish to alert only if a metric’s value hovers above a given threshold for five minutes or more, or if the average value of the metric over a 15-minute window exceeds a set threshold.
| What | Why | Example |
|---|---|---|
| Metrics with SLAs | To surface unacceptable performance immediately | p95 application response time |
| Normalized metrics (percentages or fractions) | To identify critical resource constraints | Percent disk available |
| What | Example | Instead use... |
|---|---|---|
| Metrics with a variable or trending baseline | Web app requests per second | Change alert or anomaly detection to account for expected fluctuations |
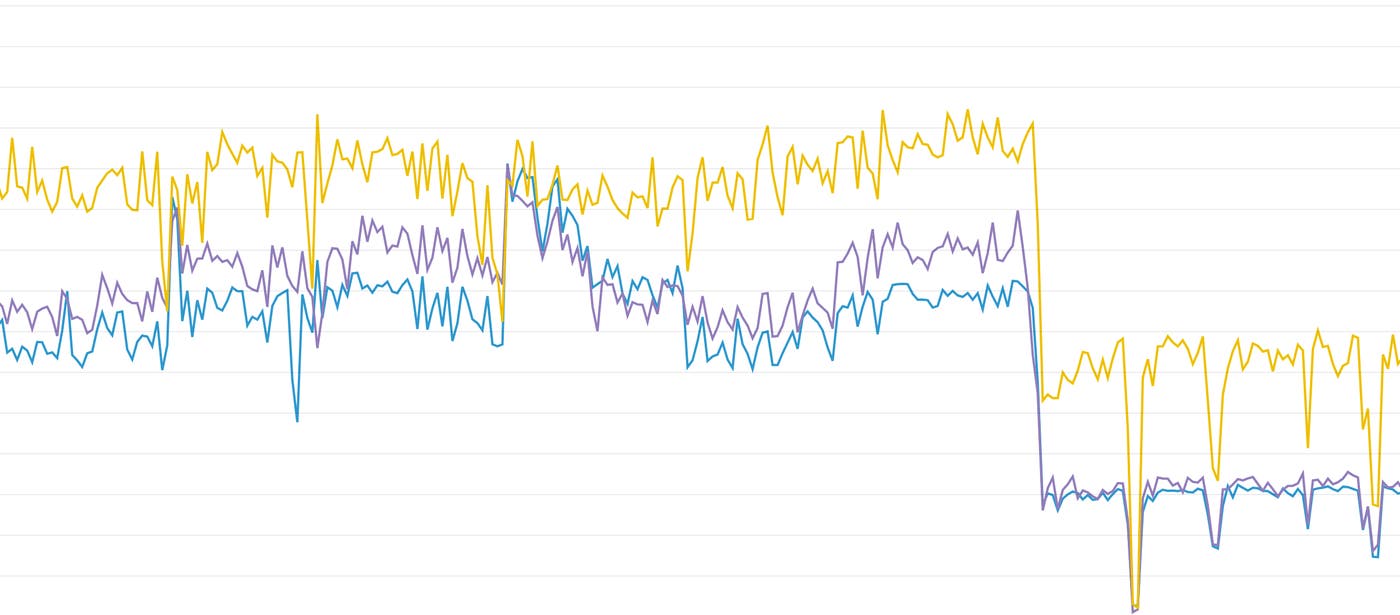
Change alerts evaluate the delta or percentage change in a metric over a certain time interval. Change alerts can notify you of issues such as a large-magnitude drop in database queries processed, as compared to recent values. These alerts are useful for identifying sudden, unexpected changes in metrics where the baseline is highly variable over longer timespans, making it difficult to define a “normal” range for the metric.
| What | Why | Example |
|---|---|---|
| Metrics with variable or slowly shifting baselines | To isolate unexpected spikes or drops from normal changes | User count for a growing web app |
| What | Example | Instead use... |
|---|---|---|
| Metrics with a wide range of acceptable values | CPU usage on app servers | Threshold alert to ensure that CPU does not remain elevated for extended periods |
| Metrics with small or zero baseline values | 5xx error count in HTTP server | Threshold alert to avoid triggering on trivial increases that are large on a percentage basis (e.g., 1 error/second to 3 errors/second) |
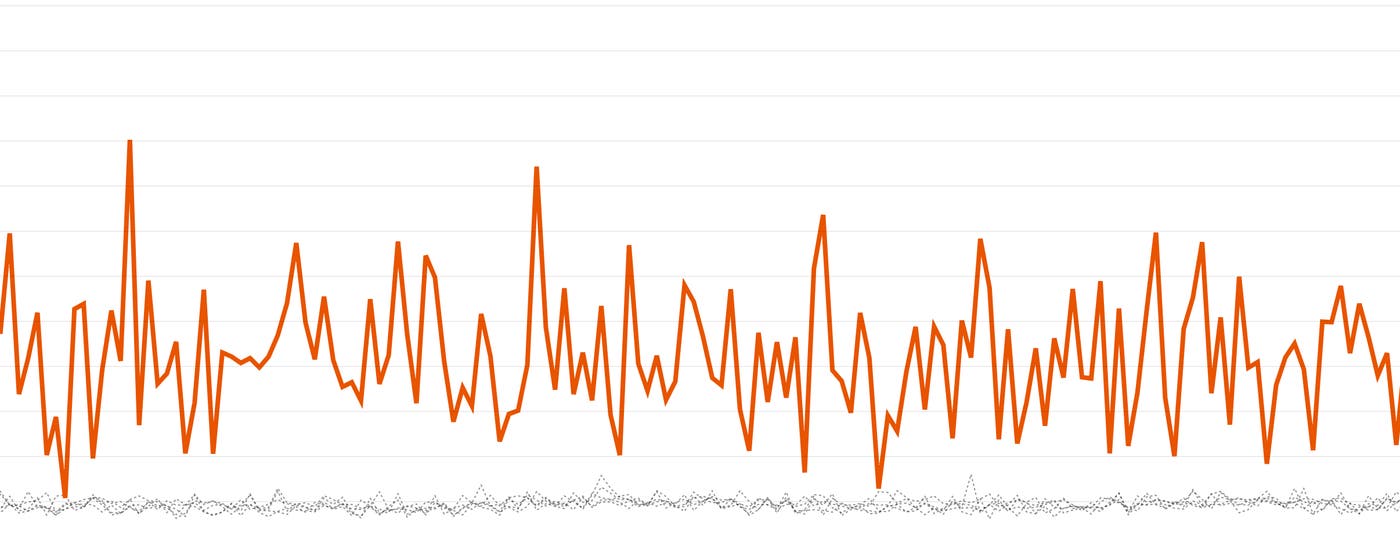
Outlier detection (not to be confused with anomaly detection) tracks deviations from expected group behavior, whether that group comprises hosts, containers, or other units of infrastructure. An outlier alert evaluates metric values from each member of the group, triggering if one or more individuals deviates significantly from the rest.
| What | Why | Example |
|---|---|---|
| Metric values that should be relatively level across the members of the group | To identify imbalances caused by an internal failure | Data stored per Cassandra database node |
| **Work metrics** for distributed systems | To isolate individual components that are failing to process work effectively | Error rate per application server |
| What | Example | Instead use... |
|---|---|---|
| Metrics reported by heterogeneous groups | Resource metrics (e.g. free memory) across disparate instance types | Threshold alerts on normalized values (e.g. percent memory available) |
| Metrics that can easily be skewed by random distributions | p99 latency for individual app servers | Threshold alerts on aggregate p99 latency at the service level |
| Metrics from ephemeral infrastructure components | Throughput metrics for short-lived app containers | Change alerts on aggregated, service-level metrics |
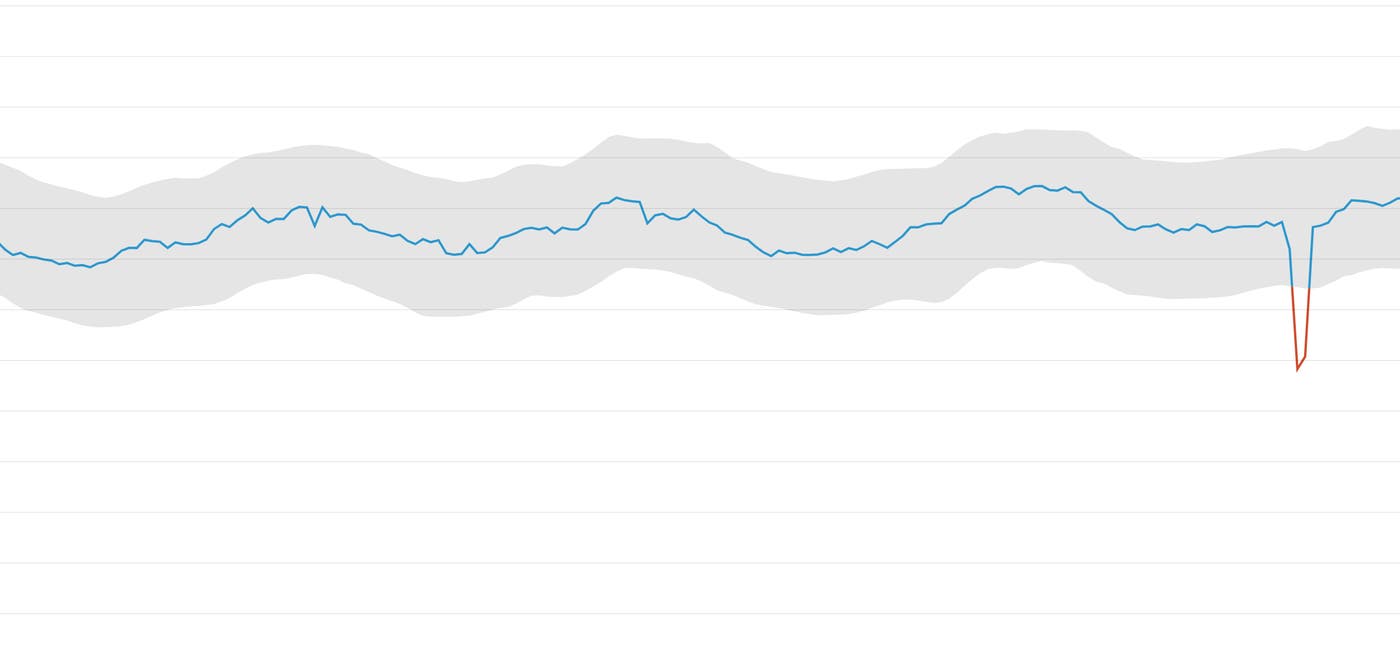
Whereas outlier detection looks for deviations from group behavior in the moment, anomaly detection looks for deviations from recent historical trends. An anomaly alert can account for seasonality (such as daily traffic patterns), allowing you to get notified only when metric peaks or drops cannot be explained by normal, periodic fluctuations.
| What | Why | Example |
|---|---|---|
| Metrics with expected temporal patterns | To isolate problematic changes from normal fluctuations | Load balancer throughput for a user-facing application |
| Metrics with a long-term directional trend | To set robust alerts on metrics with a steadily shifting baseline | Transactions processed on an expanding e-commerce platform |
| What | Example | Instead use... |
|---|---|---|
| Metrics with unpredictable spikes or dips | Throughput for intermittent data-processing jobs | Event alert for absence of job completion |
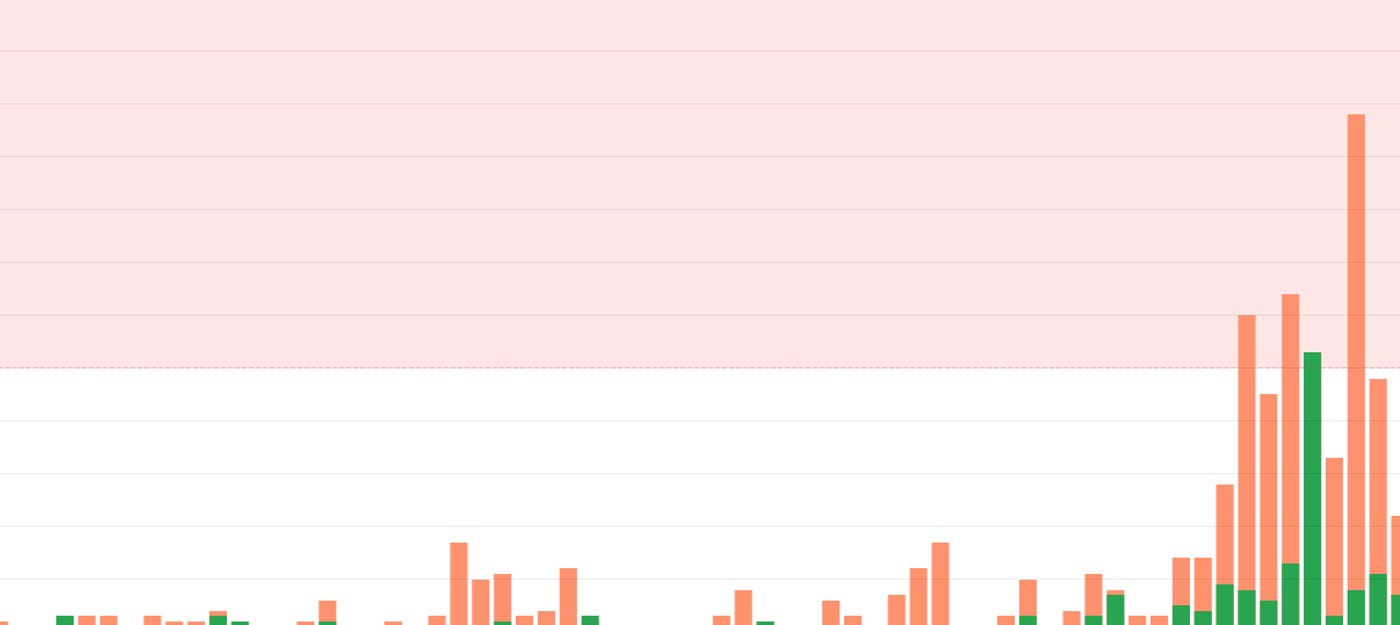
Unlike metric alerts, which evaluate a continuous stream of timeseries data, event alerts trigger on discrete occurrences, which may be quite rare. For instance, you might wish to trigger an alert whenever a nightly batch data-processing job fails to complete. Importantly, events can carry much more context than a single timeseries datapoint can. For example, an event generated by a failed run of a configuration management tool can include the actual error message returned, as well as a link to related events in the past.
Even though individual events are discrete, you can still monitor their occurrence over time by counting instances of an event over a particular timespan. For example, you can set an alert to fire whenever a particular service restarts more than three times in a five-minute interval.
| What | Why | Example |
|---|---|---|
| Completion of critical actions | To ensure that scheduled or intermittent work is carried out | Nightly build did not complete |
| Unexpected or forbidden activity | To monitor for possible breaches or abuses | Repeated login failures |
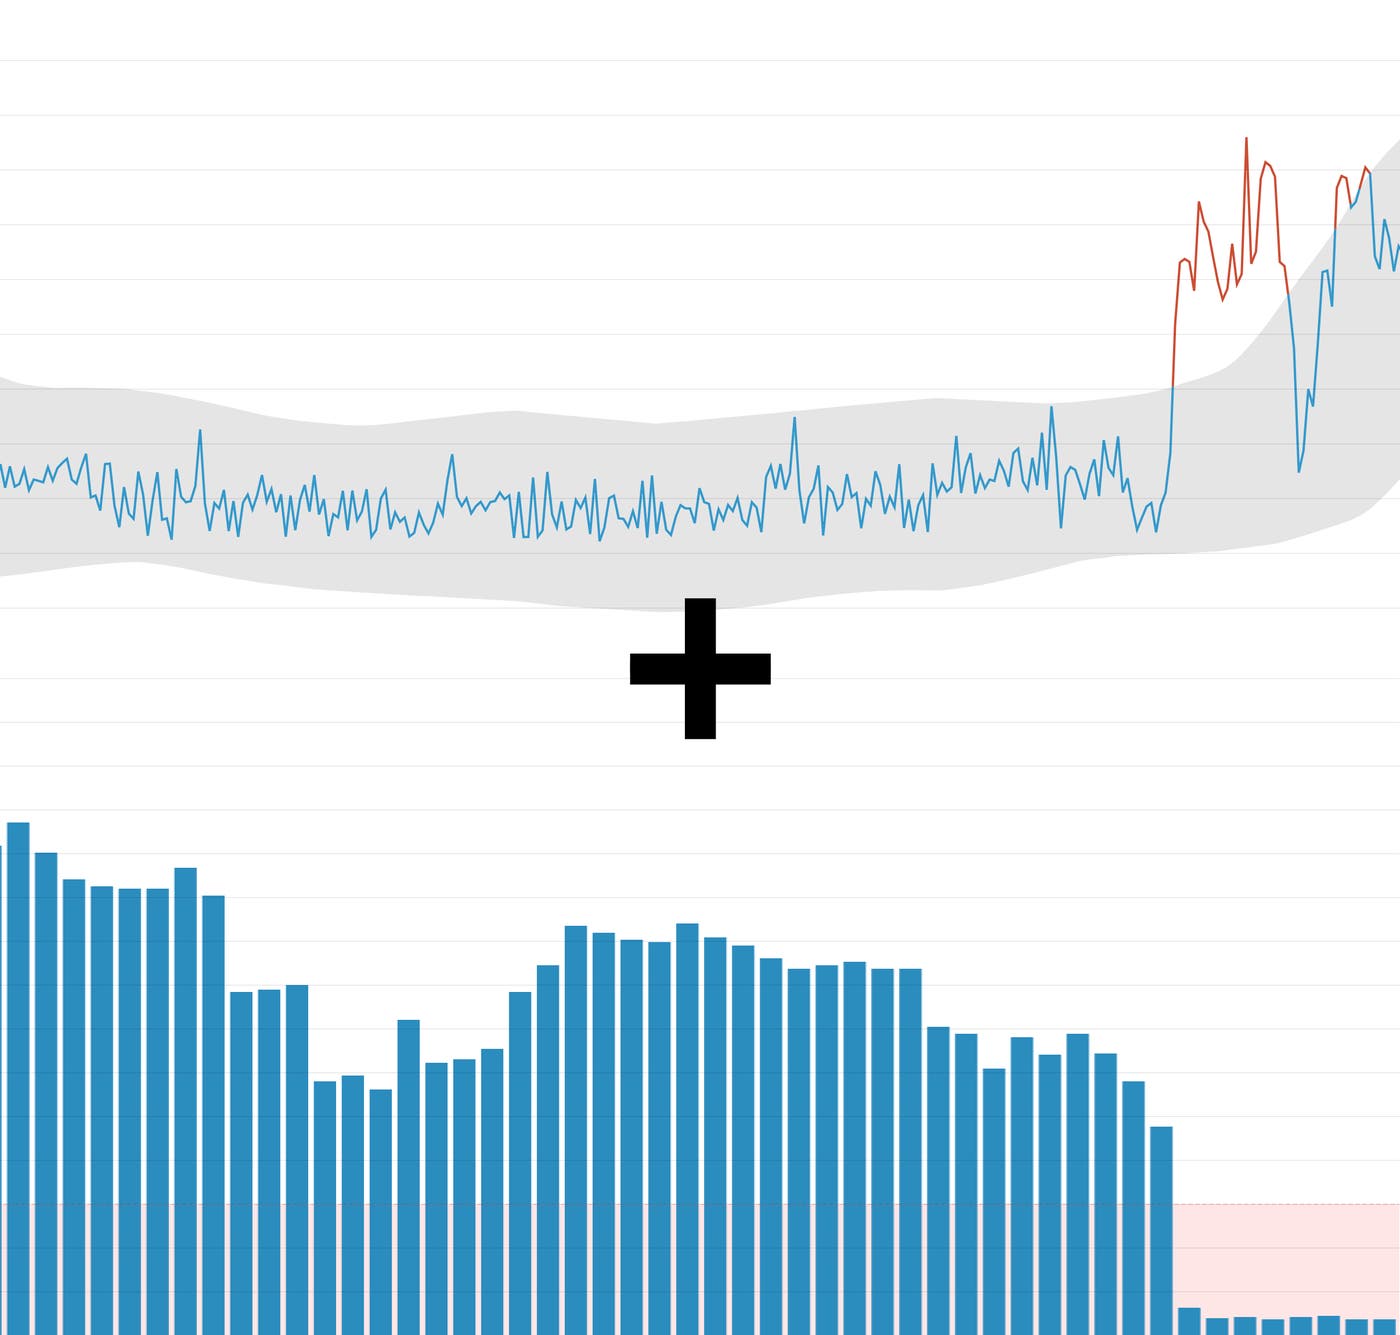
Composite alerts allow you to build more complex evaluation logic into your alert definitions. With a composite alert, you can specify that an alert fires if and only if a number of specific conditions are met. For example, you might want to alert on multiple indicators of service health, such as the locking rate in your database and the latency of your query service, where correlated trends can point to recurring issues. Or you might want to set a threshold alert on the length of your messaging queue, but withhold an alert shortly after a service restart, when a brief surge in queue length is expected.
| What | Why | Example |
|---|---|---|
| Multiple indicators that together point to a particular problem | To alert on known issues that manifest with multiple symptoms | Increased 404 error rate combined with surge in web requests per second |
| Issues that have a routine explanation | To withhold alerts on deviations that are expected under certain circumstances | Spike in traffic to e-commerce site after flash sale announcement |
In this post we have covered several alert types that you can set on metrics or events from your infrastructure. By understanding the ideal use cases for each of these alert types, as well as the status checks covered in the companion post, you can ensure that you are notified of critical issues in your environment as quickly as possible.
此内容由惯性聚合(RSS阅读器)自动聚合整理,仅供阅读参考。 原文来自 — 版权归原作者所有。