








Addie Beach
Technical Content Writer

Sriram Raman

Sarah Elkaim
As your cloud infrastructure scales to handle the weight of new features and a growing user base, your attack surface increases as well. When combined with the steady rise in security threats—more than 25,000 vulnerabilities were identified in 2022 alone—identifying every risk to your distributed system can be a challenge.
To monitor your Google Cloud instances for weak points and potential attacks, you can access the Google Cloud Security Command Center. Security Command Center brings together findings from all your Google Cloud services, helping you detect misconfigurations and code-level vulnerabilities across your system. Datadog now collects findings from Security Command Center in Cloud SIEM, so you can view alerts from Google alongside issues from the rest of your infrastructure. Additionally, the Datadog platform makes it easy to cross-reference these findings from Google with logs, traces, and metrics from your entire stack for fast remediation.
In this post, we’ll explore how the Security Command Center integration enables you to:
Centralize security monitoring for your entire cloud infrastructure
Quickly remediate issues with enhanced finding context
With the Google Cloud Security Command Center integration, you can triage and troubleshoot findings from your Google Cloud environment within Datadog. You can easily leverage this integration by using one-click enablement—simply enable security findings collection in the Google Cloud Platform integration for each service account that you want to monitor. Datadog will then begin automatically populating your Google Cloud security findings into Cloud SIEM right alongside other findings from your cloud setup.
Using Cloud SIEM Signals Explorer, each security finding from Google Cloud is labeled with crucial information to help you quickly evaluate potential risk. This includes the severity; the project ID, date, and related GCS buckets; and other relevant context, such as whether the finding represents an active attack, a compliance violation, or a suspicious anomaly. If the security finding indicates that an attack is taking place, this information will also include details from the MITRE ATT&CK framework about the nature of the incident. These high-level overviews enable you to prioritize the most urgent threats to your system and focus your remediation efforts where they matter most.

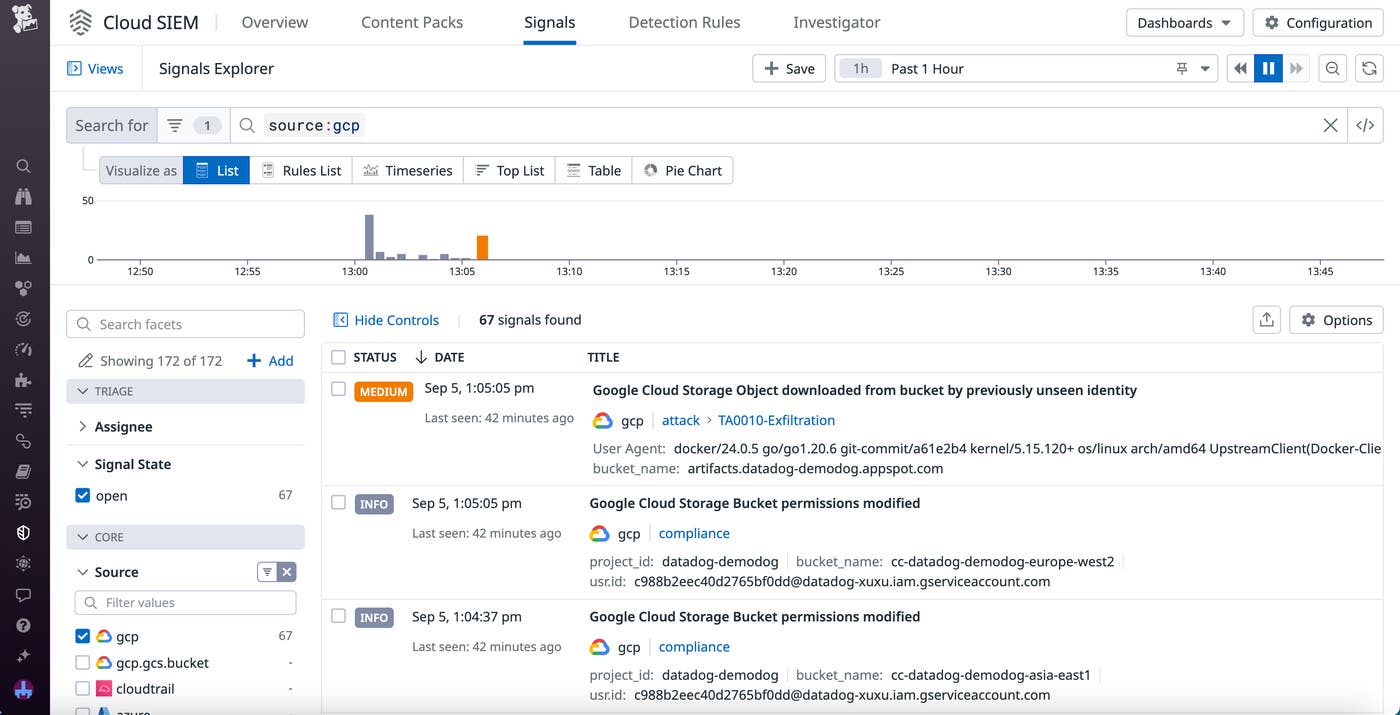
Cloud SIEM seamlessly integrates with the rest of the Datadog platform, enabling you to identify and resolve security issues quickly. Let’s say that, during a review of your findings in Cloud SIEM, you see that a dataset in one of your Google services was recently changed from private to public. This could potentially compromise sensitive user data and leave your system open to attack.
You can click on the finding to open a side panel that contains more details about any IPs, users, and events involved. From this panel, you can also view suggested actions for investigation, including potential log queries that you can run or dashboards to view for additional relevant information. For this example (shown below), you determine via the user details that a developer in your organization made this change.

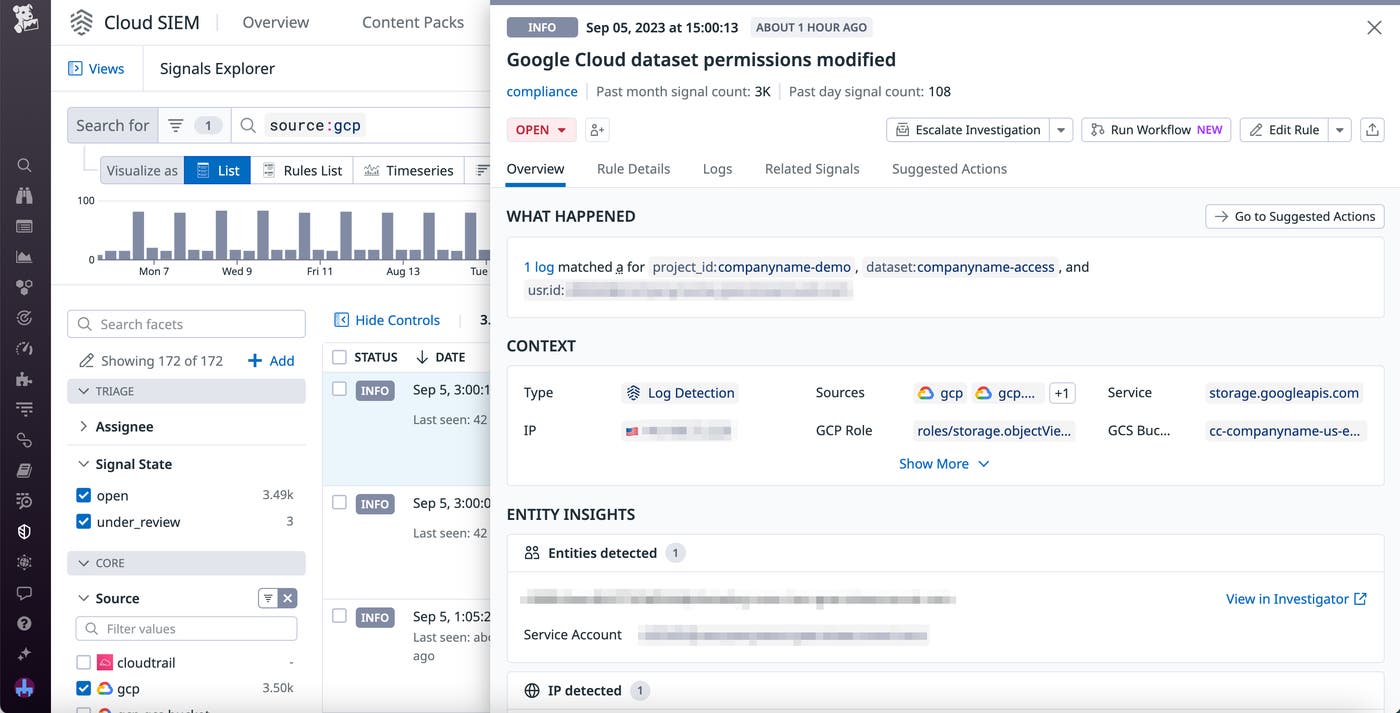
You reach out to the responsible developer and discover that they made an unnecessary update to the dataset permissions while working on an upcoming feature release. Now that you know the cause of the misconfiguration, you can focus your efforts on assessing and mitigating any impacts. Viewing the relevant database in the Service Catalog can help you spot any anomalous activity that could indicate a malicious actor exploiting the vulnerability. You can then pivot directly to GitHub from the Service Catalog entry to find the problematic code and set your dataset as private once again. When the issue is resolved, Datadog automatically archives the finding in Cloud SIEM to ensure only the issues that need your attention stay at the top of the list.
By organizing security findings from your Google Cloud environments in Datadog, you can streamline your investigations and take action before your system is compromised. Cloud SIEM enables you to view misconfigurations and vulnerabilities from Google side-by-side with insights from the rest of your stack, so you can consolidate your troubleshooting activities.
You can get started with the Security Command Center integration in Datadog today or learn more in our documentation. If you aren’t already a Datadog user, you can sign up for a 14-day free trial.
此内容由惯性聚合(RSS阅读器)自动聚合整理,仅供阅读参考。 原文来自 — 版权归原作者所有。