








Sacha Guyon

Jonathan Epstein
If you’ve been in the SRE or DevOps space for a while, you know that on-call duty can be tough. Whether it’s getting woken up by an alert, or pulling over to the side of the road while driving, chances are you’ve had to stop what you’re doing as soon as your pager rings. But pager notifications often don’t give you enough information to investigate the issue from your mobile device, meaning that access to a laptop at all times is a must.
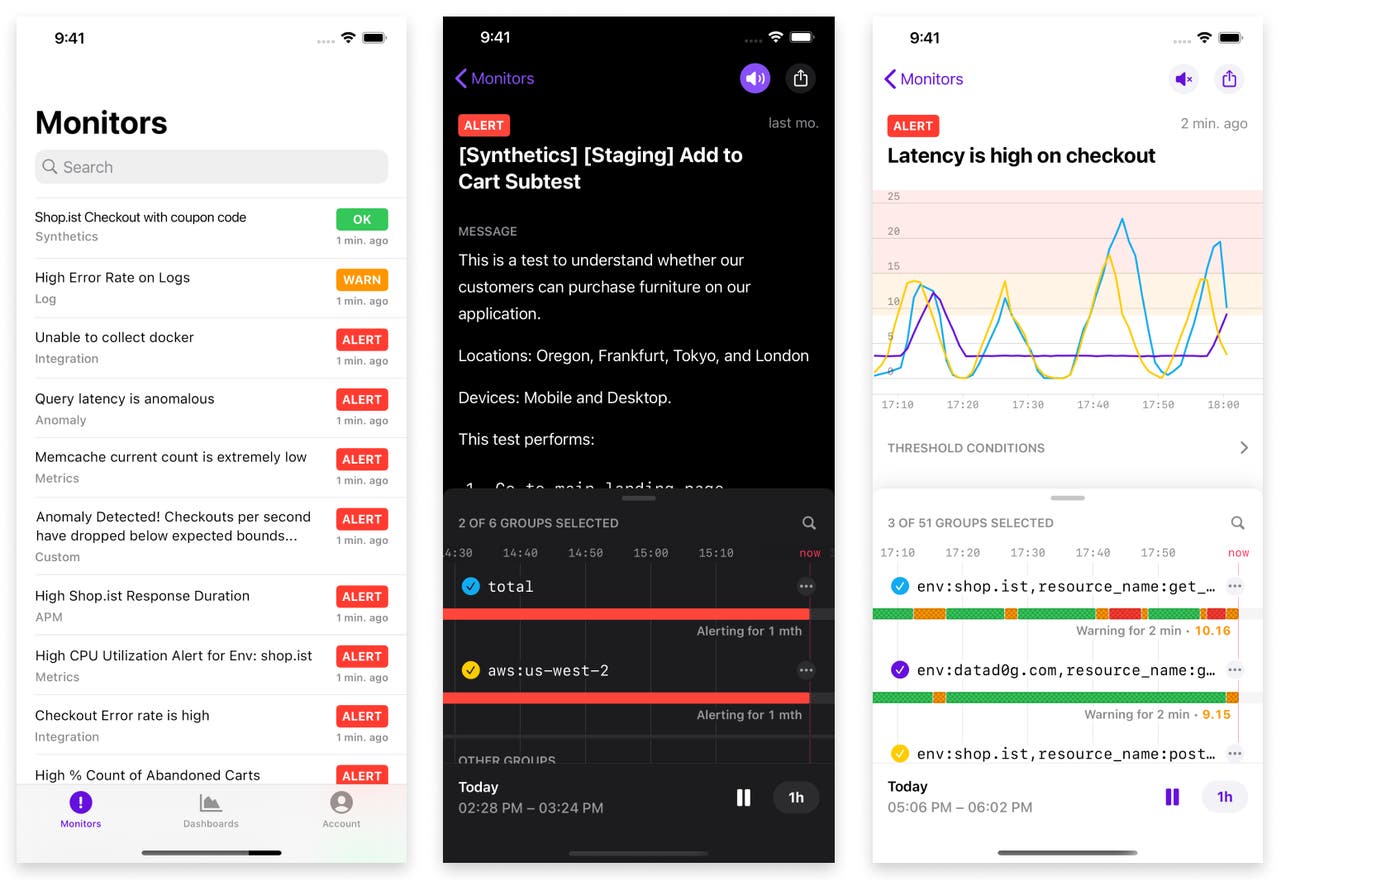
In order to help on-call engineers easily triage issues wherever they are, we are excited to announce the general availability of the Datadog mobile app for both Android and iOS devices. With full access to your Datadog dashboards and alerts and seamless integration with your on-call notification and messaging services like Pagerduty, OpsGenie, and Slack, you can use the Datadog app to quickly evaluate the conditions that triggered an alert, triage its urgency, and decide your next course of action—anywhere, anytime.
Available in both light and dark modes, the Datadog mobile app takes the desktop cloud monitoring experience you already know and reimagines it for mobile. Tapping the link included in a pager notification automatically opens the Datadog app to the relevant alert, where you’ll see a summary of recent activity along with interactive graphs for immediate context. From there, you can use native mobile gestures to scrub back and forth in time, zoom in on critical moments, and select groups to visually compare healthy hosts with those that triggered the alert. You can also view related events around the alert to contextualize the problem and get a fuller picture of why it was triggered.
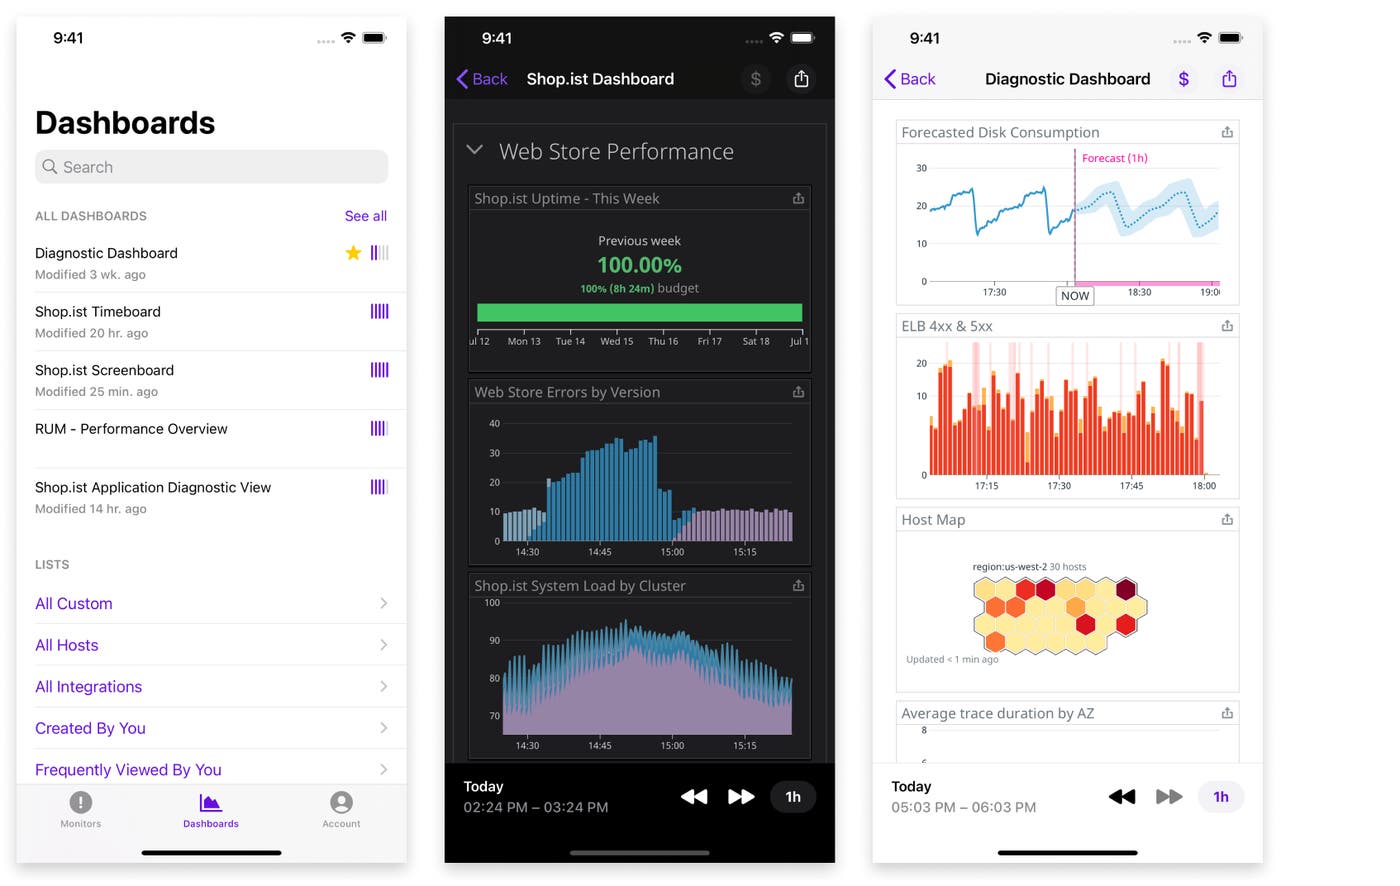
The Datadog mobile app also provides in-app access to all of your Datadog dashboards, allowing you to see key monitoring data from every layer of your environment using a single, mobile-friendly pane of glass. Now, when you receive a notification you can instantly correlate an alert with other critical metrics and pivot to other service dashboards for a deeper understanding of your stack’s current state.
Once you’ve explored your dashboards and determined the severity of the alert, you can decide how to proceed: mute the alert to stop notifications and focus on troubleshooting, share your findings with your teammates and start collaborating, or move to your laptop to perform further correlation analysis.
By providing you with instant access to your Datadog dashboards and alerts in a portable package, the Datadog mobile app lets you take your cloud monitoring toolkit just about anywhere—on-call or off. You can download the app on the Apple App Store or Google Play Store. And If you’re not already using Datadog, get started with a 14-day free trial.
此内容由惯性聚合(RSS阅读器)自动聚合整理,仅供阅读参考。 原文来自 — 版权归原作者所有。