





Kai Xin Tai
Sourcegraph is a universal code search tool that enables you to easily navigate and understand all of your code, regardless of the number of repositories you have and where they’re hosted. Its built-in code intelligence feature lets you jump to the definition and references of functions and variables, helping you learn new codebases faster. You can also use Batch Changes to automate large-scale code changes, which eliminates the need to manage hundreds of pull requests and minimizes the risk of making breaking changes.
Today, we’re excited to announce the release of the datadog-service-map Sourcegraph extension, which brings Datadog APM’s knowledge of service dependencies to your code search workflow. Now, as you’re exploring your code in Sourcegraph, you can see how your services call each other and then pivot seamlessly to Datadog APM for additional context around their performance. And if you find a bug that’s causing an increase in errors or latency, you can easily locate all impacted services, specify the fix once, and apply it everywhere with Sourcegraph.
In complex, distributed environments, it’s important to understand the relationships between services in order to optimize application performance and troubleshoot issues. For instance, knowing which clients are making calls to a service—and what kinds of traffic to expect from them—can inform code design and resource allocation decisions. Once you enable our Sourcegraph extension, you can hover over the code for a service to see which other services are making calls to it. This way, you no longer have to crawl through heaps of code to figure out how services are connected to each other.
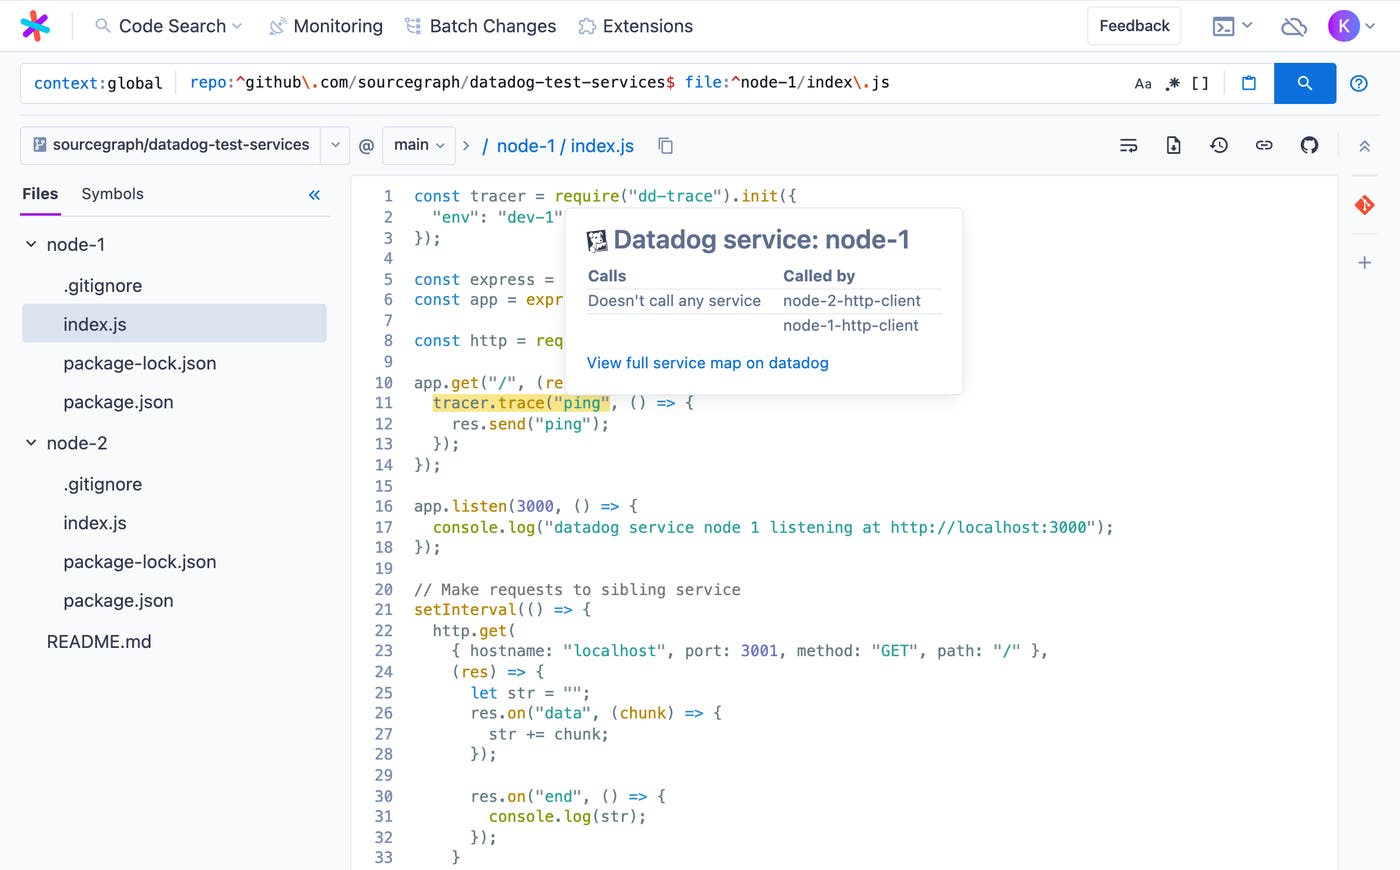
Our extension also allows you to seamlessly pivot from Sourcegraph to Datadog APM’s Service Map for a visual representation of your application’s topology. In the Service Map, each service node is accompanied by its key performance metrics—throughput, latency, and error rate—which can help you identify potential issues. For instance, if you see that a service is returning a large number of errors that are causing upstream services to fail, you can examine its request traces—as well as its logs and processes—to determine the root cause of the issue.
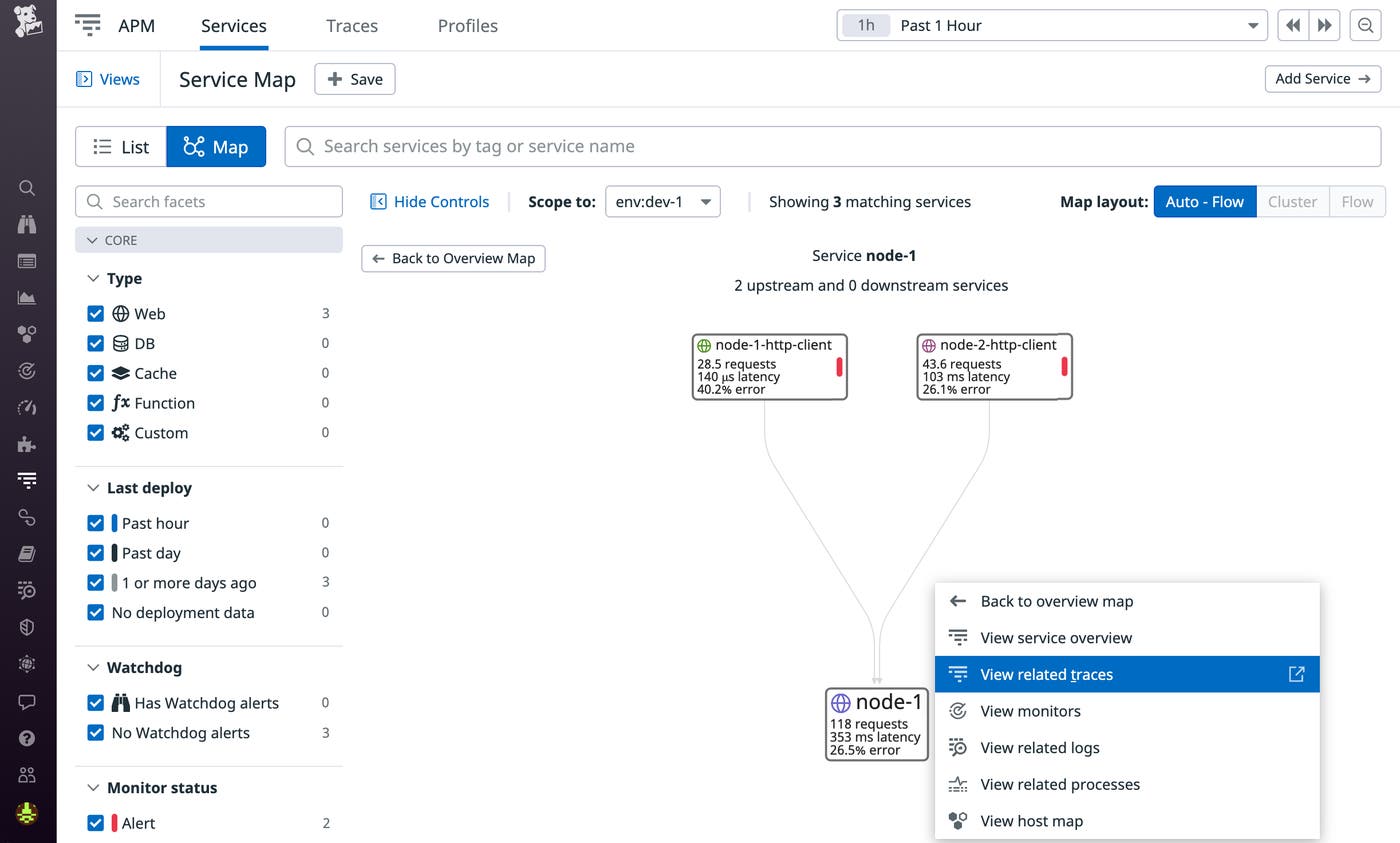
If you’re refactoring your application, you need to ensure that you’re making calls to the right endpoints as your internal APIs evolve. Just like how you can see where requests to your service are coming from, our Sourcegraph extension also allows you to identify which downstream services you’re calling. You can then drill into any of these downstream services in APM to see its full list of endpoints. Information in APM is updated in real time, so you’ll always have the latest view of your service fleet, even as the implementation of individual services continues to evolve. For instance, if you want to replace an endpoint with a newer version, you can leverage Sourcegraph’s Batch Changes to apply the change across your entire codebase—and use APM to verify that requests are, in fact, hitting the new endpoint.
The datadog-service-map extension is now available in the Sourcegraph extension registry. When used together, Datadog APM and Sourcegraph enable you to both understand your services’ health and dependencies in production—and navigate your entire codebase to fix issues quickly and precisely. If you’re not yet using Datadog to monitor your applications, sign up for a 14-day free trial today.
此内容由惯性聚合(RSS阅读器)自动聚合整理,仅供阅读参考。 原文来自 — 版权归原作者所有。