






Prashant Jain

Michael Gerstenhaber
OpenTelemetry is a Cloud Native Computing Foundation (CNCF) initiative that provides open, vendor-neutral standards and tools for instrumenting services and applications. Many organizations use OpenTelemetry’s collection of APIs, SDKs, and tools to collect and export observability data from their environment to their preferred backend.
As part of our ongoing commitment to OpenTelemetry, we are proud to have contributed our distributed tracing libraries to the CNCF community. We also offer multiple solutions to ensure that OpenTelemetry users have the flexibility to easily send their observability data to Datadog.
Today, we are pleased to expand on our commitment to OpenTelemetry by announcing official support for OpenTelemetry Protocol (OTLP) in the Datadog Agent, enabling you to reliably ingest traces and metrics from applications that have been instrumented with OpenTelemetry libraries. OTLP is a specification for encoding and transmitting telemetry data between sources, intermediaries (e.g., collectors), and backends. With native support for OTLP, the Datadog Agent now enables you to get deep visibility into your OpenTelemetry-instrumented applications without updating your code or migrating away from your existing workflows.
If you’ve instrumented your applications with OpenTelemetry libraries, you can export OTLP traces directly to the Datadog Agent (version 7.35+) through gRPC or HTTP, without installing a separate OpenTelemetry Collector. The snippet below shows how you can update your Datadog Agent configuration file (datadog.yaml) to enable the Agent to ingest OpenTelemetry traces over gRPC:
otlp_config:
receiver:
protocols:
grpc:
You can also configure trace ingestion by setting environment variables. See our documentation for Kubernetes (including Helm) and other configuration examples.
Once you’re collecting your OTLP traces, you can start visualizing and monitoring that data with Datadog APM. You can also use this method to collect OTLP-formatted metrics.
Because the Datadog Agent can also collect application profiles, network data, infrastructure metrics from 1,000+ integrations, and other telemetry from your environment, you can get rich context around your OTLP traces and gain a better understanding of your systems and applications. You can also connect traces with logs to get a more complete picture of your stack.
Alternatively, you can export OTLP traces and metrics to our platform by using the Datadog exporter and the OpenTelemetry Collector. This option helps streamline your workflows, for example, if you want to use the OpenTelemetry Collector to export telemetry data to multiple backends.
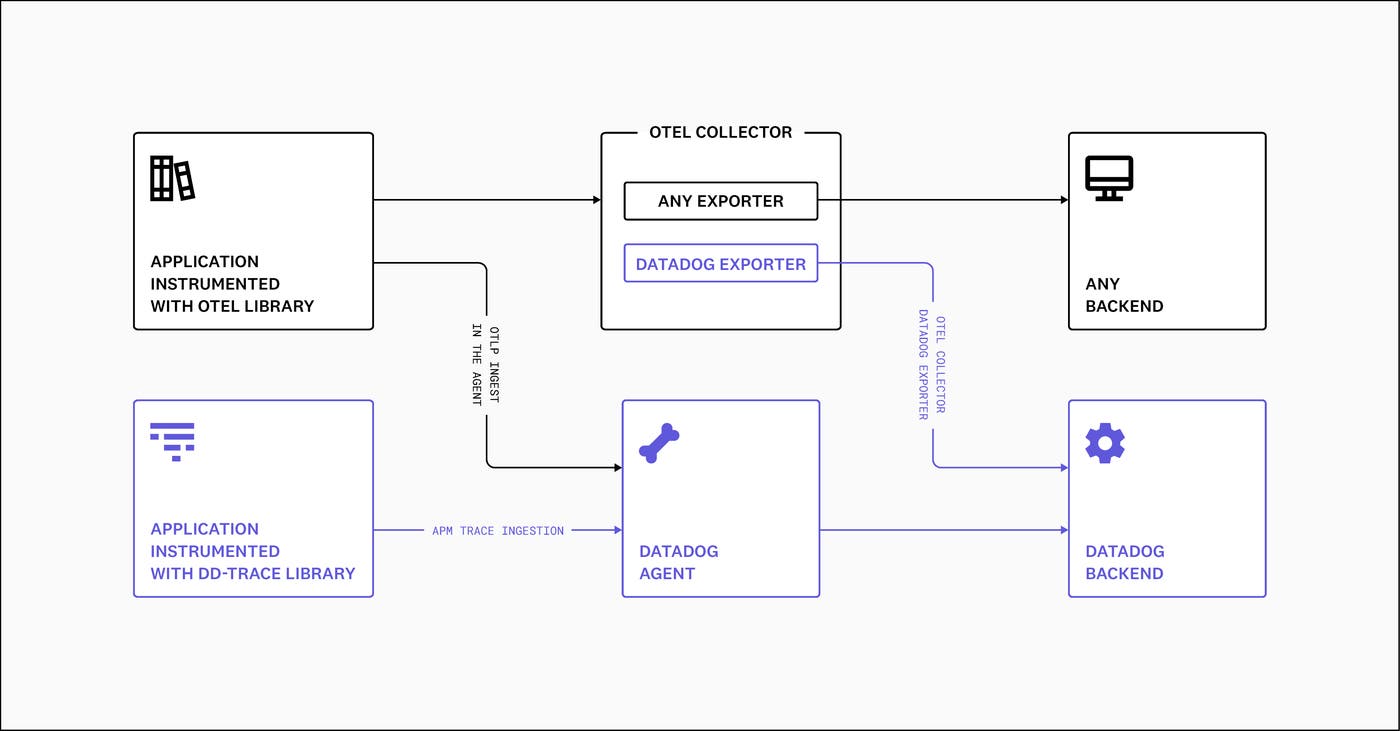
Whether you ingest OpenTelemetry data with the Datadog Agent or the Datadog exporter, Datadog APM will enable you to get deep visibility into your applications by:
Querying all your traces in real time to troubleshoot business-critical application performance issues
Visualizing dependencies to understand how data flows through your architecture by inspecting the Request Flow Map and Service Map
Understanding key insights from each service with the APM Service Page, which provides a centralized view of telemetry, SLOs, relevant incidents, deployment-tracking data, and more
Automatically detecting performance anomalies, faulty deployments, outliers, and root causes of critical failures with Watchdog, Datadog’s AI engine
Datadog is dedicated to ensuring that our users get deep visibility into their services and applications, regardless of whether they’re using our open source APM libraries, OpenTelementry SDKs, or other OpenTelemetry-compatible instrumentation methods. We are excited to continue working alongside the rest of the OpenTelemetry community to shape the future of open instrumentation by providing flexible, extensible solutions for collecting telemetry data from services and applications.
Read our documentation to learn more about the Datadog Agent’s support for OpenTelemetry. Or, if you’re new to Datadog, get started with a 14-day free trial.
此内容由惯性聚合(RSS阅读器)自动聚合整理,仅供阅读参考。 原文来自 — 版权归原作者所有。