








Stella Ma
Product Marketing Manager

Maël Lilensten
Senior Product Manager
Modern web applications rely on frameworks like Next.js, Vue, and Angular to handle routing and rendering. In these architectures, navigation happens within the application rather than through full page loads, which makes it difficult for traditional browser instrumentation to capture what users actually experience. As a result, teams often see misleading view names, missing navigations, and errors that are either misattributed or not captured at all, especially during hydration or lazy loading.
Datadog Real User Monitoring (RUM) now includes out-of-the-box integrations for Next.js, Vue, Nuxt, Angular, and TanStack Router, enabling teams to capture routing, navigation, and error data in a way that aligns with how their applications actually work. Setup requires only a single initialization at the root of your app. In this post, we’ll cover how RUM automatically captures navigation and error data by using the same semantics defined in your application code, allowing teams to attribute errors and debug faster in their favorite framework.
Once an integration is enabled, Datadog RUM reflects the structure of your application’s routes rather than raw URLs. View names are derived from route templates, such as /product/:id instead of /product/12345, so events are consistently named and easy to aggregate across users.
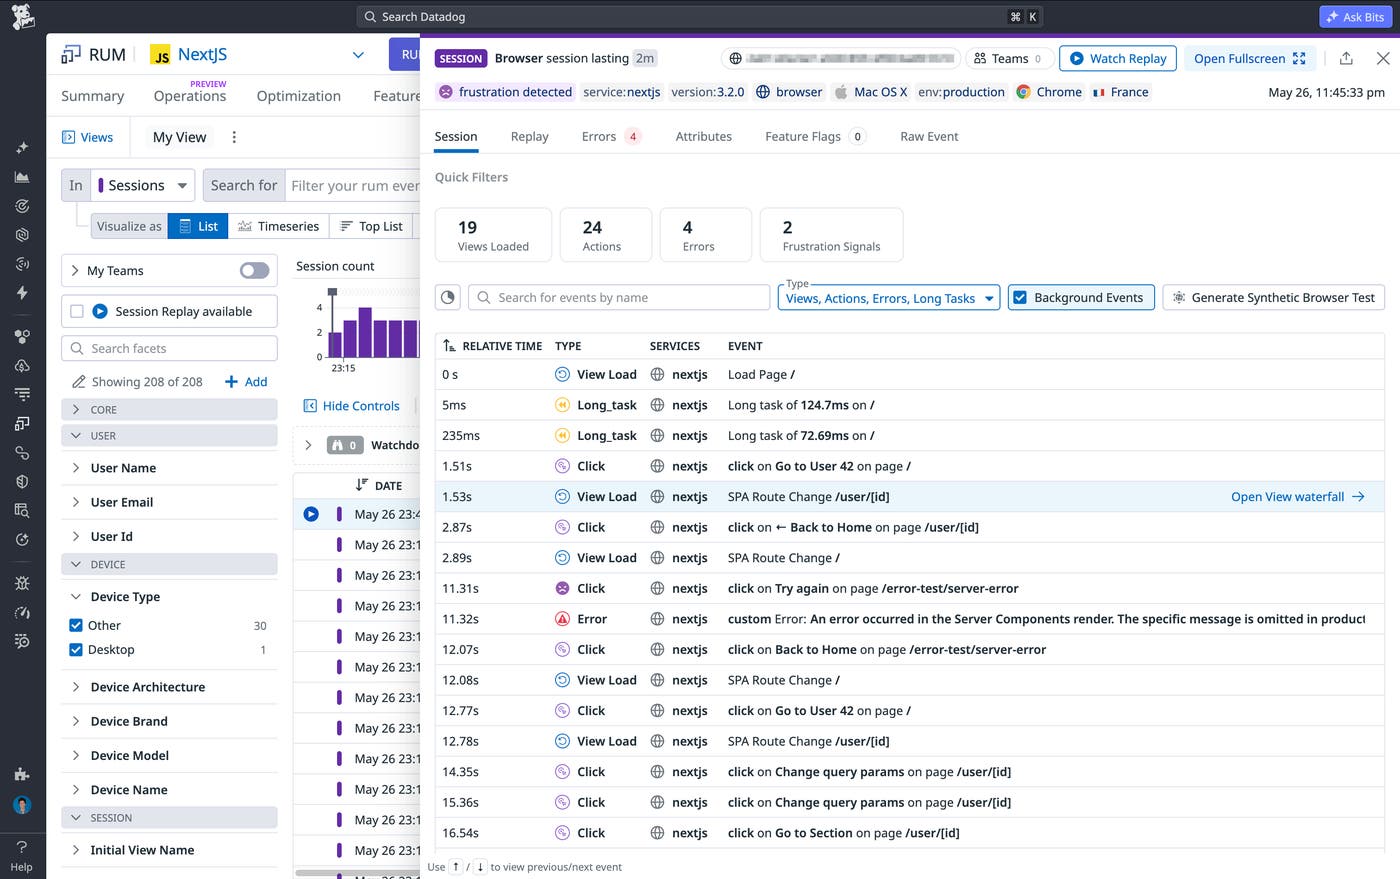
Every client-side navigation is captured as a distinct RUM view event, including transitions triggered by routing logic, redirects, lazy-loaded routes, and hydration. This eliminates gaps in session timelines and gives you a complete picture of how users move through your application. Because these events are tied to your framework’s routing system, your observability data matches the actual flow of your application rather than just the initial page load.
During an incident, you can filter errors by route template, identify affected sessions, and trace the exact sequence of navigations leading up to the issue. RUM attributes each error to the view where it occurred rather than the raw URL, so you spend less time figuring out where in the application something broke and more time understanding why.
For example, in a Next.js application, Datadog will automatically track route changes and normalize dynamic segments into a parameterized view, so a URL such as /users/123/posts/456 will have a display name of /users/[userID]/posts/[postID] in RUM. The same principle applies within a Vue application, where navigating to /users/123 generates a view named /users/:id using Vue Router’s definitions as a source of truth.
Datadog RUM integrations for Next.js, Vue, Nuxt, Angular, and TanStack Router provide frontend teams accurate, router-aware observability across JavaScript applications. Each integration hooks into your framework’s router directly, so navigation events, view names, and errors reflect the structure of your code rather than raw browser URLs. See the Datadog documentation for setting up RUM integrations with your framework of choice. To start monitoring Javascript frameworks, sign up for a 14-day free Datadog trial.
此内容由惯性聚合(RSS阅读器)自动聚合整理,仅供阅读参考。 原文来自 — 版权归原作者所有。