




惯性聚合 高效追踪和阅读你感兴趣的博客、新闻、科技资讯
阅读原文 在惯性聚合中打开

推荐订阅源

H
Help Net Security
爱范儿
爱范儿
V
Visual Studio Blog
Last Week in AI
Last Week in AI
阮一峰的网络日志
阮一峰的网络日志
雷峰网
雷峰网
Hugging Face - Blog
Hugging Face - Blog
博客园 - 【当耐特】
freeCodeCamp Programming Tutorials: Python, JavaScript, Git & More
博客园 - 三生石上(FineUI控件)
博客园 - Franky
博客园 - 叶小钗
OSCHINA 社区最新新闻
OSCHINA 社区最新新闻
The Cloudflare Blog
大猫的无限游戏
大猫的无限游戏
人人都是产品经理
人人都是产品经理
M
MIT News - Artificial intelligence
罗磊的独立博客
L
LangChain Blog
Jina AI
Jina AI
IT之家
IT之家
J
Java Code Geeks
Microsoft Azure Blog
博客园_首页

Datadog | The Monitor blog

Introducing our open source AI-native SAST Instrument and monitor Boomi integration flows with OpenTelemetry and Datadog Not all index scans are equal: How we cut query latency by over 99% Platform engineering metrics: What to measure and what to ignore Integrate Recorded Future threat intelligence with Datadog Cloud SIEM CI/CD security: threat modeling using a MITRE-style threat matrix CI/CD security: How to secure your GitHub ecosystem Ingress NGINX is EOL: A practical guide for migrating to Kubernetes Gateway API Operating agentic AI with Amazon Bedrock AgentCore and Datadog LLM Observability: Lessons from NTT DATA Introducing the Datadog Code Security MCP Capture and analyze custom heatmaps in Session Replay Understand session replays faster with AI summaries and smart chapters Monitor ClickHouse query performance with Datadog Database Monitoring How we designed empathetic alert sounds for on-call engineers Search and act across Datadog to resolve issues faster with Bits Assistant Measure the business impact of every product change with Datadog Experiments Analyzing round trip query latency Configuring JavaScript caches for better performance Introducing Bits AI Dev Agent for Code Security Datadog achieves ISO 42001 certification for responsible AI Monitor Nutanix clusters, hosts, and VMs with Datadog Monitor Juniper Mist in Datadog A new Host Map for modern infrastructure Annotate traces to improve LLM quality with Datadog LLM Observability What’s new in Cloud SIEM: AI-powered investigations, enhanced threat intelligence, and scalable security operations Explore Kubernetes with native OpenTelemetry data Monitor Oracle Fusion Cloud Applications with Datadog Announcing the Datadog Terraform provider v4.0.0 Scaling Kubernetes workloads on custom metrics How to design cloud environments for AI-powered threat analysis
Monitor AWS SES with Datadog
Abril Loya McCloud · 2016-06-10 · via Datadog | The Monitor blog
Abril Loya McCloud

Abril Loya McCloud

Amazon Simple Email Service (SES) is a scalable, affordable email service for outbound emails. SES provides a flexible SMTP or API-based email solution that can easily scale to any size.

As part of AWS, SES integrates with several AWS services you may already be using. These services include, but are not limited to: EC2 instances, Elastic Beanstalk, AWS SNS, AWS S3, AWS KMS, CloudTrail, and the Management Console. Its affordability, reliability, and native integration with other AWS services make SES a highly popular outbound mass email service.

Datadog integrates with AWS SES, allowing you to receive alerts on all aspects of your SES performance.

Monitor AWS SES

When you integrate SES with Datadog, you can monitor your SES metrics according to their respective importance to filter out noise.

The available SES metrics and how they appear in Datadog are listed below:

MetricDescription
aws.ses.max24hour_sendMaximum number of emails that can be sent in a 24 hour period
aws.ses.sentlast24_hoursThe total number of emails sent in the past 24 hours
aws.ses.bouncesThe number of hard bounces
aws.ses.complaintsThe number of complaints
aws.ses.deliveryattemptsThe number of delivery attempts
aws.ses.rejectsRejected send attempts

You can create visualizations to keep track of these metrics over time. These graphs give you better insight into trends in your SES performance and allow you to annotate and collaborate with your team in the case of abnormalities.
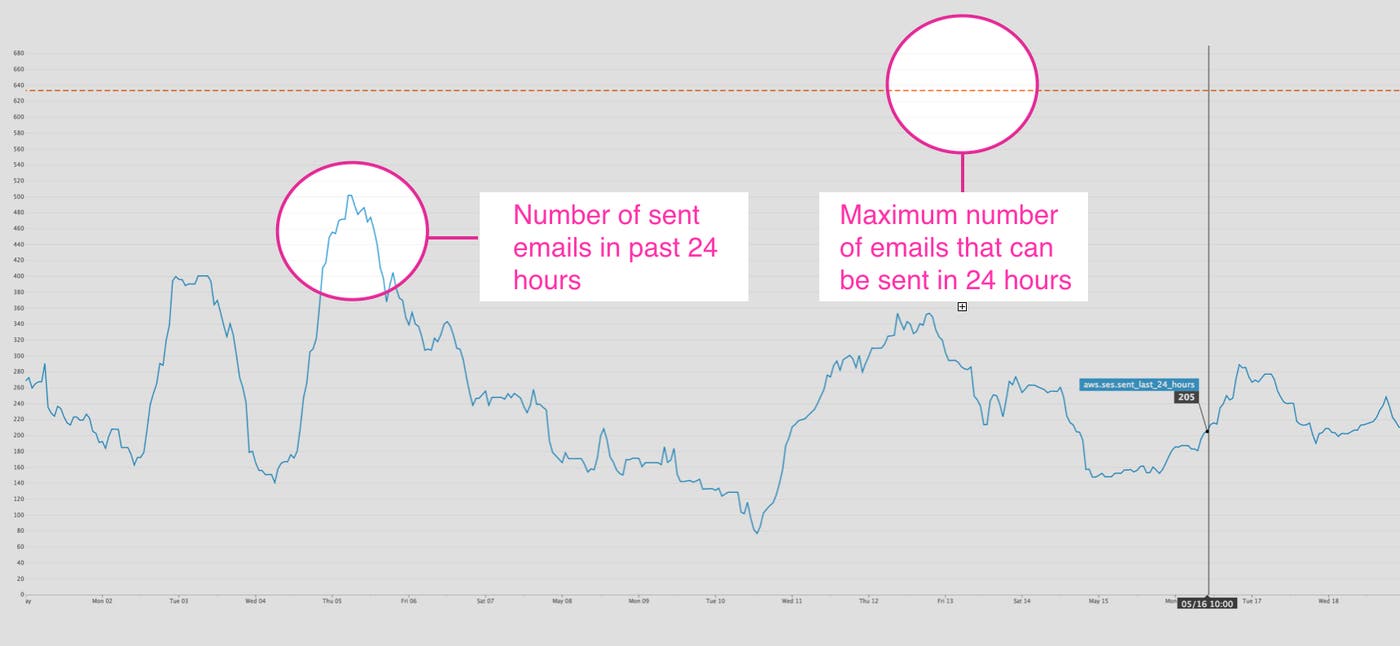
monitor aws ses image

Set up

Integrating AWS SES with Datadog is just a click away if you are already set up with the main AWS integration.

Verify that you’ve entered the AWS credentials for each AWS account you would like to send data into Datadog, then click on the AWS SES checkbox under ‘Limit metric collection’ and update your configuration. Once you’ve enabled SES, Datadog will automatically begin to gather your metrics.

Get started

If you’re already a Datadog customer using AWS SES, you can try out the integration today. Otherwise, sign up for a Datadog trial. For information on how to optimally set up monitoring for other AWS technologies you may be using, check out our other AWS articles.