








Datadog CI Visibility provides critical visibility into your organization’s CI/CD workflows. CI Visibility complements Datadog’s turn-key CI provider integrations and the integration of synthetic tests in CI pipelines to give you deep insight into key pipeline metrics and help you identify issues with your builds and testing.
With modern agile development methods and advances in CI/CD automation, organizations are able to build and ship releases quickly and regularly to deliver new value to customers. But without granular visibility into the performance of their pre-production testing and deployment pipelines, organizations can experience development outages due to slow builds or increases in failing or flaky tests.
Datadog CI Visibility helps you understand the performance of your CI pipelines, making it easy to identify issues—like error-prone jobs or flaky tests that cause your builds to fail randomly—and enabling you to make your CI workflows faster and more reliable. In this post, we’ll discuss how you can use CI Visibility to:
Monitor pipeline builds, stages, and jobs to locate problems
Track test performance and identify flaky tests
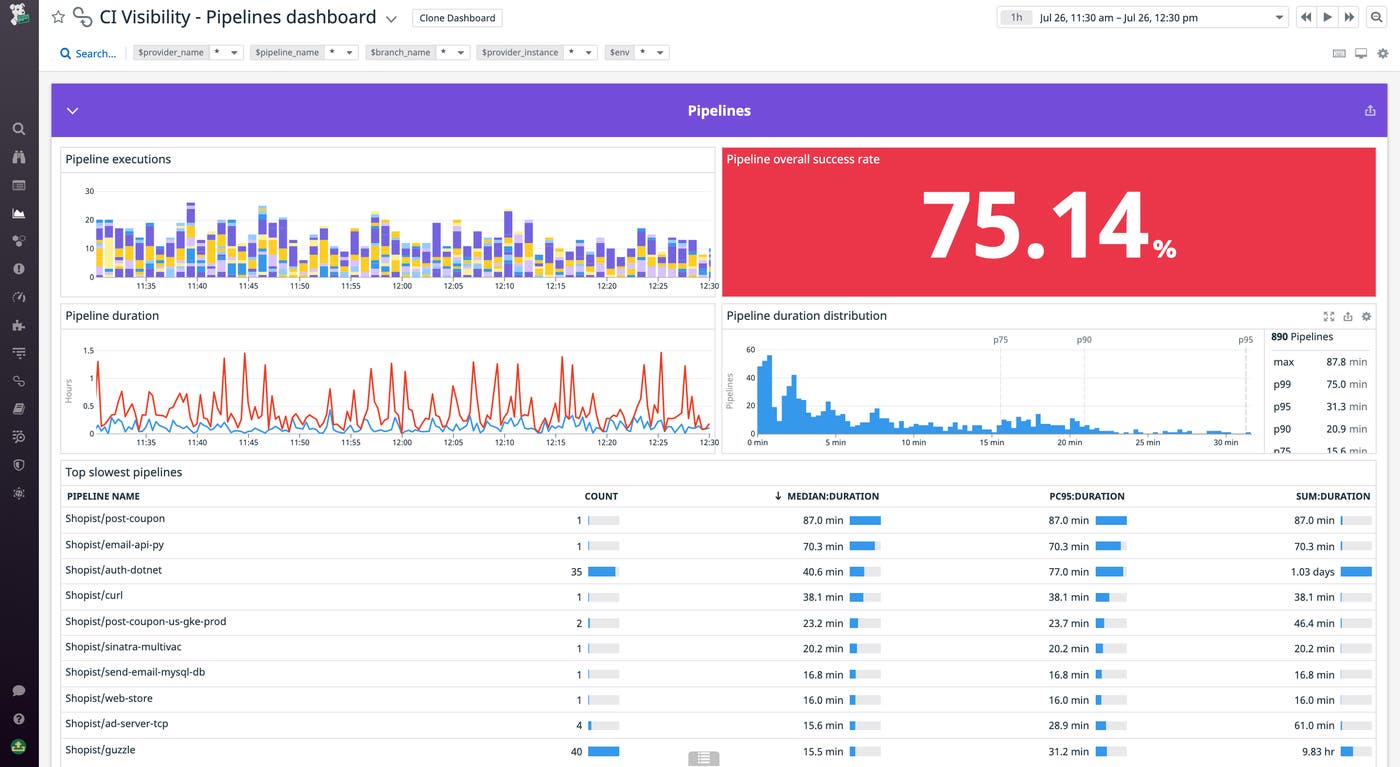
Datadog CI Visibility provides comprehensive visibility into all your pipelines—across CI providers—by generating key performance metrics to help you understand, for example, which pipelines, build stages, or jobs are run the most, how often they fail, and how long they take to complete. Datadog visualizes this information in a customizable out-of-the-box Pipelines dashboard. This gives you a high-level overview of performance across all your pipelines, stages, and jobs so you can track trends at a glance and identify where to focus your troubleshooting efforts.
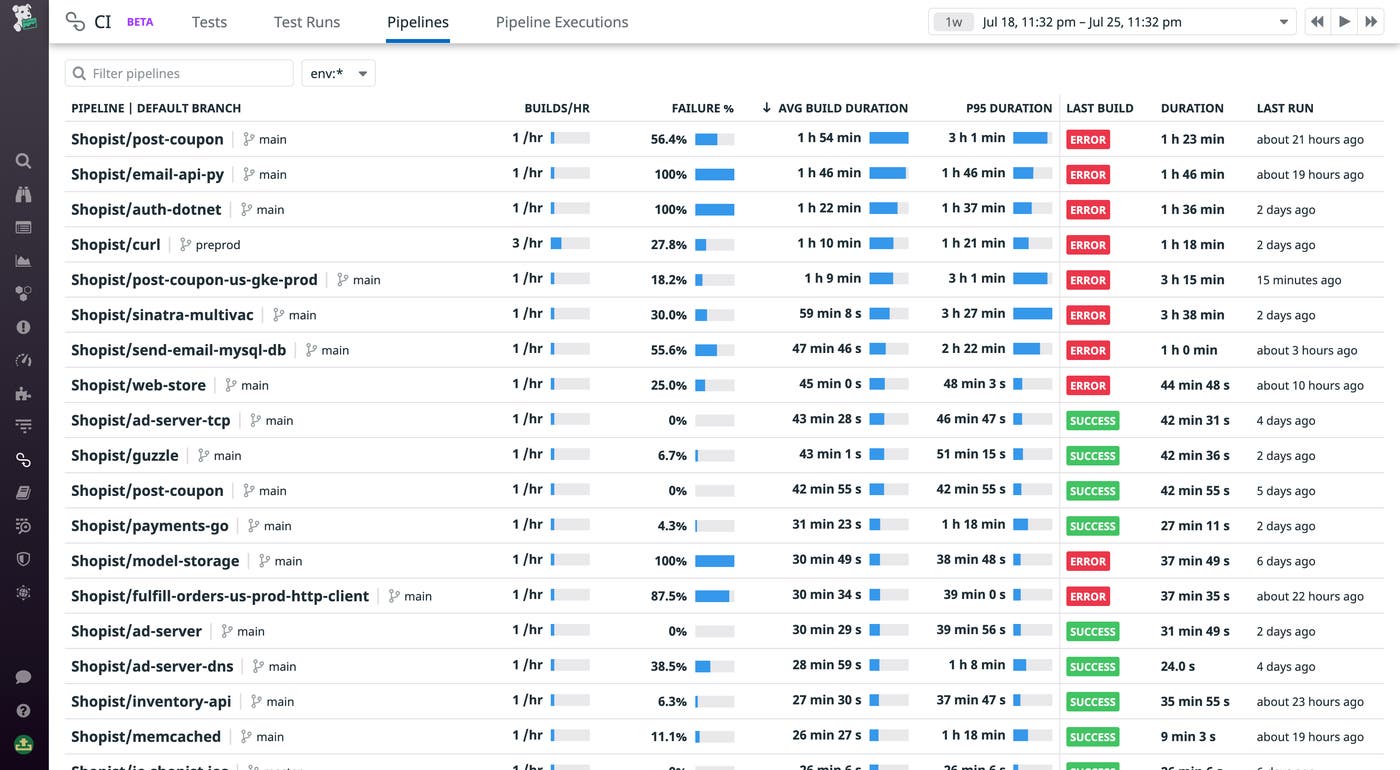
The Pipelines Visibility page provides more granular insight into your CI workflows by breaking down health and performance metrics by pipeline. You can sort and filter the list to quickly surface which pipelines are the slowest or experience the most errors. In the example below, we have sorted pipelines by average build duration to show which ones are the slowest.
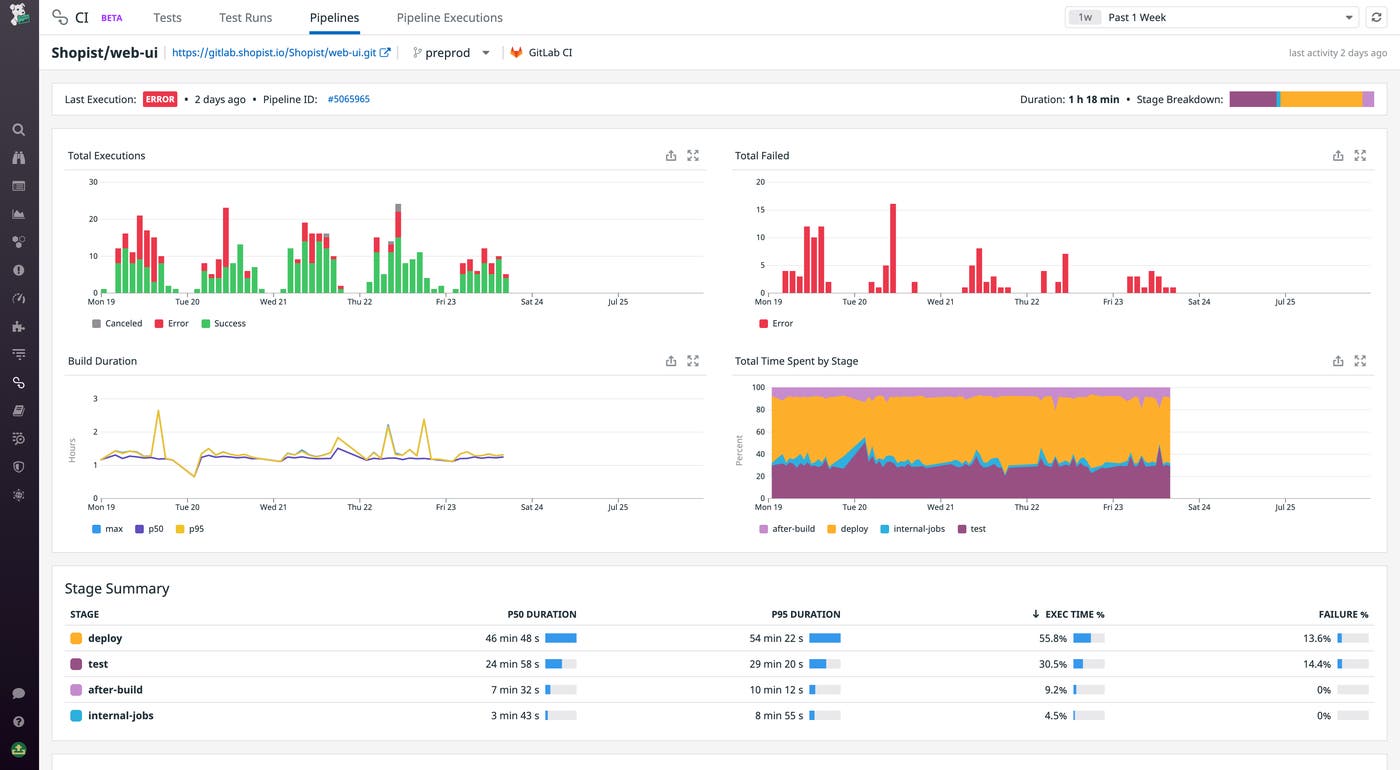
Once you’ve identified a pipeline with a high error rate or long build duration, you can drill into it to get more detailed information about its performance over time. The pipeline summary shows a breakdown of duration and failure rates across the pipeline’s individual stages and jobs to spot where slowdowns or failures might be occurring.
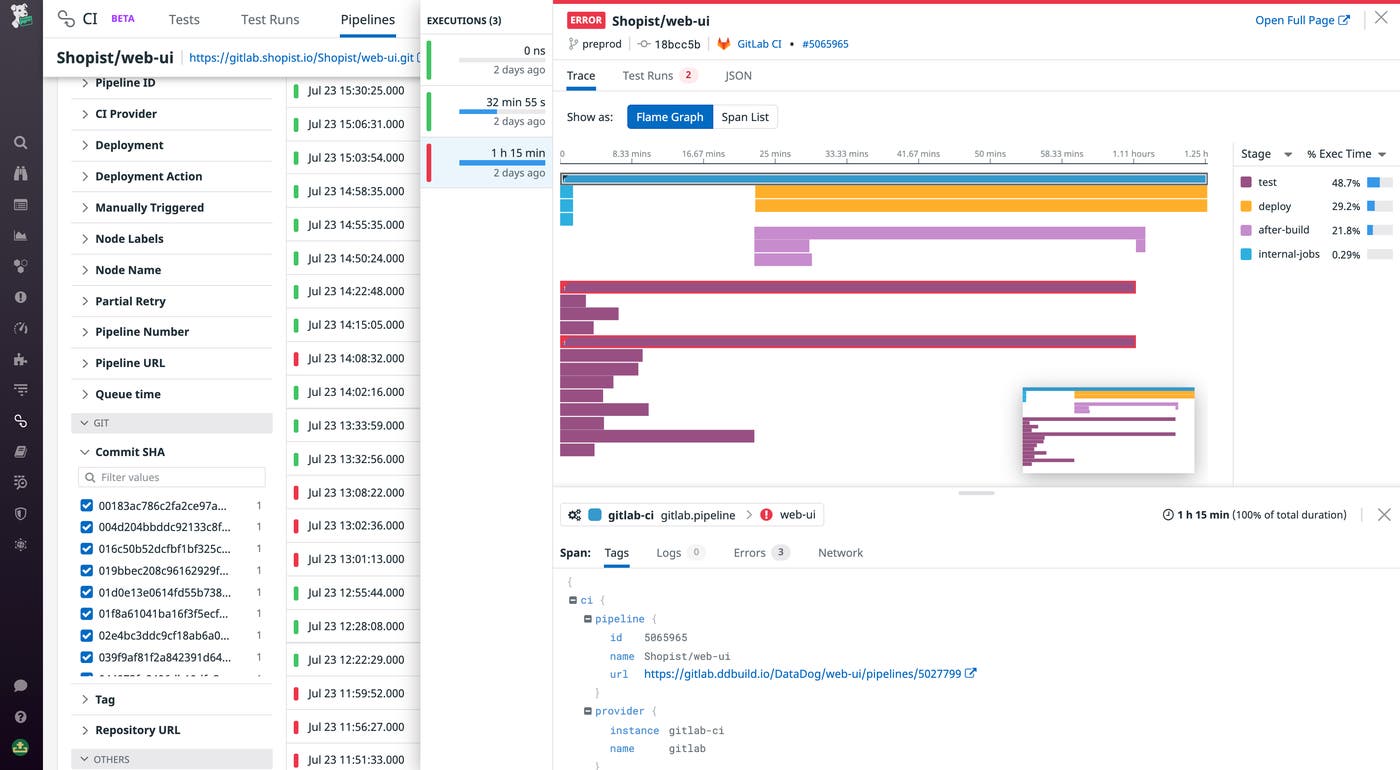
A pipeline’s summary includes a table of all of that pipeline’s executions. You can easily filter your executions by key attributes like branch, status, and duration, or scope the table to a specific stage or job.
CI Visibility works with some of the most popular solutions, including GitLab, GitHub Actions, Jenkins, CircleCI, and Buildkite. Once you’ve integrated Datadog with your CI provider, Datadog automatically instruments your pipelines. This means that, if you spot a slow or failing build and need to understand what’s happening, you can drill into a flame graph visualization of the build to look for high duration or errorful jobs. Then, you can dive into the error details to understand the source of the error, or look in the tags for the job URL to find the context you need to identify and remediate the underlying issue.
Monitoring your tests is key to identifying faulty tests and understanding overall test suite performance. With Datadog CI Visibility, you can easily monitor your tests across all of your builds to surface common errors and visualize test performance over time to spot regressions. In the Tests page, you can see each of your services’ test suites along with the corresponding branch, duration, and number of fails, passes, and skips. Datadog also tracks the number of new flaky tests, or tests that variably pass and fail for the same commit, which were previously unseen in the default branch.
Flaky tests can compromise the effectiveness of your testing and break builds seemingly at random. Locating and debugging flaky tests is important for ensuring the reliability of your test suites. Datadog automatically detects when commits introduce flaky tests and displays that data for the relevant branch.
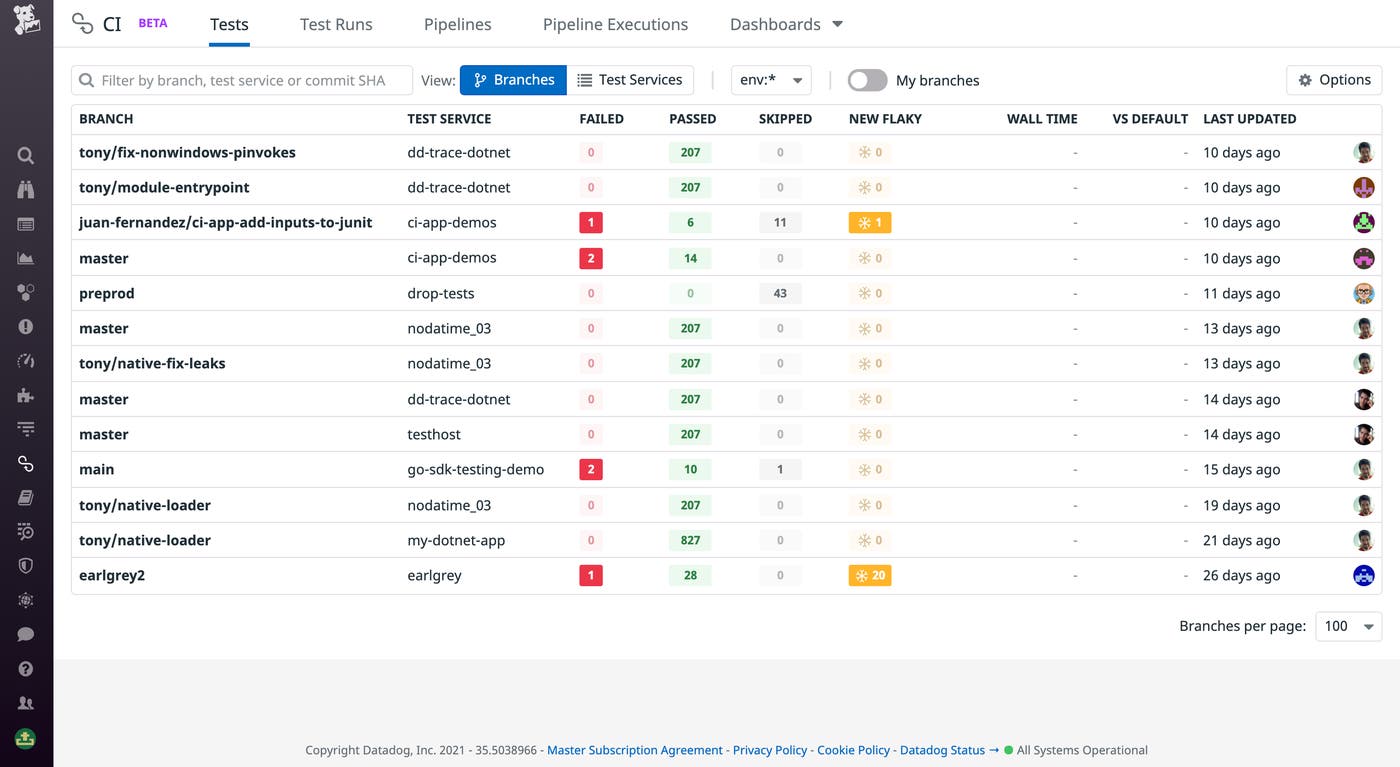
Once you’ve spotted a branch with new flaky tests to examine, you can dive into the commit overviews for that service. Looking at the Latest Commit Overview, you can see which tests failed and the most common errors between them.
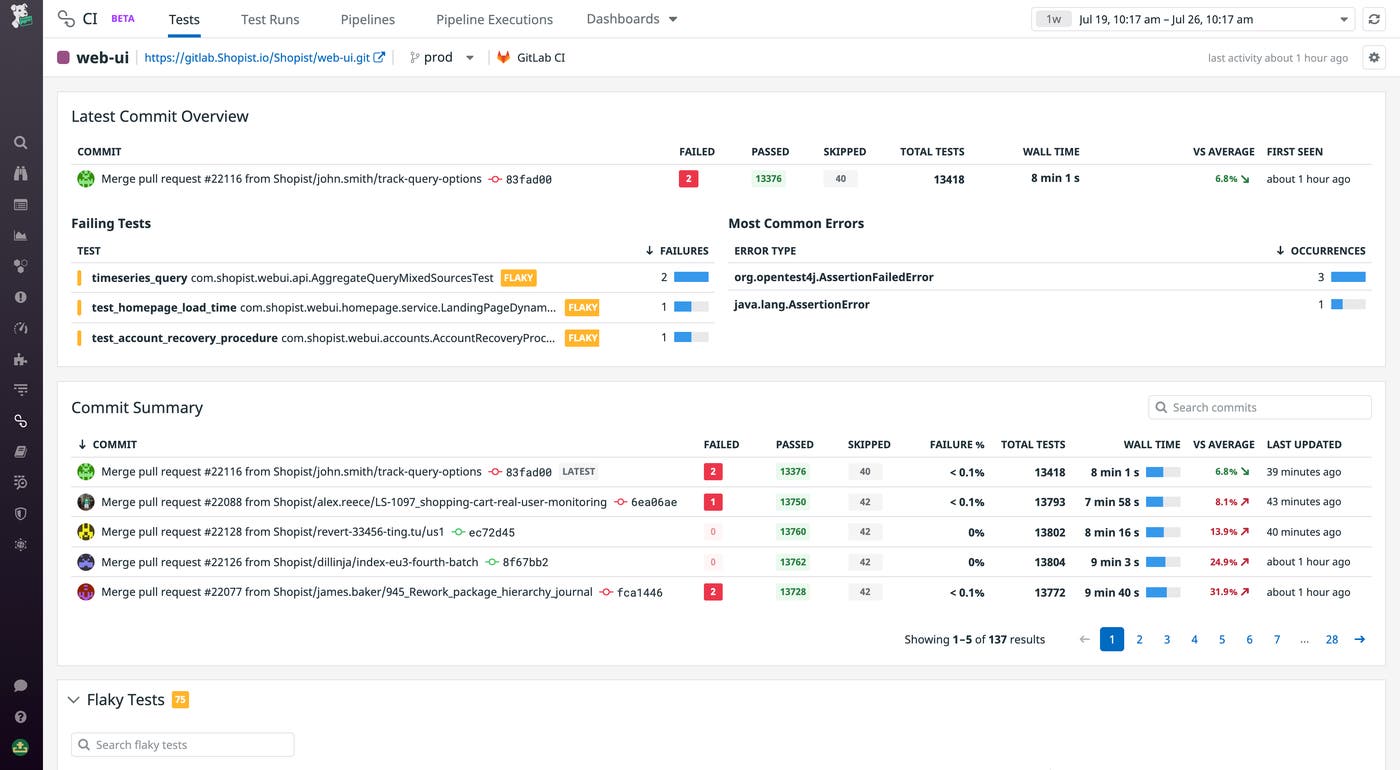
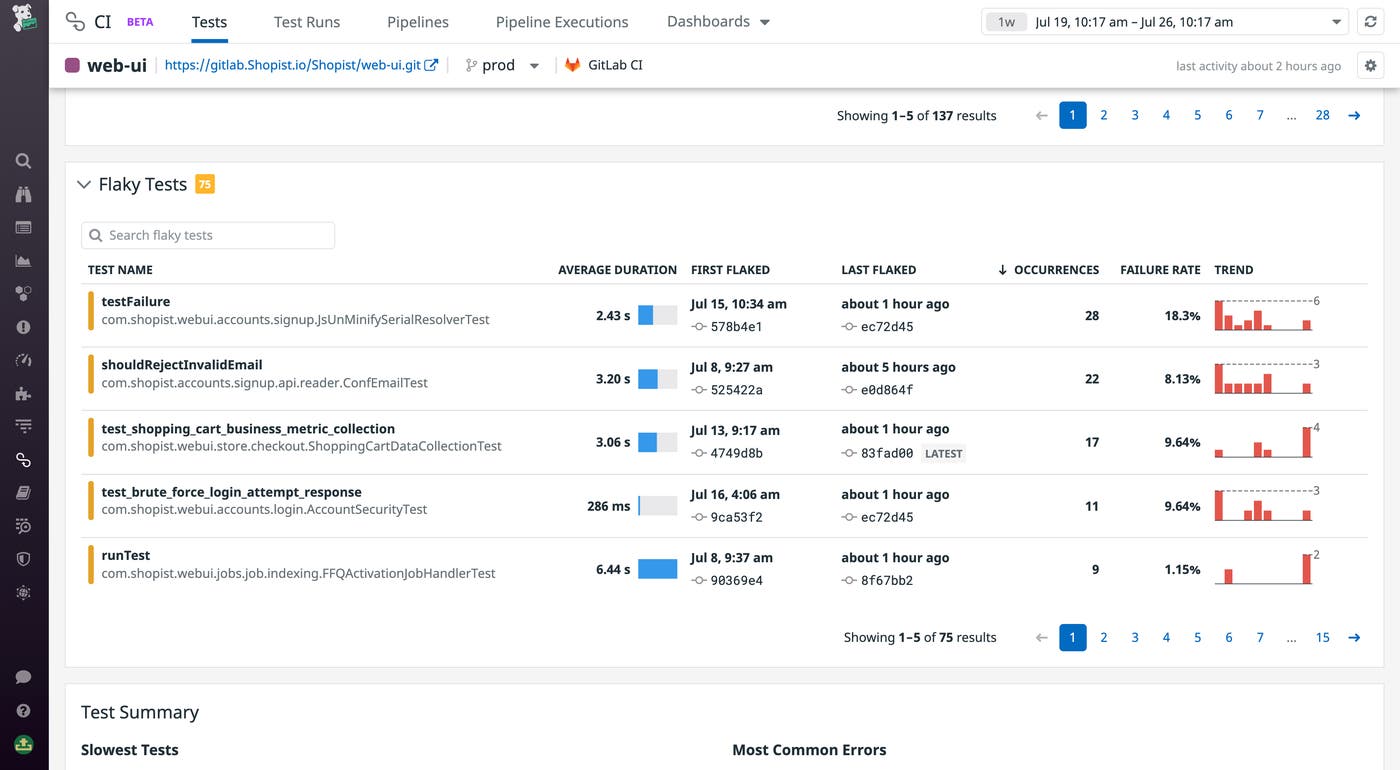
The Flaky Tests summary surfaces all the tests in this service’s test suite that flaked. Selecting a test row, you can view runs of the test from the commit that first flaked, which is likely to contain the code change responsible for making the test flaky.
Just like it does with pipelines, CI Visibility automatically instruments each of your tests so you can trace them end-to-end without spending time reproducing test failures. For example, once you’ve found a flaky test you want to debug, you can drill into the test trace for more information. Using the flame graph, you can, for example, easily find the point(s) of failure in a complex integration test. Clicking on an errorful span, you can examine the stacktrace along with related error messages to examine what caused the test to fail in that instance. For more context, Datadog links to the relevant pipeline so you can jump into your CI provider to examine the console output from the test run.
Datadog CI Visibility enables you to fill in the pre-production observability gap, giving you visibility into your test performance so you can ensure your tests will catch performance issues before they reach customers, while also empowering you to manage your pipelines to save precious developer time and computing resources. Combined with Datadog’s extensive support for synthetic testing within your CI, you can use Datadog to shift full-stack observability to the left, nipping outages and regressions in the bud.
CI Visibility is now GA for all customers. To get started with CI Visibility, see our documentation for detailed installation steps. Or, if you’re brand new to Datadog, sign up for a 14-day free trial to get started.
此内容由惯性聚合(RSS阅读器)自动聚合整理,仅供阅读参考。 原文来自 — 版权归原作者所有。