









John Matson
Microsoft Azure is the second-largest cloud provider in the world and is especially popular among enterprise companies. Though its market share is much smaller than that of Amazon Web Services (AWS), Azure adoption is growing rapidly.
Datadog makes it simple to monitor all the components of your infrastructure, whatever platform you choose. And now you can easily monitor Azure SQL Database performance and usage alongside all your Azure VMs and the rest of your hosts, apps, and services.
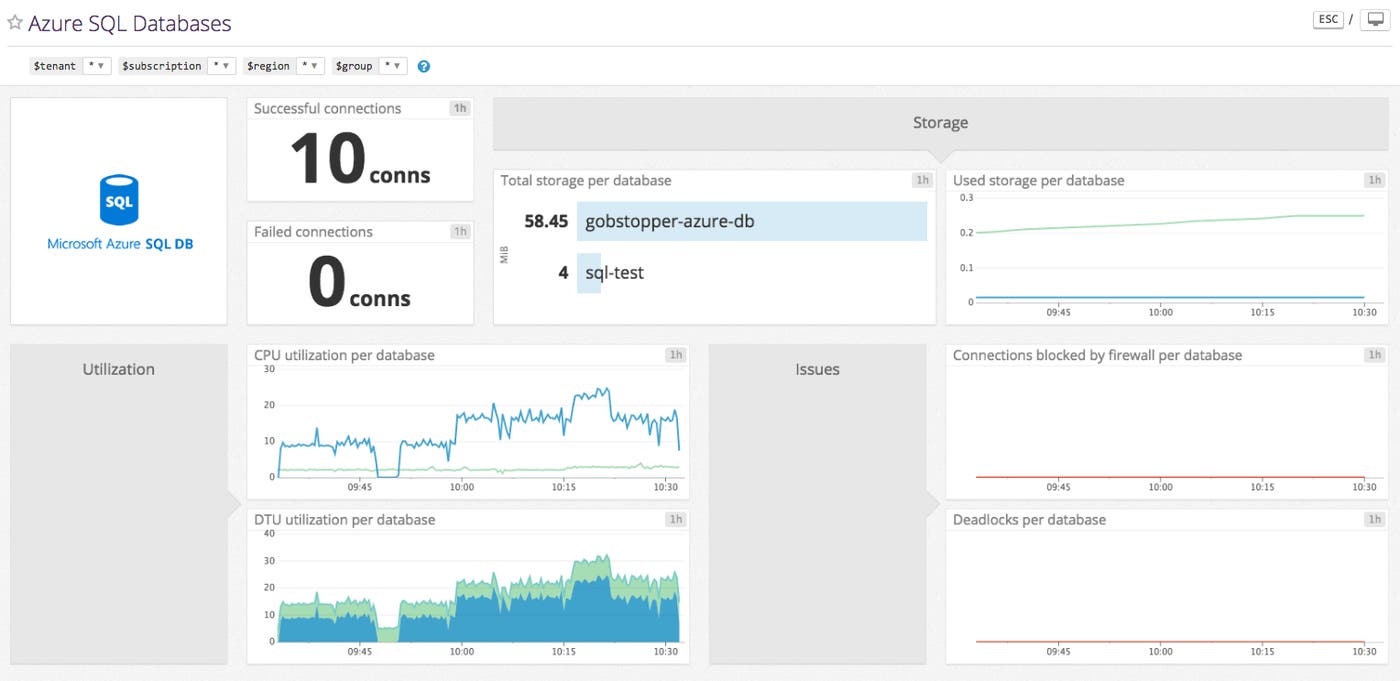
Azure SQL Database is a hosted relational database service on the Azure cloud platform. The general-purpose database service is akin to Amazon’s Relational Database Service (RDS), although the Azure service presently offers only one database engine, which is based on Microsoft’s SQL Server.
Like most cloud services, Azure SQL Database is designed to be scalable and easy to manage. It also automatically analyzes the design and usage patterns of your database to provide recommendations for performance improvements. For instance, Azure might recommend that you create an index to support your typical workload or that you parameterize your queries so that common query patterns can be cached rather than compiling similar queries over and over again.
Datadog’s integration with Azure SQL Database pulls in key metrics about your database’s utilization, client connections, and resource consumption (CPU, storage, I/O, etc.), plus metrics to aid in troubleshooting, such as the count of deadlocks. Datadog also captures key metrics pertaining to a unique measurement unit for Azure databases: the DTU.
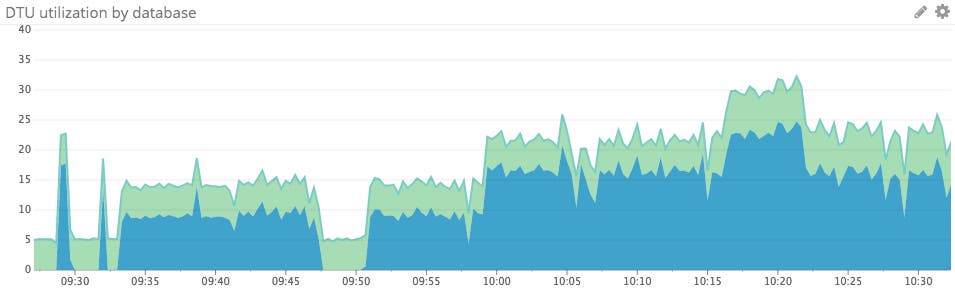
Each Azure SQL Database is assigned a certain number of Database Transaction Units (DTU), based on your chosen service tier and performance level. The DTU is a composite unit, intended to quantify a database’s relative capacity to do work. As explained in Microsoft’s documentation: “We took a set of operations that are typical for an online transaction processing (OLTP) request, and then measured how many transactions could be completed per second under fully loaded conditions.” Azure SQL Databases range from 5 DTUs for a “basic” tier database, to 1,750 DTUs for a “premium” P11 database.
With Datadog, you can see the provisioned DTU limit for each Azure SQL Database, the number of DTUs used, and each database’s DTU consumption as a percentage of the limit. With these metrics you can ensure that your database is properly sized to handle your workload, and can identify when it’s time to scale up to a higher performance level.
The Azure Resource Manager (ARM) deployment model allows you to organize Azure cloud services (VMs, databases, web apps, etc.) into cohesive groups. You can then deploy and manage those resources in groups, rather than individually. So, for instance, you can apply consistent access rules across all the resources in a group, or you can segment your billing data by group to isolate the infrastructure costs of a particular application. You can also use declarative templates to deploy resources to a group in a consistent, repeatable way.
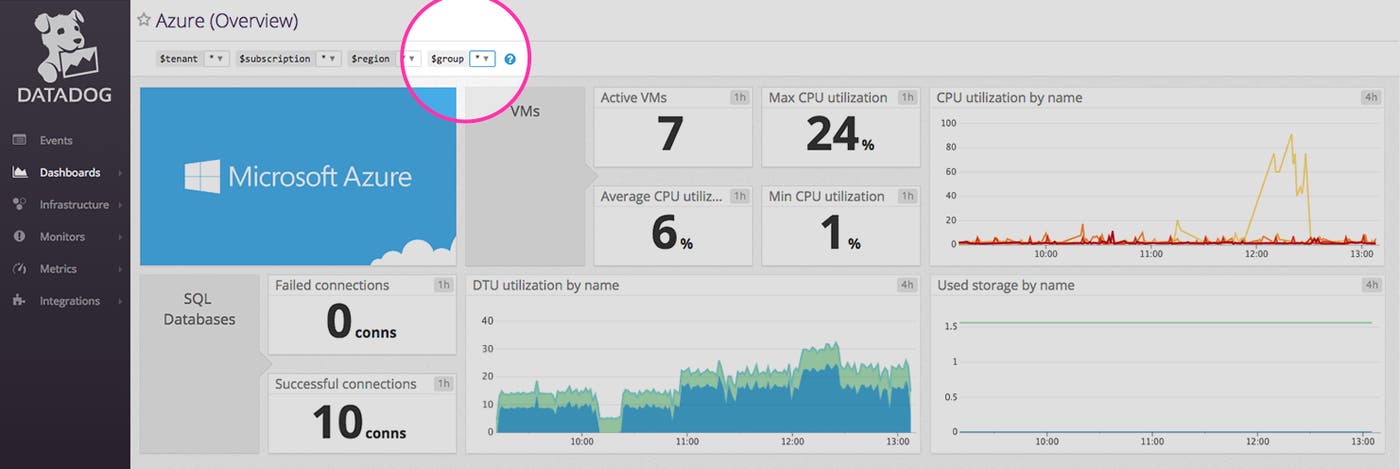
Datadog naturally accommodates the ARM model via tags. All your ARM metrics in Datadog are automatically tagged by resource_group so you can easily filter and aggregate your metrics at that level. For instance, using our Azure Overview dashboard, you can see a bird’s-eye view of your entire Azure infrastructure, or focus in on one resource group by selecting that group’s name from the dropdown menu.
If you’re already using Datadog, you can configure Azure to report all your VM and SQL Database metrics by following the steps outlined here. If you’re new to Datadog, you can try out our new Azure monitoring features by signing up for a free trial.
此内容由惯性聚合(RSS阅读器)自动聚合整理,仅供阅读参考。 原文来自 — 版权归原作者所有。