










Adrian Vaschalde
Like most development teams, you are probably using shared code repositories like Bitbucket and GitHub to build and deploy your code. But what if a code change creates performance issues on your live system? The last thing you want to do is waste time determining which commit may have caused the problem.
Good news: Datadog’s Bitbucket integration helps your team quickly pinpoint issues caused by code changes. You can correlate code commits with any metric you already monitor with Datadog, whether it comes from a database, application, or cloud service. You can also collaborate with team members on code commits, issues, and pull requests, right from Datadog’s event stream.
Datadog’s Bitbucket integration helps you visualize and monitor code changes in one place. After you activate the Bitbucket integration, commits, pull requests, and issues will appear in Datadog’s event stream. Our search-and-filter functionality enables you to filter events to find the ones that matter to you at any given moment, as shown below.

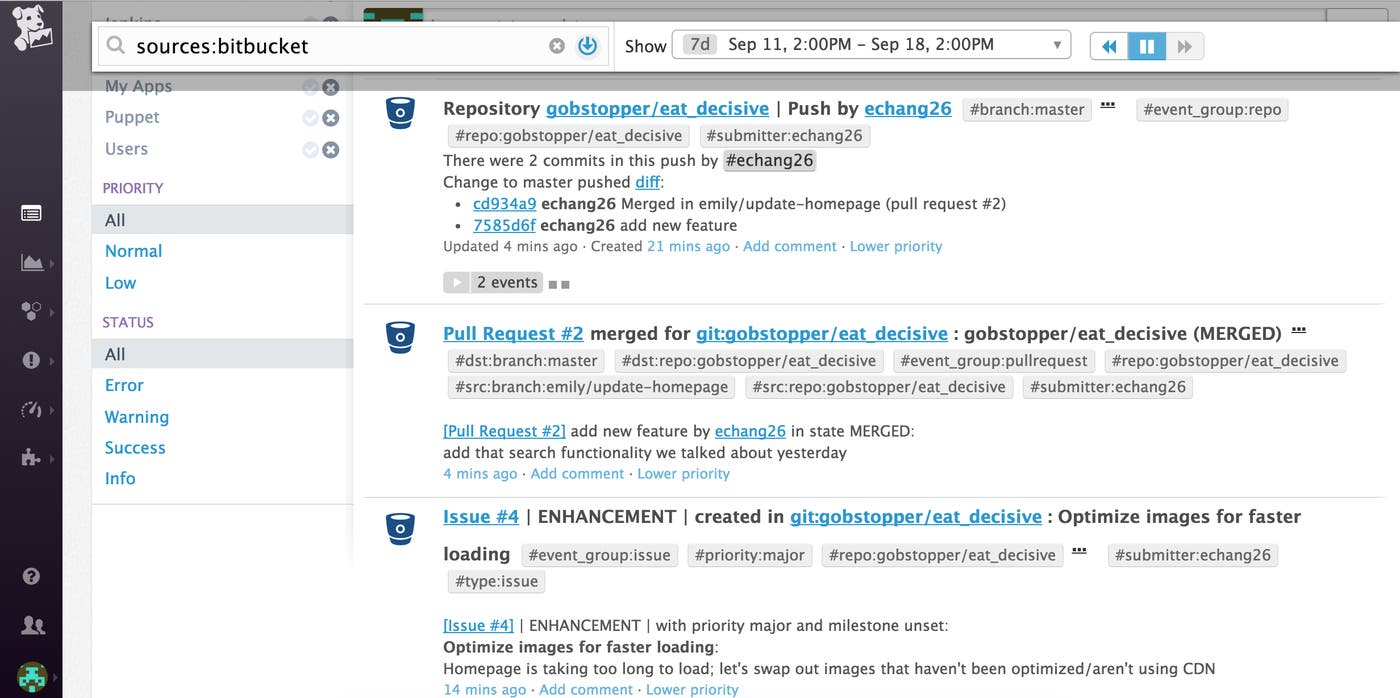
You can also overlay Bitbucket events on your timeboards in order to correlate them with performance metrics from any other integration. Thus you can quickly spot when a code commit may have caused a performance issue, or whether a code fix had its intended result.
To see it in action, go to any Datadog timeboard and enter “sources:bitbucket” in the search box at the top. You can also filter by the repo tag to view information from a single repository.

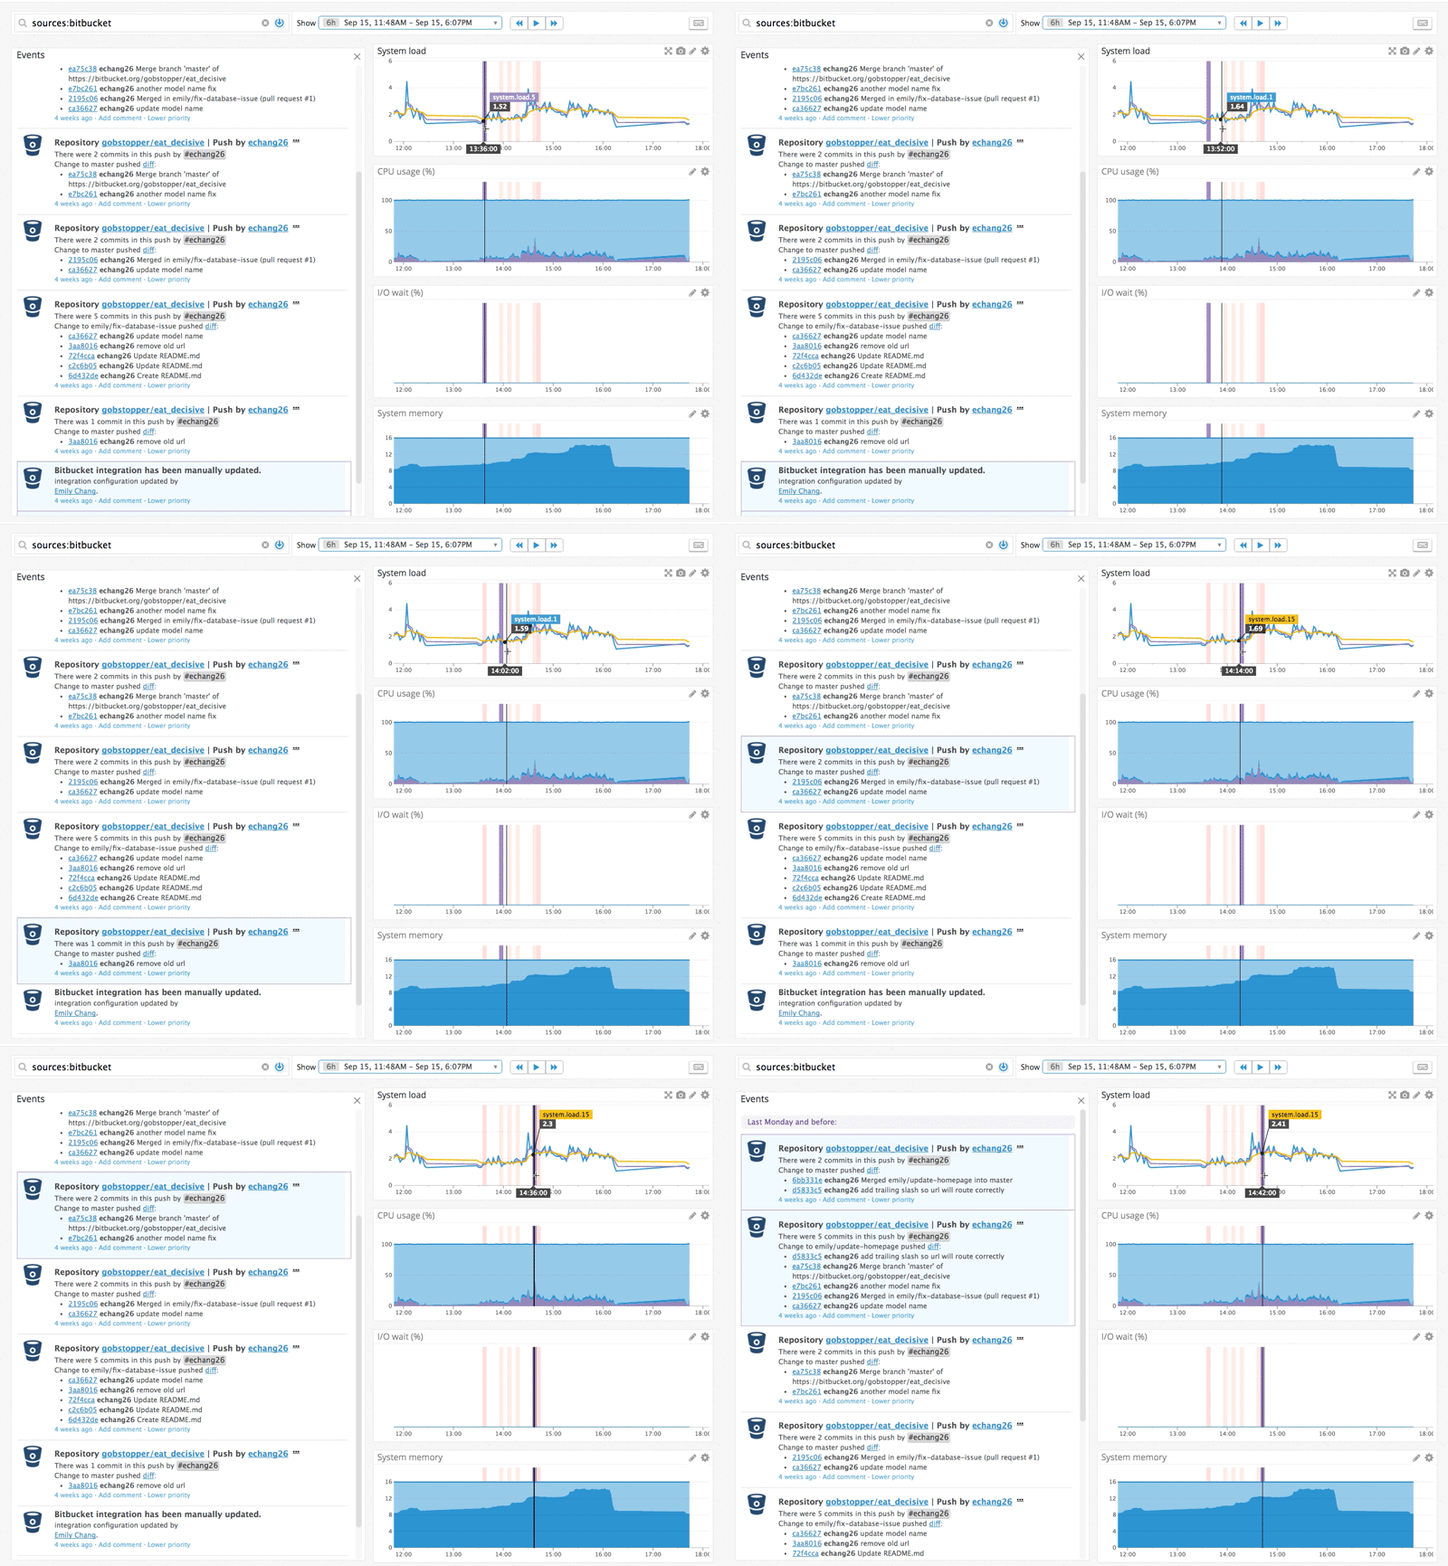
As shown above, each of the pink bars on the graphs represents a Bitbucket event from the specified repository.
Our integration helps you keep track of commits, merged and open pull requests, and issues. Each pull request is tagged with its destination and source information (dst:repo, dst:branch, src:repo, and src:branch). Issues are tagged with the repo and the priority they were assigned in Bitbucket. Each pull request, issue, or commit will link to the corresponding page in Bitbucket, so you can look at it in further detail as needed.
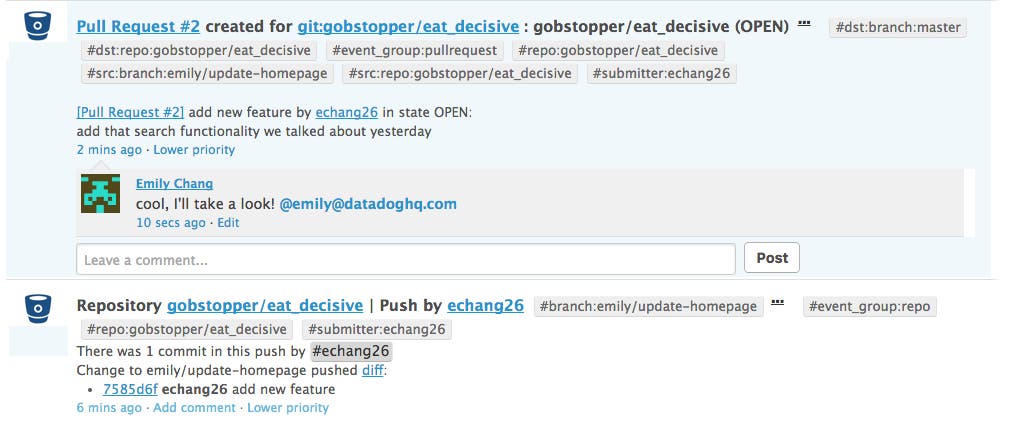
To make sure everyone is on the same page, you can configure the integration to show any comments previously made on Bitbucket issues, commits, and pull requests, as shown below.


From there, it’s easy to continue the conversation right from the event stream. Datadog’s @notification feature allows you to directly comment and mention relevant team members. Notifications can also be sent to messaging systems like PagerDuty and OpsGenie, and chat platforms like HipChat and Slack.

To set up the integration, navigate into the Bitbucket integration tile in Datadog. Add the names of any repositories you wish to track, and check off the actions you wish to monitor (pull requests, commits, and issues), as shown below.

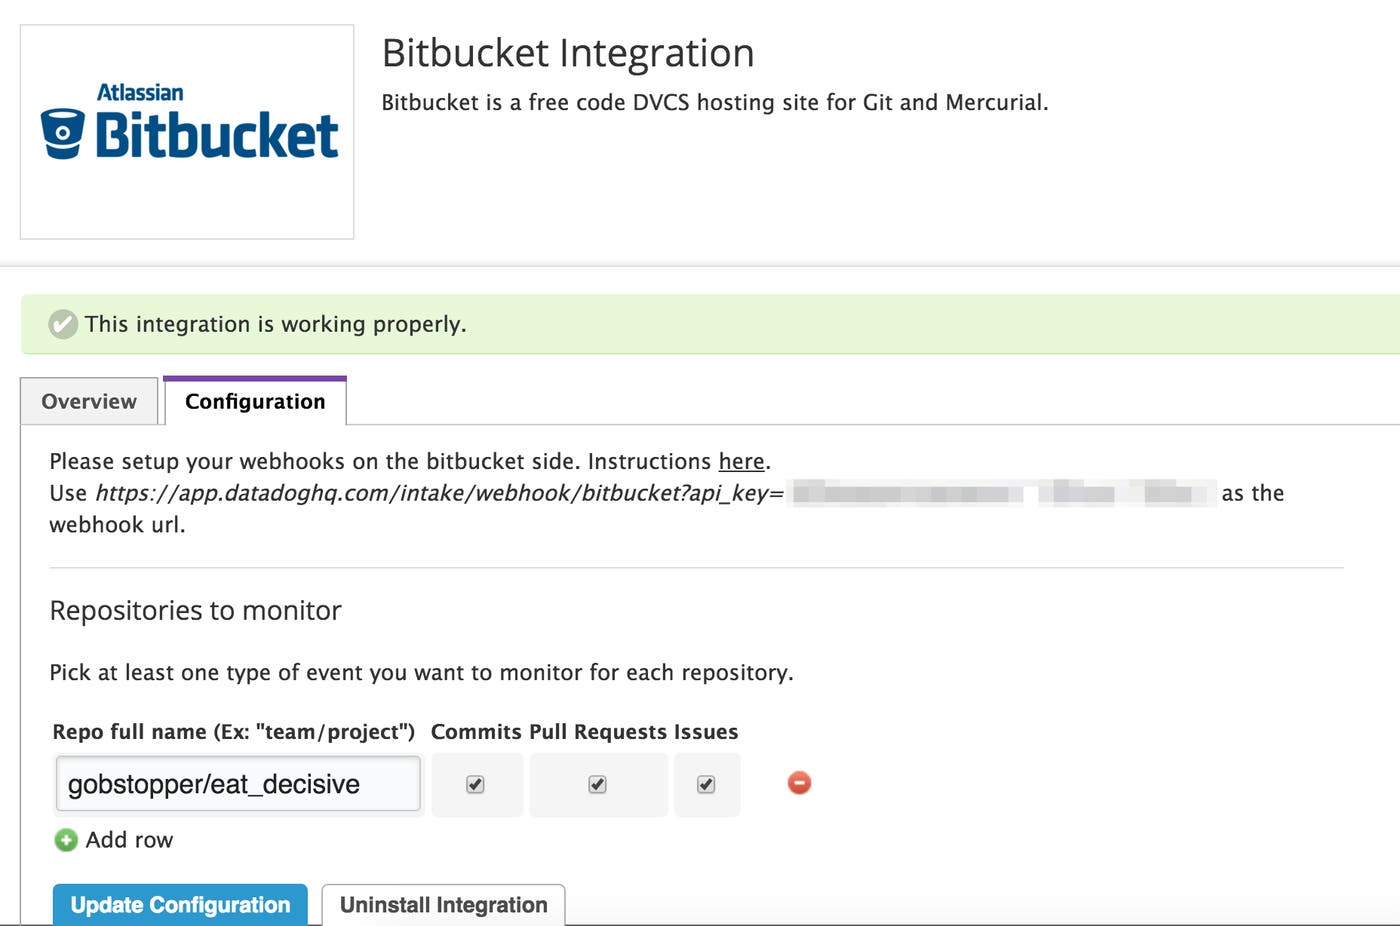
Then follow the instructions here to add the webhook URL to Bitbucket.
If you’re interested in visualizing the impact of code changes on system performance, get started now. If you’re new to Datadog, you can start tracking Bitbucket code changes with a free trial.
此内容由惯性聚合(RSS阅读器)自动聚合整理,仅供阅读参考。 原文来自 — 版权归原作者所有。