As part of the development of memory_profiler I've tried several ways to get memory usage of a program from within Python. In this post I'll describe the different alternatives I've tested.
The psutil library
psutil is a python library that provides an interface for retrieving information on running processes. It provides convenient, fast and cross-platform functions to access the memory usage of a Python module:
def memory_usage_psutil():
    # return the memory usage in MB
    import psutil
    process = psutil.Process(os.getpid())
    mem = process.get_memory_info()[0] / float(2 ** 20)
    return mem
The above function returns the memory usage of the current Python process in
MiB. Depending on the platform it will choose the most accurate and fastest
way to get this information. For example, in Windows it will use the C++ Win32
API while in Linux it will read from /proc, hiding the implementation
details and proving on each platform a fast and accurate measurement.
If you are looking for an easy way to get the memory consumption within Python this in my opinion your best shot.
The resource module
The resource module is part of the standard Python library. It's basically a wrapper around getrusage, which is a POSIX standard but some methods are still missing in Linux . However, the ones we are interested seem to work fine in Ubuntu 10.04. You can get the memory usage with this function:
def memory_usage_resource():
    import resource
    rusage_denom = 1024.
    if sys.platform == 'darwin':
        # ... it seems that in OSX the output is different units ...
        rusage_denom = rusage_denom * rusage_denom
    mem = resource.getrusage(resource.RUSAGE_SELF).ru_maxrss / rusage_denom
    return mem
In my experience this approach is several times faster than the one based in
psutil as was the default way to get the memory usage that I used in
memory_profiler from version 0.23 up to 0.26. I changed this behavior in
0.27 after a bug report by Philippe Gervais.
The problem with this approach is that it seems to report results that are
slightly different in some cases. Notably it seems to differ when objects
have been recently liberated from the python interpreter.
In the following example, orphaned arrays are liberated by the python
interpreter, which is correctly seen by psutil but not by resource:
mem_resource = []
mem_psutil = []
for i in range(1, 21):
    a = np.zeros((1000 * i, 100 * i))
    mem_resource.append(memory_usage_resource())
    mem_psutil.append(memory_usage_psutil())
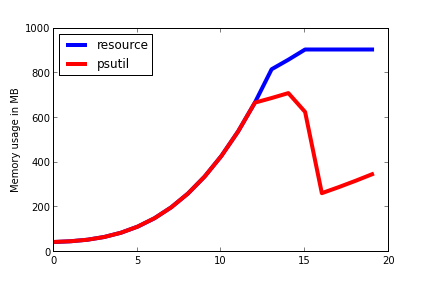
By the way I would be delighted to be corrected if I'm doing something wrong or informed of a workaround if this exists (I've got the code to reproduce the figures 1)
querying ps directly
The method based on psutils works great but is not available by default on all
Python systems. Because of this in memory_profiler we use as last resort
something that's pretty ugly but works reasonably well when all else fails:
invoking the system's ps command and parsing the output. The code is
something like::
def memory_usage_ps():
    import subprocess
    out = subprocess.Popen(['ps', 'v', '-p', str(os.getpid())],
    stdout=subprocess.PIPE).communicate()[0].split(b'\n')
    vsz_index = out[0].split().index(b'RSS')
    mem = float(out[1].split()[vsz_index]) / 1024
    return mem
The main disadvantage of this approach is that it needs to fork a process for each measurement. For some tasks where you need to get memory usage very fast, like in line-by-line memory usage then this be a huge overhead on the code. For other tasks such as getting information of long-running processes, where the memory usage is anyway working on a separate process this is not too bad.
benchmarks
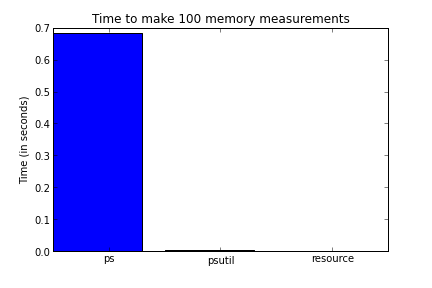
Here is a benchmark of the different alternatives presented above. I am
plotting the time it takes the different approaches to make 100 measurements
of the memory usage (lower is better). As can be seen the smallest one is
resource (although it suffers from the issues described above) followed
closely by psutil which is in my opinion the best option if you can count on
it being installed on the host system and followed far away by ps which is
roughly a hundred times slower than psutil.