



惯性聚合 高效追踪和阅读你感兴趣的博客、新闻、科技资讯
阅读原文 在惯性聚合中打开

推荐订阅源

J
Java Code Geeks
月光博客
月光博客
aimingoo的专栏
aimingoo的专栏
Google DeepMind News
Recent Announcements
MyScale Blog
MyScale Blog
钛媒体:引领未来商业与生活新知
钛媒体:引领未来商业与生活新知
S
SegmentFault 最新的问题
Hugging Face - Blog
Hugging Face - Blog
Martin Fowler
Martin Fowler
WordPress大学
WordPress大学
F
Fortinet All Blogs
小众软件
小众软件
D
Docker
U
Unit 42
博客园 - 聂微东
freeCodeCamp Programming Tutorials: Python, JavaScript, Git & More
爱范儿
爱范儿
OSCHINA 社区最新新闻
OSCHINA 社区最新新闻
IT之家
IT之家
云风的 BLOG
云风的 BLOG
博客园 - 司徒正美
有赞技术团队
有赞技术团队
腾讯CDC

VMware Blogs

Diagnostics for VMware Cloud Foundation (VCF) 9.1 with Old Versions of VCF Components Mastering Infrastructure Policies in VMware Cloud Foundation Automation 9.1 Modernizing the Private Cloud: Why VCF 9.1 Lifecycle Management is a Game Changer Announcing the VMware Cloud Foundation 9.1 Upgrade Planning Tool VCF Breakroom Chats Episode 86 – Containers Made Easy: The New “Container-as-a-Service” in VCF 9.1 Securing Your VCF 9.1 Infrastructure with the Symantec Identity Security Platform Virtually Speaking: The AI Reality Check with Dave Linthicum Zero Touch Provisioning: Activating Edge Sites with VMware Cloud Foundation Edge 9.1 VCF Breakroom Chats Episode 85 – Cloning Success at Scale: Inside VCF 9.1’s App Stack Formation VMware Cloud on AWS の使用状況を確認できる API Unlocking the Full Potential of Programmable Infrastructure with VMware Cloud Foundation 9.1 – New Features and Capabilities Smarter Patching at Scale: Vulnerability Assessment and Remediation with VMware Tanzu Platform Encrypted vMotion Offload to Intel QAT in VMware Cloud Foundation 9.1 Deepen Your Expertise: Four Key Benefits of Attending Increase Deployment Flexibility with VCF Edge Automation 1.0.3 Avi Advantage: Automating Certificate Management of VCF Workloads More Memory, Less Effort: Configuring Memory Tiering in VCF 9.1 VCF 9.1 Licensing: Programmatic, Centralized, and Built to Scale Why APJ Networking Professionals Need Private Cloud Expertise VCF 9.1 Networking: Simpler VPC Connectivity Control VCF 9.1 Networking: Exploring Network Services for Virtual Private Clouds VCF Networking 9.1: Seamless DDI Integration with Infoblox The Open Source Advantage: Building from Source for Ultimate Security Expand Shared VMDKs with Clustered Applications in VMware vSAN for VCF 9.1 Monetizing Zero-Trust Security with VCF 9.1 and VMware vDefend VMware vSAN Protection and Recovery Enhancements for VCF 9.1 Deliver Production SQL Server DBaaS with VMware Data Services Manager 9.1 Maximizing Profitability: VCF 9.1 Cost-Focused Approach for VMware Cloud Service Providers Modernizing Your Infrastructure: Introducing VMware Cloud Foundation 9.1 to VCSPs VCF 9.1 is Available: Explore the New Features in Hands-on Labs
Observability on VMware vSphere Kubernetes Service
vmwareblogs · 2026-04-17 · via VMware Blogs

Cloud-native applications bring flexibility, scale, and faster delivery, but they also introduce new operational complexity. In Kubernetes environments, workloads are ephemeral, services are distributed, and telemetry is generated at high volume across multiple layers of the stack.

Our new Observability on vSphere Kubernetes Service white paper explores how to address this challenge on VMware Cloud Foundation (VCF) with vSphere Kubernetes Service (VKS). 

The paper walks through a practical reference architecture built around the following three pillars of observability:

Metrics
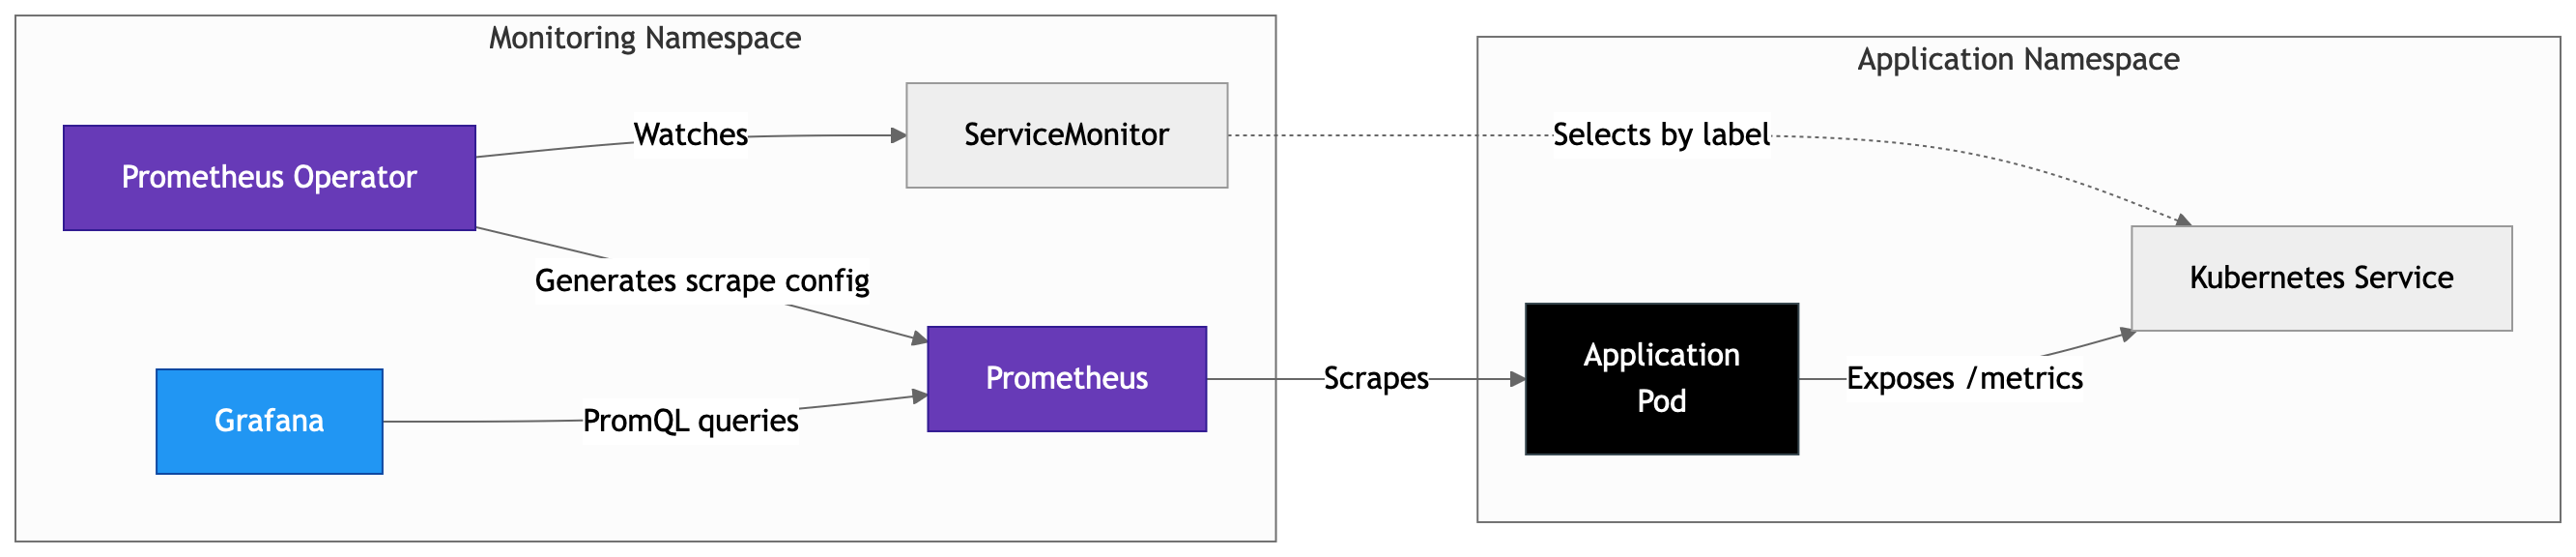
For metrics, the architecture uses the Prometheus Community Stack (kube-prometheus-stack), which includes Prometheus Operator for dynamic target discovery, Grafana for dashboards, and Node Exporter for node-level statistics. Metrics are further enriched with Istio service telemetry and connected to VCF Operations to provide underlying infrastructure context.
Logs
For logs, Fluent Bit is used to collect and enrich Kubernetes log data, with Grafana Loki providing storage and indexing for Kubernetes-native log exploration in Grafana. The same log stream is also forwarded to VCF Operations for Logs, enabling correlation with the wider infrastructure landscape.

Traces
For traces, OpenTelemetry is leveraged for distributed tracing, Jaeger v2 to ingest and visualize OTLP trace data, and OpenSearch as a persistent trace backend. This allows request flows to be followed across services and analysed alongside related application and platform telemetry.

Read the white paper here:
https://www.vmware.com/docs/observability-vks

View the accompanying repository here:
https://github.com/vmware/vks-consumption-models/tree/main/observability-consumption-model

For teams running vSphere Kubernetes Service on VMware Cloud Foundation, this paper offers a practical starting point for building a modular, production-oriented observability stack.


Discover more from VMware Cloud Foundation (VCF) Blog

Subscribe to get the latest posts sent to your email.