









When designing an AI-driven incident-response pipeline for a database operations team, it is beneficial to run the model, the vector store, the orchestration, and the audit log inside the same Postgres cluster. The specific stack used in EDB Agent Factory consists of: pgvector for retrieval, EDB Hybrid Manager on-board model serving for inference, AI Studio powered by Langflow for orchestration, and a regular Postgres table for the audit trail.
This post walks through the architecture, the design choices, and the tradeoffs against the common pattern of using a hosted large language model (LLM) API plus an external vector database. This pipeline was built against existing runbooks for connection pool exhaustion, query latency, and disk-space incidents. The walkthrough below uses those three runbooks as worked examples.
The conclusion for this approach is clear: keeping every component inside the database collapses three operational problems (data egress, per-token cost, and audit-trail correlation) into a single boundary. The rest of the post provides the detailed analysis, including schema, SQL, and threshold logic.
The common pattern for an AI ops pipeline looks like this:
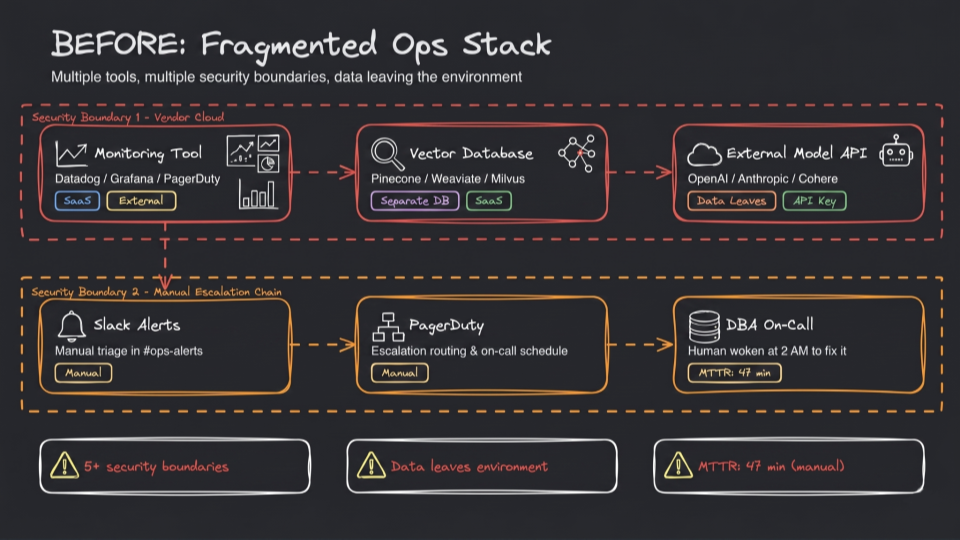
The orchestration framework calls a hosted LLM for triage and reasoning. Runbook content is embedded into a separate vector store. Alerts arrive from an existing monitoring stack (for example, PagerDuty, Grafana, Datadog) via webhook.
This architecture works and has been deployed in various forms. It also has three properties that increase operations time once running at scale:
Patching the default architecture was considered as an alternative to replacing it. A virtual private cloud (VPC) endpoint reduces the egress problem. Prompt caching reduces the cost problem. Structured logging reduces the audit problem. The first two patches converge. The audit-correlation patch does not, because the LLM provider's invocation record is not under internal control.
The pipeline runs on an EDB Postgres AI cluster managed by Hybrid Manager. The components all sit inside that cluster:
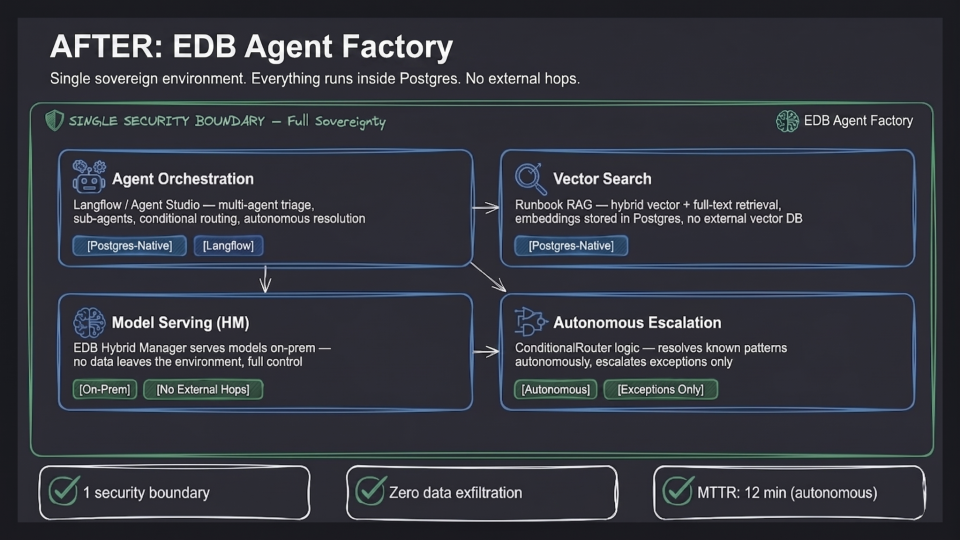
The pieces are:
pgvector: Postgres extension for storing and querying vector embeddings. Runbook chunks live in ops_runbooks with a vector(1024) column and a Hierarchical Navigable Small World (HNSW) index for approximate nearest-neighbor search.incident_audit table: a standard Postgres table. One row per alert. The Langflow flow writes to it as its last step.The runbook schema is short:
CREATE TABLE ops_runbooks (
  runbook_id   TEXT NOT NULL,
  section      TEXT NOT NULL,
  content      TEXT NOT NULL,
  embedding    vector(1024) NOT NULL,
  destructive  BOOLEAN NOT NULL DEFAULT FALSE,
  PRIMARY KEY (runbook_id, section)
);

CREATE INDEX ops_runbooks_embedding_idx
  ON ops_runbooks USING hnsw (embedding vector_cosine_ops);
The destructive boolean is the column that performs the most significant function in this design. It serves as the deterministic policy gate the agent must clear before acting. Further details are provided in the router section.
This is a primary technical question that warrants a direct explanation.
The selection of pgvector was made for three reasons. First, Ops runbooks for supported systems fit in fewer than 50,000 chunks. At that size, HNSW in pgvector returns top-k results in tens of milliseconds on the same hardware that serves the database.
Second, co-located writes simplify retention. When a runbook changes, the same transaction that updates the source row re-embeds and overwrites the embedding. There is no two-system sync to maintain, and no risk of the index drifting against the source.
Third, one backup policy covers everything. The runbook embeddings, the audit log, and the operational data share Postgres's continuous archiving and point-in-time recovery. This eliminates the need to confirm that a separate vector store has a parallel backup story before production deployment.
When an alert arrives at the REST endpoint, the flow executes in this order:
ops_runbooks using ORDER BY embedding <=> $1 LIMIT 5. Returns the top five runbook chunks.pg_stat_statements and a Prometheus exporter table.incident_type, runbook_id, confidence (0.0 to 1.0), recommended_actions, root_cause_hypothesis.confidence >= 0.75, and every recommended action maps to a runbook step where destructive = FALSE. If either condition fails, route to escalation.incident_audit, including the routing decision and the intermediate outputs.The router at step six is where this system differs from a permissive agent design. The threshold and the destructive-action check are deterministic policy, not LLM judgment. The threshold was tuned against a labeled validation set drawn from historical alerts. At 0.75, the autonomous path produced no false positives on that set. If retuning is required, the numerical threshold is adjusted rather than the prompt.
This follows the same principle presented in "The Agentic Confusion: Why I Keep My Postgres Control Plane Deterministic". The agent reasons, while a deterministic policy decides whether the reasoning is allowed to act. Postgres records both.
The pipeline was tested against three runbook scenarios drawn from actual incident history.
Connection pool exhaustion
Alert payload reported pool_size=50, active=198 from a PgBouncer instance. The retriever returned RB-001 at cosine similarity 0.91. The triage agent classified the incident as connection pool exhaustion at confidence 0.85, with two recommended actions, both flagged destructive = FALSE in the runbook.
The Remediation sub-agent applied the equivalent of:
# pgbouncer.ini
default_pool_size = 120
followed by a reload (pgbouncer -R against the running instance).
The Diagnostics sub-agent ran:
SELECT state, count(*)
FROM pg_stat_activity
WHERE datname = 'production'
GROUP BY state;
Result: 198 active backends, 34 idle in transaction. The Notification sub-agent drafted a Slack message and an incident-tracker entry. Total elapsed time from alert to written audit row: 214 seconds.
Query latency spike (RB-002)
Alert payload reported p95 latency 24 times the rolling baseline on the orders table. Retrieved RB-002 at similarity 0.88. The triage agent classified the incident as missing index plus stale statistics at confidence 0.82. Both recommended actions are flagged destructive = FALSE.
The Remediation sub-agent executed:
CREATE INDEX CONCURRENTLY orders_customer_created_idx
  ON orders (customer_id, created_at);
VACUUM ANALYZE orders;
The CONCURRENTLY keyword avoids the ACCESS EXCLUSIVE lock that a plain CREATE INDEX would take. The Diagnostics sub-agent confirmed via pg_stat_user_tables that the table had accumulated 45 million sequential scans since its last ANALYZE.
The same flow was used for different runbooks and remediations. The agent's behavior changed because retrieval returned a different document, not because the agent improvised an action.
Disk space critical (RB-003)
Alert payload reported 94.7 percent utilization on the write-ahead log (WAL) volume, with archiving lag rising and the checkpointer falling behind. Retrieved RB-003 at similarity 0.93. The triage agent classified the incident correctly. The recommended actions included provisioning an emergency volume and pausing write workloads. Both actions are flagged destructive = TRUE in the runbook.
The router sent the case to the escalation path. The on-call engineer received a page with the full context: classification, rootcause analysis, recommended actions, and the runbook section the agent used. The agent did not execute the actions.
This case is particularly notable. The system's value in this scenario lies in the refusal to act. The escalation arrives pre-assembled, allowing the engineer to start from triage step seven instead of reviewing the raw alert.
It is worth quantifying the cost difference rather than relying on qualitative assessments.
The following per-incident usage is assumed for a hosted-LLM architecture (estimates based on typical prompts):
Using published rates for a mid-tier hosted model in the range of $3 per million input tokens and $15 per million output tokens, a single incident lands near $0.15 in model spend before the retry multiplier, and near $0.21 with it. Twelve incidents a week (12 * 52 * 0.21) is roughly $131 per year per system, for the high-severity incidents alone. A real ops surface (alerts plus noise-floor triage plus weekly summarization) typically runs 50 to 100 times that count, putting the annual model bill for one cluster's pipeline in the low four figures at minimum, before growth.
The on-board model-serving path has a different cost shape. The fixed cost is the cluster the inference pod runs on. Once that capacity is provisioned, the marginal cost of an additional alert is the electricity to run the inference, not a per-token charge. The fixed cost is amortized across all uses of the model serving on that cluster, which usually includes more than just the incident-response flow.
The break-even depends on volume. For a single small cluster with low alert volume and no data-residency requirement, the hosted path can be cheaper in absolute dollars. For teams operating tens of clusters, or for any team with a data-residency constraint, the in-cluster path is the lower total cost.
The audit row is a regular Postgres row in a regular Postgres table:
CREATE TABLE incident_audit (
  incident_id        TEXT PRIMARY KEY,
  alert_text         TEXT NOT NULL,
  runbook_retrieved  TEXT,
  similarity         NUMERIC(4,3),
  classification     TEXT,
  severity           TEXT,
  confidence         NUMERIC(4,3),
  routing_decision   TEXT CHECK (routing_decision IN ('autonomous','escalate')),
  remediation_action JSONB,
  diagnostics        JSONB,
  notification       JSONB,
  resolution_time_s  INTEGER,
  created_at         TIMESTAMPTZ NOT NULL DEFAULT now()
);
Sample row for the connection-pool incident:
incident_id:       INC-0047
alert_text:        Connection pool exhaustion: pool_size=50, active=198
runbook_retrieved: RB-001
similarity:        0.910
classification:    ConnectionPoolExhaustion
severity:          P1
confidence:        0.850
routing_decision:  autonomous
remediation_action:{"tool":"pgbouncer","param":"pool_size","from":50,"to":120}
diagnostics:       {"query":"pg_stat_activity","active":198,"idle_in_tx":34}
notification:      {"slack":"ops","tracker_id":"INC-0047"}
resolution_time_s: 214
The row is queryable, joinable to other monitoring tables, and exportable through the same SQL surface used by auditors. There is no separate trace store, no provider-side inference log, and no orchestration log to correlate. When the security team requests the record of an incident, the result is provided via a SELECT statement.
The Langflow flow exposes a single POST /run endpoint protected by an API key. The existing monitoring stack (PagerDuty webhooks, Grafana alert receivers, Datadog notifications) calls that endpoint with the alert payload. The console used by the on-call team consists of approximately 400 lines of Python wrapping the endpoint in a UI.
The integration surface is the smallest part of this build. The larger part is encoding runbooks: getting the chunks at the right granularity for retrieval, and tagging the destructive boolean correctly for every action. That is a one-time investment per runbook, and it transfers across teams once the runbooks live in version control.
The opening recommendation remains the standard for database operations teams building AI-driven incident-response pipelines: run the model, the vector store, the orchestration, and the audit log inside the same Postgres cluster. The specific stack consists of pgvector for retrieval, EDB Hybrid Manager on-board model serving for inference, Agent Studio for orchestration, and a Postgres table for the audit trail.
The design choice that makes this work is treating data egress, per-token cost, and audit-trail correlation as a single problem with a single architectural answer, instead of three problems with three separate patches. The schema, the threshold logic, and the Langflow flow definition are reproducible against any EDB Postgres AI cluster.
此内容由惯性聚合(RSS阅读器)自动聚合整理,仅供阅读参考。 原文来自 — 版权归原作者所有。