


惯性聚合 高效追踪和阅读你感兴趣的博客、新闻、科技资讯
阅读原文 在惯性聚合中打开

推荐订阅源

V
Visual Studio Blog
博客园 - 司徒正美
博客园_首页
Jina AI
Jina AI
奇客Solidot–传递最新科技情报
奇客Solidot–传递最新科技情报
月光博客
月光博客
I
InfoQ
M
MIT News - Artificial intelligence
T
Tailwind CSS Blog
L
LangChain Blog
Last Week in AI
Last Week in AI
A
About on SuperTechFans
B
Blog
博客园 - 叶小钗
雷峰网
雷峰网
H
Help Net Security
WordPress大学
WordPress大学
大猫的无限游戏
大猫的无限游戏
博客园 - 【当耐特】
云风的 BLOG
云风的 BLOG
Microsoft Azure Blog
小众软件
小众软件
aimingoo的专栏
aimingoo的专栏
OSCHINA 社区最新新闻
OSCHINA 社区最新新闻

Pinecone

Pinecone Assistant: A Managed Knowledge Layer for Production AI Applications Multi-domain RAG in n8n: why one knowledge base is not enough Allspice Transforms the Culinary Experience with Semantic Search Powered by Pinecone | Pinecone Building RAG workflows in n8n: choosing the right Pinecone node Knowledge needs a meta-knowledge layer Garbage Day: How Pinecone Safely Deletes Billions of Objects at Scale When "Performance" Means Two Different Things Pinecone BYOC: Pinecone in your AWS, GCP, or Azure account, no vendor access True, Relevant, and Wrong: The Applicability Problem in RAG Use the Pinecone Plugin for Claude Code to develop AI Applications Faster Millions at Stake: How Melange's High-Recall Retrieval Prevents Litigation Collapse Powering High-stakes Patent Search at Scale: How Melange Built a Reliable AI System on Pinecone | Pinecone Pinecone Assistant Node in n8n: Turn Any Data Source Into Knowledge RAG with Access Control Pinecone Dedicated Read Nodes are now in Public Preview Inside Pinecone: Slab Architecture New Bulk Data Operations: Update, Delete, and Fetch by Metadata The Hidden Cost of Building: Lessons from Aquant Simplifying Vector Embeddings with Pinecone Integrated Inference Capabilities Pinecone joins Microsoft Marketplace as a Launch Partner GTM Engineering: Clay + Pinecone for AI-powered Sales Outbound Build an AI knowledge assistant with Google Docs and Pinecone Moving Pinecone forward with Ash Ashutosh as CEO and Edo spearheading our growing AI ambitions as Chief Scientist Pinecone Founder Edo Liberty to Spearhead Pinecone’s Growing AI Ambitions; Appoints Ash Ashutosh as CEO to Expand Vector Database Market Leadership Fast, Accurate Retrieval for Creators at Scale: Delphi’s Path Toward a Million Conversational Agents with Pinecone | Pinecone Announcing Pinecone Pioneers: A Program for Builders, Organizers, and Community Leaders What is Context Engineering? Chunking Strategies for LLM Applications Beyond the hype: Why RAG remains essential for modern AI Obviant Makes 30% More Accurate Defense Acquisition Recommendations Combining Sparse and Dense Retrieval with Pinecone | Pinecone
Unlock enhanced performance and usage monitoring with Dat...
Ana Wishnoff · 2024-11-06 · via Pinecone

Our updated Datadog integration and new Prometheus endpoints make discovering insights into your indexes' performance and usage easier than ever. Building upon existing health metrics, you can now also monitor request frequency and duration, consumption of read and write units, and core metrics on latency through our Datadog integration or directly via our new Prometheus endpoints.

Our Datadog integration now delivers metrics for both serverless and pod-based indexes, with 25 new metrics for more granular performance monitoring and improved observability. With the updated integration, you can:
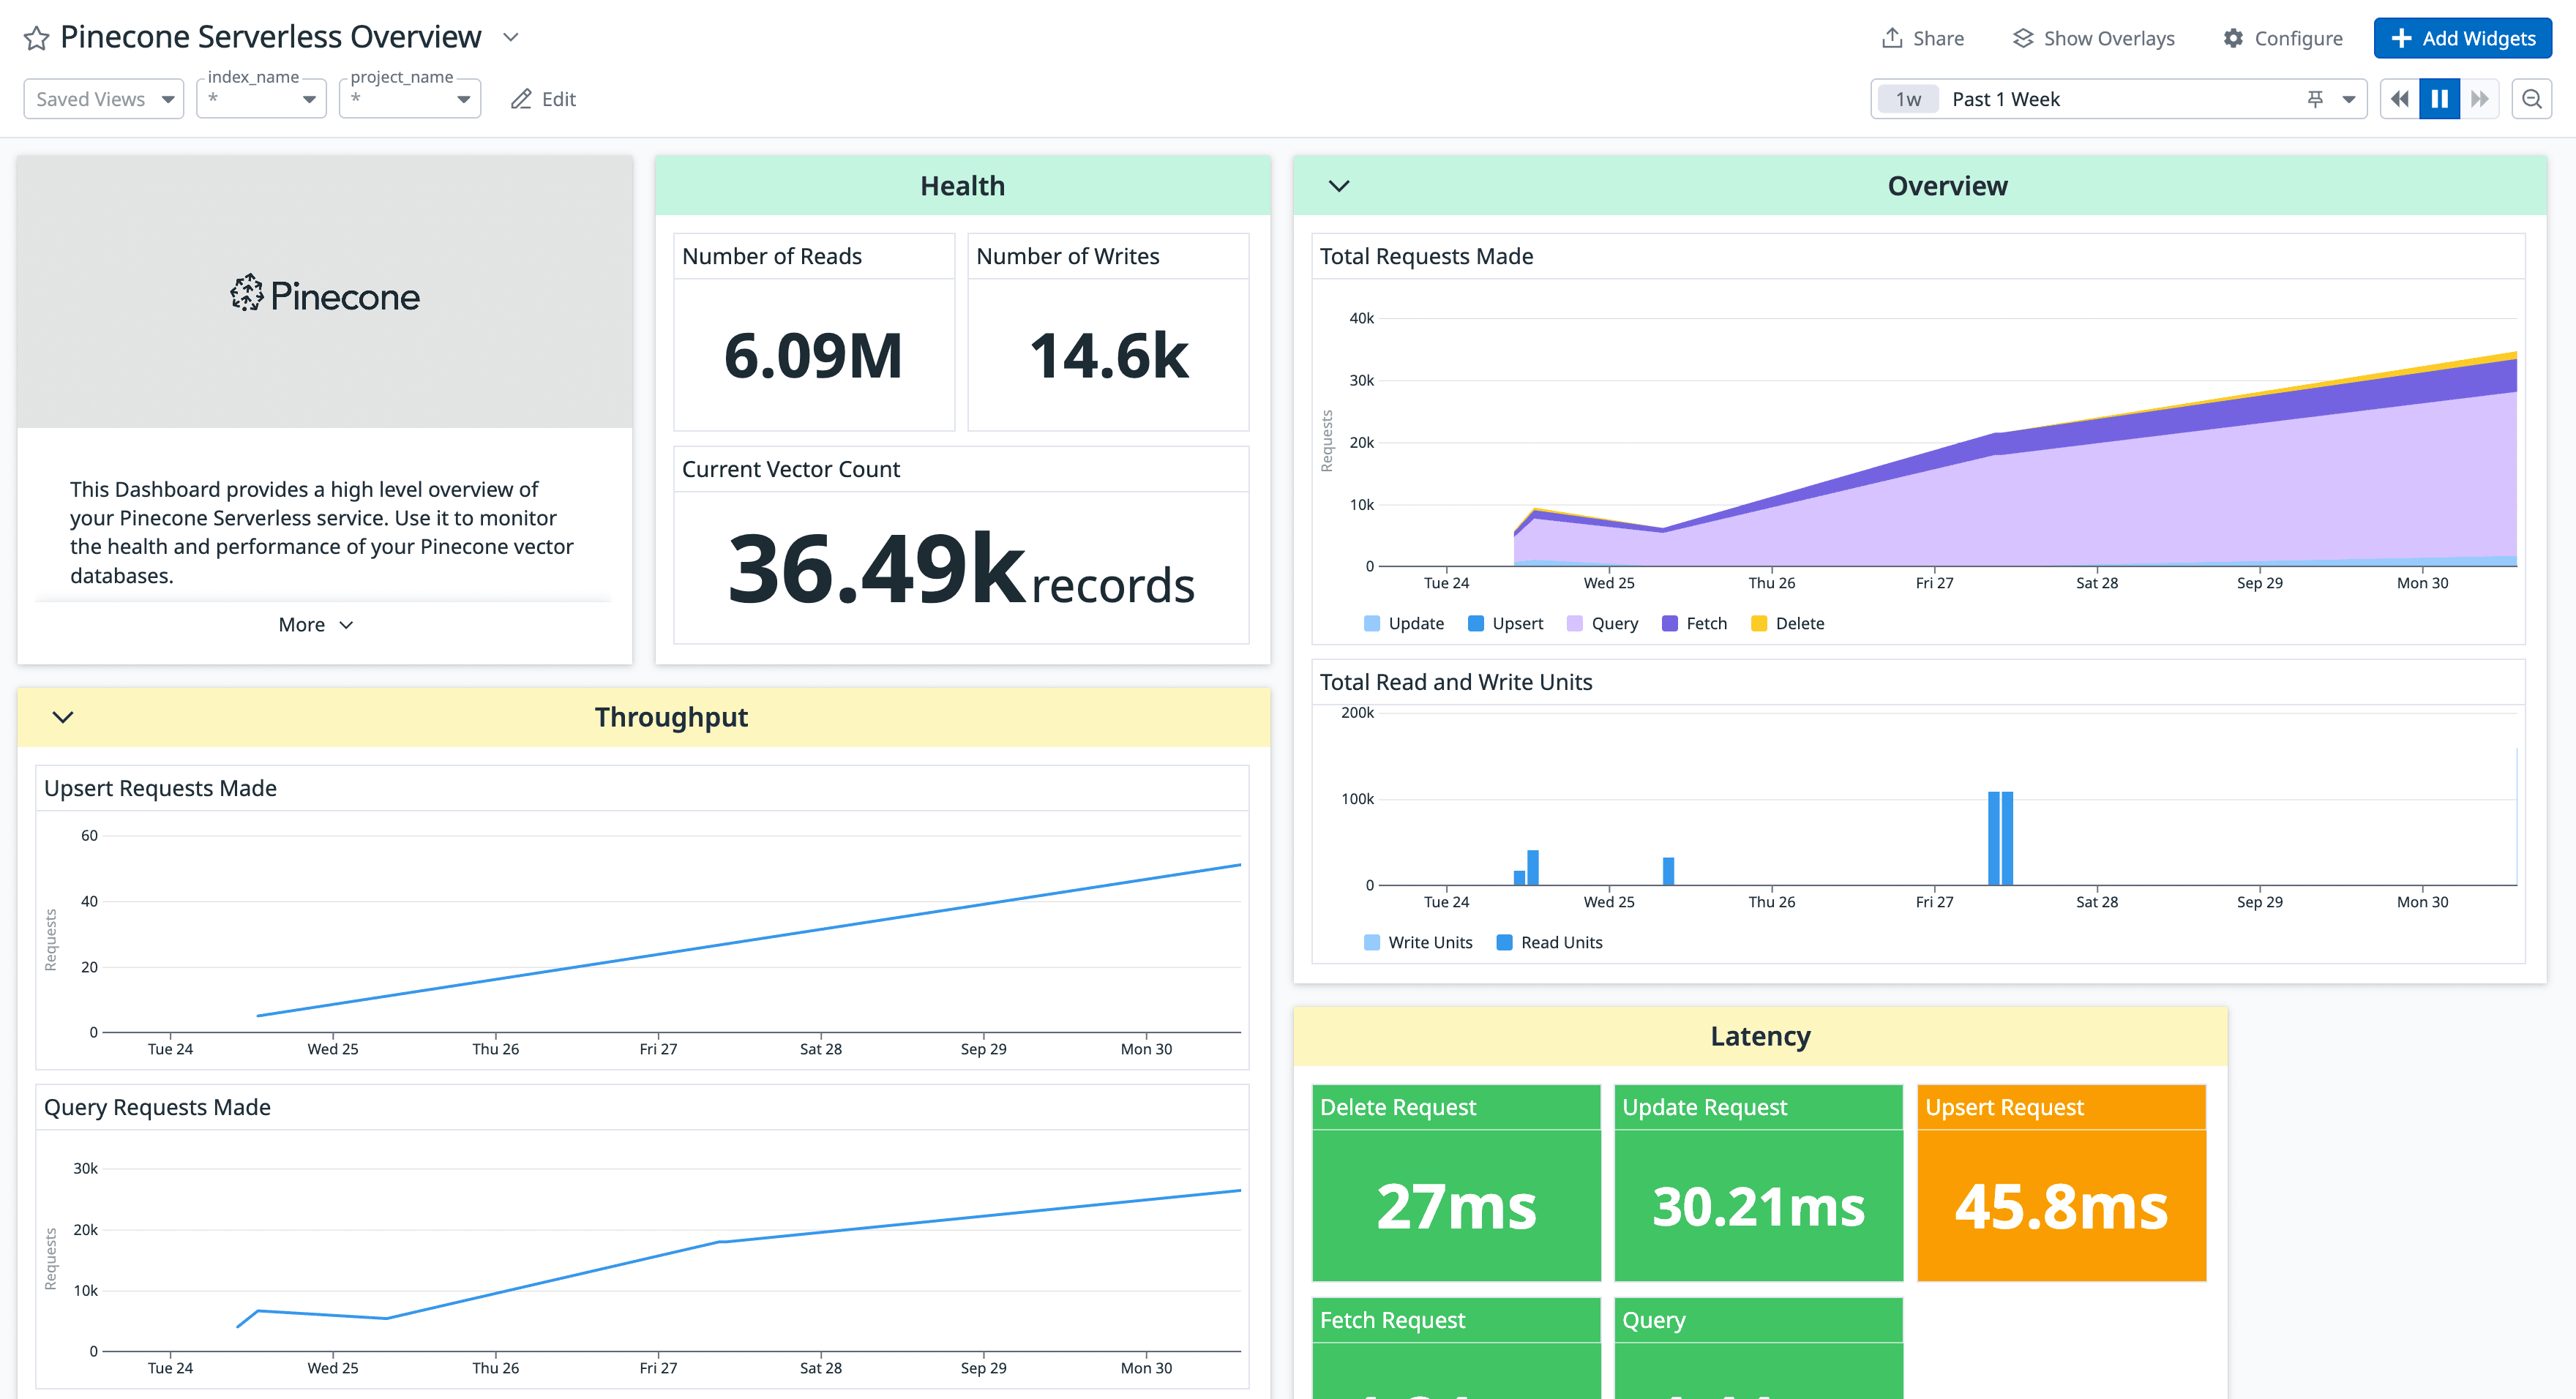
  • Monitor the number of requests made and request duration by endpoint (e.g. the count of upsert requests, query requests, update requests, and more).
  • Explore and visualize your read and write unit consumption, plus the size of your serverless indexes.
  • Track usage patterns over time and easily identify anomalies with out-of-the-box dashboards. Customize your experience further by setting conditional formatting for selected values, viewing certain metrics side by side, or changing data visualizations.
  • Get alerted when the number of writes to your serverless index exceeds a specified threshold to avoid latency issues. This recommended monitor can be customized to meet your team’s specific configuration.

Our out-of-the-box Datadog dashboard for serverless surfaces health metrics on throughput, latency, read and write units, and more.

Getting started

To set up the Datadog integration, go to Datadog's Pinecone integration page. In the Configure tab, simply add your project ID and API Key for the project you want to monitor. Under Monitoring Resources, you'll find the dashboard and recommended monitors, with a full list of available metrics in the Data Collected tab.

For non-Datadog users, these new metrics are fully accessible via Prometheus. The endpoints are designed with HTTP service discovery to automatically detect and target all serverless indexes across regions within a project, making it easy to monitor the health and performance of your entire environment — no matter how it’s distributed.

To set up monitoring directly with Prometheus, you'll need your Pinecone API Key and project ID. Update the scrape_configs section of your prometheus.yml file with this information to start querying. For step-by-step instructions, a list of available metrics, and example queries, check out our Monitor with Prometheus guide.

Prometheus metrics and our Datadog integration are available to all users on Standard and Enterprise plans. Visit our documentation to learn more and start up-leveling your observability today.