


Mallory Mooney

Yair Cohen

Celene Chang
Kubernetes enables teams to deploy and manage their own services, but this can lead to gaps in visibility as different teams create systems with varying configurations and resources. Without an established method for provisioning infrastructure, keeping track of these services becomes more challenging. Implementing infrastructure as code solves this problem by optimizing the process for provisioning and updating production-ready resources.
Now, you can go one step further by easily incorporating monitoring as code into your existing Kubernetes infrastructure with the Datadog Operator. We’ve extended the Operator to include a DatadogMonitor custom resource definition (CRD). Much like Prometheus alerting rules, which allow you to configure alert conditions based on Kubernetes metrics, Datadog CRDs enable you to automatically create and manage monitors for Kubernetes resources via your Kubernetes deployment manifests and tools like kubectl.
We’ll show how to get started with the Datadog Operator and look at a few examples of Datadog monitors you can create to proactively track and alert on the performance of your Kubernetes objects.
To start creating monitors through the Kubernetes API, you will first need to install the Datadog Operator via Helm—or update it to the latest version—and create a new file containing your DatadogMonitor deployment specification. You can then deploy the new monitor using the following kubectl command:
kubectl apply -f sample-datadog-monitor.yaml
You can also add any new monitor to an existing manifest, enabling you to deploy them alongside other Kubernetes objects. Once deployed, you will be able to view your monitor in your Datadog account alongside all of your other monitors. You can also view the state of a specific monitor deployed via the DatadogMonitor custom resource definition directly in your Kubernetes environment using kubectl, as seen below:
$ kubectl get datadogmonitor sample-datadog-monitor
NAME ID MONITOR STATE LAST TRANSITION LAST SYNC SYNC STATUS AGE
sample-datadog-monitor 1234 Alert 2021-03-29T17:32:47Z 2021-03-30T12:52:47Z OK 1d
In environments that rely on a large number of alerts for multiple services, using the kubectl get command to search by specific identifiers—such as the name of applications, Helm charts, or namespaces—can help you review the status of alerts you care about the most.
The Datadog Operator enables you to create a repeatable process for deploying, managing, and sharing monitors that are customized for your services, so you can implement automatic monitoring across your entire Kubernetes environment. This ensures that every team within your organization can easily create a comprehensive suite of monitors as part of the deployment process for their Kubernetes applications, so they do not have to dedicate time to building their own alerting services. Next, we’ll look at how you can use the DatadogMonitor CRD to create a customized workflow for deploying alerts with your Kubernetes applications.
Pods are a core component of your Kubernetes services, so it’s important to know when a deployment fails to launch new ones. For instance, you can add the following DatadogMonitor CRD to a deployment manifest for a specific application (k8s-app-1 in the example below) and be notified when one or more application pods are in a CrashLoopBackOff state. This issue could mean that a container is repeatedly crashing after restarting, which is often a result of not allocating enough resources for a pod in a deployment manifest.
apiVersion: datadoghq.com/v1alpha1
kind: DatadogMonitor
metadata:
name: pods-crashloopbackoff
namespace: datadog
spec:
query: "max(last_10m):max:kubernetes_state.container.status_report.count.waiting{reason:crashloopbackoff, app:k8s-app-1} >= 1"
type: "query alert"
name: "[kubernetes] Pod {{pod_name.name}} is CrashLoopBackOff in k8s-app-1 app"
message: "pod {{pod_name.name}} is in CrashLoopBackOff in k8s-app-1 app. \n Adjust the thresholds of the query to suit your infrastructure."
tags:
- "integration:kubernetes"
If one of your teams maintains a backend service, they will need to know whether image updates are deployed and pulled successfully or not. For example, when one of the service’s pods is not able to pull a container image, it will generate an ImagePullBackOff error message. This can happen when the pod is pulling an outdated image path or is using credentials that are not configured properly. You can monitor when this happens in any Kubernetes namespace, as seen in the snippet below:
apiVersion: datadoghq.com/v1alpha1
kind: DatadogMonitor
metadata:
name: pods-imagepullbackoff
namespace: datadog
spec:
query: "max(last_10m):max:kubernetes_state.container.status_report.count.waiting{reason:imagepullbackoff} by {kube_namespace,pod_name} >= 1"
type: "query alert"
name: "[kubernetes] Pod {{pod_name.name}} is ImagePullBackOff on namespace {{kube_namespace.name}}"
message: "pod {{pod_name.name}} is ImagePullBackOff on {{kube_namespace.name}} \n This could happen for several reasons, for example a bad image path or tag or if the credentials for pulling images are not configured properly."
tags:
- "integration:kubernetes"
You can also create a monitor to notify you when a certain percentage of nodes for that shared service are in an unschedulable state, which could mean that a cluster does not have adequate resources to schedule new nodes.
apiVersion: datadoghq.com/v1alpha1
kind: DatadogMonitor
metadata:
name: nodes-unavailable
namespace: datadog
spec:
query: "max(last_15m):sum:kubernetes_state.node.status{status:schedulable} by {kubernetes_cluster} * 100 / sum:kubernetes_state.node.status{*} by {kube_cluster_name} < 80"
type: "query alert"
name: "[kubernetes] Monitor Unschedulable Kubernetes Nodes"
message: "More than 20% of nodes are unschedulable on ({{kube_cluster_name.name}} cluster). \n Keep in mind that this might be expected based on your infrastructure."
tags:
- "integration:kubernetes"
From any triggered monitor, you can pivot to view details about the affected pod, node, or container in order to resolve the issue. Datadog offers deeper insights into the state of your Kubernetes resources with the Live Container view, so you can pinpoint the root cause of the alert. Datadog can also automatically connect your monitors to instrumented services in Datadog APM using the service tag. This enables you to view all triggered alerts for your critical Kubernetes services so you can dive in to a specific alert for more details.
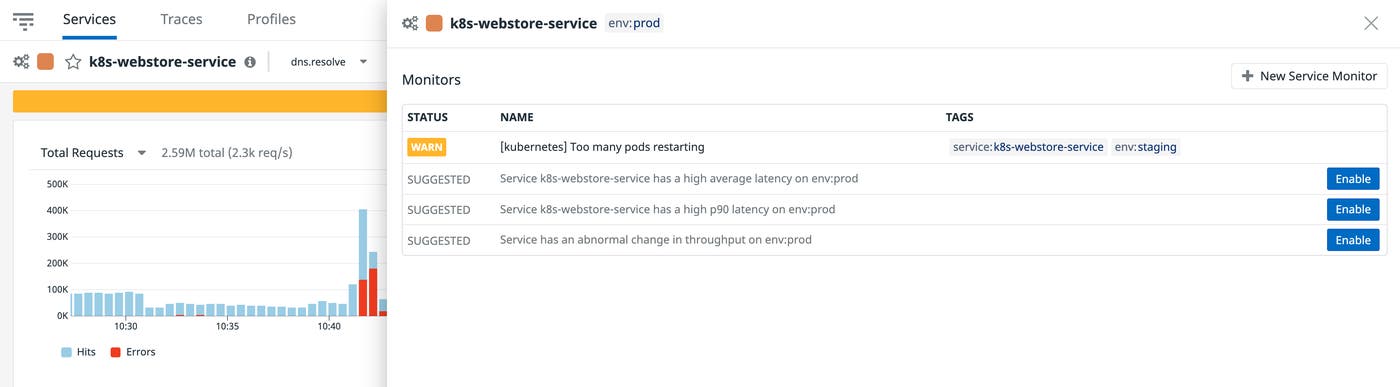
Datadog provides full visibility into all of your Kubernetes resources and enables you to create a repeatable process for alerting on critical issues with your pods, nodes, and more. Check out our documentation to learn more about using the Datadog Operator and DatadogMonitor custom resource definitions in your Kubernetes environment. If you don’t already use Datadog for monitoring Kubernetes, you can sign up for a free trial today.
此内容由惯性聚合(RSS阅读器)自动聚合整理,仅供阅读参考。 原文来自 — 版权归原作者所有。