惯性聚合 高效追踪和阅读你感兴趣的博客、新闻、科技资讯
阅读原文 在惯性聚合中打开

推荐订阅源

www.infosecurity-magazine.com
Security Archives - TechRepublic
TaoSecurity Blog
TaoSecurity Blog
Cloudbric
Cloudbric
cs.CL updates on arXiv.org
N
News and Events Feed by Topic
Threat Intelligence Blog | Flashpoint
S
Securelist
The Cloudflare Blog
让小产品的独立变现更简单 - ezindie.com
D
DataBreaches.Net
S
Schneier on Security
L
LangChain Blog
Jina AI
Jina AI
M
MIT News - Artificial intelligence
Recent Announcements
T
Tenable Blog
B
Blog RSS Feed
V
Visual Studio Blog
Simon Willison's Weblog
G
Google Developers Blog
T
The Exploit Database - CXSecurity.com
Exploit-DB.com RSS Feed
WordPress大学
WordPress大学
W
WeLiveSecurity
I
InfoQ
The Hacker News
The Hacker News
雷峰网
雷峰网
月光博客
月光博客
P
Privacy & Cybersecurity Law Blog
O
OpenAI News
Hacker News: Ask HN
Hacker News: Ask HN
T
Threat Research - Cisco Blogs
GbyAI
GbyAI
The Last Watchdog
The Last Watchdog
P
Privacy International News Feed
Cyberwarzone
Cyberwarzone
S
SegmentFault 最新的问题
L
Lohrmann on Cybersecurity
人人都是产品经理
人人都是产品经理
V
V2EX
V
Vulnerabilities – Threatpost
cs.CV updates on arXiv.org
C
Cybersecurity and Infrastructure Security Agency CISA
freeCodeCamp Programming Tutorials: Python, JavaScript, Git & More
T
Troy Hunt's Blog
Application and Cybersecurity Blog
阮一峰的网络日志
阮一峰的网络日志
SecWiki News
SecWiki News
Microsoft Azure Blog

Datadog | The Monitor blog

Introducing our open source AI-native SAST Instrument and monitor Boomi integration flows with OpenTelemetry and Datadog Not all index scans are equal: How we cut query latency by over 99% Platform engineering metrics: What to measure and what to ignore Integrate Recorded Future threat intelligence with Datadog Cloud SIEM CI/CD security: threat modeling using a MITRE-style threat matrix CI/CD security: How to secure your GitHub ecosystem Ingress NGINX is EOL: A practical guide for migrating to Kubernetes Gateway API Operating agentic AI with Amazon Bedrock AgentCore and Datadog LLM Observability: Lessons from NTT DATA Introducing the Datadog Code Security MCP Capture and analyze custom heatmaps in Session Replay Understand session replays faster with AI summaries and smart chapters Monitor ClickHouse query performance with Datadog Database Monitoring How we designed empathetic alert sounds for on-call engineers Search and act across Datadog to resolve issues faster with Bits Assistant Measure the business impact of every product change with Datadog Experiments Analyzing round trip query latency Configuring JavaScript caches for better performance Introducing Bits AI Dev Agent for Code Security Datadog achieves ISO 42001 certification for responsible AI Monitor Nutanix clusters, hosts, and VMs with Datadog Monitor Juniper Mist in Datadog A new Host Map for modern infrastructure Annotate traces to improve LLM quality with Datadog LLM Observability What’s new in Cloud SIEM: AI-powered investigations, enhanced threat intelligence, and scalable security operations Explore Kubernetes with native OpenTelemetry data Monitor Oracle Fusion Cloud Applications with Datadog Announcing the Datadog Terraform provider v4.0.0 Scaling Kubernetes workloads on custom metrics How to design cloud environments for AI-powered threat analysis Monitor Aruba Central in Datadog How we centralize and remediate risks with Datadog Case Management Accelerate incident response with Datadog and ServiceNow Monitor your application and network load balancer logs Understanding Karpenter architecture for Kubernetes autoscaling Tools for collecting metrics and logs from Karpenter Monitor Karpenter with Datadog What your product data is actually saying Key metrics for monitoring Karpenter Securing Datadog’s platform in the AI age: The role of observability data Four ways engineering teams use the Datadog MCP Server to power AI agents Approaching your observability migration with the right mindset Meet the new Bits AI SRE: Deeper reasoning, twice as fast Key learnings from the 2026 State of DevSecOps study Use plain English to query your multi-cloud infrastructure in Resource Catalog Simplifying troubleshooting across the user journey with Datadog Synthetic Monitoring Protect your OCI resources with Datadog Cloud Security This Month in Datadog - February 2026 Amazon EC2 security: How misconfigured and public AMIs expand your cloud attack surface Enable end-to-end visibility into your Java apps with a single command Measure and improve mobile app startup performance with Datadog RUM Evaluating our AI Guard application to improve quality and control cost Identify untested code across every level of your codebase Make use of guardrail metrics and stop babysitting your releases Monitor Versa Networks SD-WAN performance in Datadog Improve performance and reliability with APM Recommendations Remediate transitive vulnerabilities faster with Datadog Software Composition Analysis Generate audit-ready vulnerability and compliance reports with Datadog Sheets Monitor Fortinet FortiManager performance in Datadog Improve test coverage across codebases with Datadog Code Coverage Move fast, don’t break things: Consistent testing standards at scale Enrich logs with ServiceNow CMDB context before routing to any SIEM or logging tool Monitor Lustre with Datadog Make faster, better product decisions with Datadog Product Analytics Surface and remediate runtime posture issues with Workload Protection Findings Protect agentic AI applications with Datadog AI Guard How to optimize JavaScript code with CSS Trace Google Pub/Sub workloads in Cloud Run with Datadog Detect human names in logs with ML in Sensitive Data Scanner How we cut our NLQ agent debugging time from hours to minutes with LLM Observability Debug PostgreSQL query latency faster with EXPLAIN ANALYZE in Datadog Database Monitoring Datadog acquires Propolis Unify and correlate frontend and backend data with retention filters Scale compliance across global frameworks with Datadog Cloud Security Monitor Arista VeloCloud SD-WAN performance with Datadog Building reliable dashboard agents with Datadog LLM Observability Simplify log collection and aggregation for MSSPs with Datadog Observability Pipelines Mitigation for Node.js denial-of-service vulnerability affecting Datadog APM Automate flaky test fixes with the Bits AI Dev Agent and Test Optimization How we built an AI SRE agent that investigates like a team of engineers Datadog integrations 2025 recap: Observability for AI, security, and hybrid cloud Design effective executive dashboards with Datadog Implement dbt data quality checks with dbt-expectations Bring faster visibility into AWS Lambda functions with remote instrumentation Troubleshoot faster with the GitLab Source Code integration in Datadog How Cambia Health Solutions saved $30,000 monthly with Cloud Cost Management and the Datadog Resource Catalog Normalize any logs for Cloud SIEM with Datadog's OCSF processor Optimizing Datadog at scale: Cost-efficient observability at Zendesk Detect, diagnose, and resolve network issues easily with CNM Network Health Connect engineering errors to user impact in early-stage products Cilium configuration for Kubernetes operations at scale Designing feedback loops for progressive delivery Ship features faster and safer with Datadog Feature Flags Choosing the right OpenTelemetry Collector distribution Route your monitor alerts with Datadog monitor notification rules Automate Cloud SIEM investigations with Bits AI Security Analyst Cloud threat detection: How to identify risky activity across control and data planes Collecting Kafka performance metrics Monitoring Kafka with Datadog Monitoring Kafka performance metrics
Automatically create and manage Kubernetes alerts with Datadog
Mallory Mooney, Yair Cohen, Celene Chang · 2021-05-05 · via Datadog | The Monitor blog
Mallory Mooney

Mallory Mooney

Yair Cohen

Yair Cohen

Celene Chang

Celene Chang

Kubernetes enables teams to deploy and manage their own services, but this can lead to gaps in visibility as different teams create systems with varying configurations and resources. Without an established method for provisioning infrastructure, keeping track of these services becomes more challenging. Implementing infrastructure as code solves this problem by optimizing the process for provisioning and updating production-ready resources.

Now, you can go one step further by easily incorporating monitoring as code into your existing Kubernetes infrastructure with the Datadog Operator. We’ve extended the Operator to include a DatadogMonitor custom resource definition (CRD). Much like Prometheus alerting rules, which allow you to configure alert conditions based on Kubernetes metrics, Datadog CRDs enable you to automatically create and manage monitors for Kubernetes resources via your Kubernetes deployment manifests and tools like kubectl.

We’ll show how to get started with the Datadog Operator and look at a few examples of Datadog monitors you can create to proactively track and alert on the performance of your Kubernetes objects.

Get started with the DatadogMonitor custom resource definition

To start creating monitors through the Kubernetes API, you will first need to install the Datadog Operator via Helm—or update it to the latest version—and create a new file containing your DatadogMonitor deployment specification. You can then deploy the new monitor using the following kubectl command:

kubectl apply -f sample-datadog-monitor.yaml

You can also add any new monitor to an existing manifest, enabling you to deploy them alongside other Kubernetes objects. Once deployed, you will be able to view your monitor in your Datadog account alongside all of your other monitors. You can also view the state of a specific monitor deployed via the DatadogMonitor custom resource definition directly in your Kubernetes environment using kubectl, as seen below:

$ kubectl get datadogmonitor sample-datadog-monitor

NAME ID MONITOR STATE LAST TRANSITION LAST SYNC SYNC STATUS AGE

sample-datadog-monitor 1234 Alert 2021-03-29T17:32:47Z 2021-03-30T12:52:47Z OK 1d

In environments that rely on a large number of alerts for multiple services, using the kubectl get command to search by specific identifiers—such as the name of applications, Helm charts, or namespaces—can help you review the status of alerts you care about the most.

Monitor Kubernetes resources as soon as they are deployed

The Datadog Operator enables you to create a repeatable process for deploying, managing, and sharing monitors that are customized for your services, so you can implement automatic monitoring across your entire Kubernetes environment. This ensures that every team within your organization can easily create a comprehensive suite of monitors as part of the deployment process for their Kubernetes applications, so they do not have to dedicate time to building their own alerting services. Next, we’ll look at how you can use the DatadogMonitor CRD to create a customized workflow for deploying alerts with your Kubernetes applications.

Alert on issues with individual applications

Pods are a core component of your Kubernetes services, so it’s important to know when a deployment fails to launch new ones. For instance, you can add the following DatadogMonitor CRD to a deployment manifest for a specific application (k8s-app-1 in the example below) and be notified when one or more application pods are in a CrashLoopBackOff state. This issue could mean that a container is repeatedly crashing after restarting, which is often a result of not allocating enough resources for a pod in a deployment manifest.

apiVersion: datadoghq.com/v1alpha1

kind: DatadogMonitor

metadata:

name: pods-crashloopbackoff

namespace: datadog

spec:

query: "max(last_10m):max:kubernetes_state.container.status_report.count.waiting{reason:crashloopbackoff, app:k8s-app-1} >= 1"

type: "query alert"

name: "[kubernetes] Pod {{pod_name.name}} is CrashLoopBackOff in k8s-app-1 app"

message: "pod {{pod_name.name}} is in CrashLoopBackOff in k8s-app-1 app. \n Adjust the thresholds of the query to suit your infrastructure."

tags:

- "integration:kubernetes"

Track updates to cluster pods for critical services

If one of your teams maintains a backend service, they will need to know whether image updates are deployed and pulled successfully or not. For example, when one of the service’s pods is not able to pull a container image, it will generate an ImagePullBackOff error message. This can happen when the pod is pulling an outdated image path or is using credentials that are not configured properly. You can monitor when this happens in any Kubernetes namespace, as seen in the snippet below:

apiVersion: datadoghq.com/v1alpha1

kind: DatadogMonitor

metadata:

name: pods-imagepullbackoff

namespace: datadog

spec:

query: "max(last_10m):max:kubernetes_state.container.status_report.count.waiting{reason:imagepullbackoff} by {kube_namespace,pod_name} >= 1"

type: "query alert"

name: "[kubernetes] Pod {{pod_name.name}} is ImagePullBackOff on namespace {{kube_namespace.name}}"

message: "pod {{pod_name.name}} is ImagePullBackOff on {{kube_namespace.name}} \n This could happen for several reasons, for example a bad image path or tag or if the credentials for pulling images are not configured properly."

tags:

- "integration:kubernetes"

Notify teams on the state of cluster nodes

You can also create a monitor to notify you when a certain percentage of nodes for that shared service are in an unschedulable state, which could mean that a cluster does not have adequate resources to schedule new nodes.

apiVersion: datadoghq.com/v1alpha1

kind: DatadogMonitor

metadata:

name: nodes-unavailable

namespace: datadog

spec:

query: "max(last_15m):sum:kubernetes_state.node.status{status:schedulable} by {kubernetes_cluster} * 100 / sum:kubernetes_state.node.status{*} by {kube_cluster_name} < 80"

type: "query alert"

name: "[kubernetes] Monitor Unschedulable Kubernetes Nodes"

message: "More than 20% of nodes are unschedulable on ({{kube_cluster_name.name}} cluster). \n Keep in mind that this might be expected based on your infrastructure."

tags:

- "integration:kubernetes"

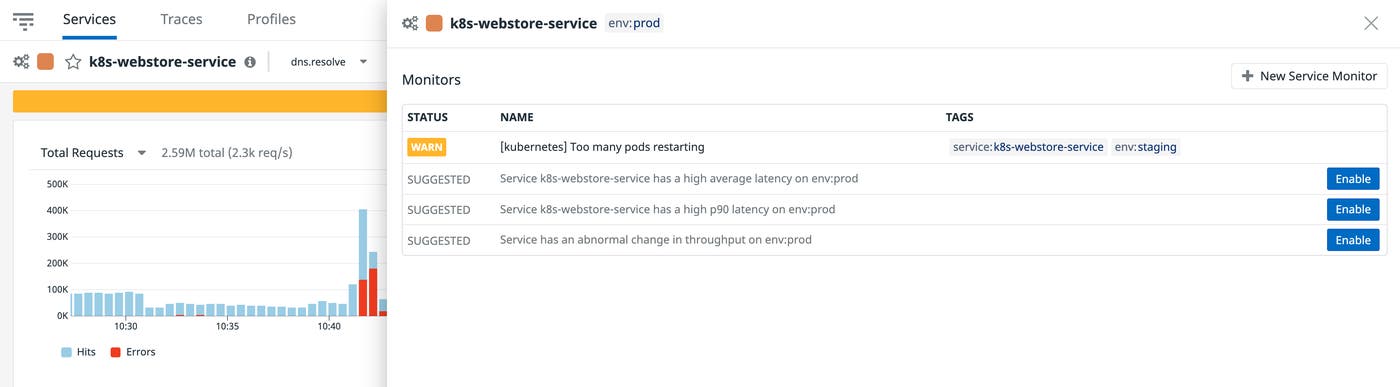
From any triggered monitor, you can pivot to view details about the affected pod, node, or container in order to resolve the issue. Datadog offers deeper insights into the state of your Kubernetes resources with the Live Container view, so you can pinpoint the root cause of the alert. Datadog can also automatically connect your monitors to instrumented services in Datadog APM using the service tag. This enables you to view all triggered alerts for your critical Kubernetes services so you can dive in to a specific alert for more details.

Kubernetes alerts from Datadog APM

Automatically alert on issues in Kubernetes environment

Datadog provides full visibility into all of your Kubernetes resources and enables you to create a repeatable process for alerting on critical issues with your pods, nodes, and more. Check out our documentation to learn more about using the Datadog Operator and DatadogMonitor custom resource definitions in your Kubernetes environment. If you don’t already use Datadog for monitoring Kubernetes, you can sign up for a free trial today.