惯性聚合 高效追踪和阅读你感兴趣的博客、新闻、科技资讯
阅读原文 在惯性聚合中打开

推荐订阅源

大猫的无限游戏
大猫的无限游戏
博客园 - 【当耐特】
Cloudbric
Cloudbric
H
Hackread – Cybersecurity News, Data Breaches, AI and More
Attack and Defense Labs
爱范儿
爱范儿
The Cloudflare Blog
腾讯CDC
Security Archives - TechRepublic
TaoSecurity Blog
TaoSecurity Blog
云风的 BLOG
云风的 BLOG
Recent Announcements
C
Check Point Blog
Schneier on Security
S
Schneier on Security
J
Java Code Geeks
B
Blog RSS Feed
Cisco Talos Blog
Cisco Talos Blog
Vercel News
Vercel News
Stack Overflow Blog
Stack Overflow Blog
博客园_首页
cs.AI updates on arXiv.org
A
About on SuperTechFans
Threat Intelligence Blog | Flashpoint
Google DeepMind News
阮一峰的网络日志
阮一峰的网络日志
罗磊的独立博客
A
Arctic Wolf
S
Secure Thoughts
P
Palo Alto Networks Blog
The Last Watchdog
The Last Watchdog
SecWiki News
SecWiki News
cs.CV updates on arXiv.org
博客园 - 三生石上(FineUI控件)
D
Darknet – Hacking Tools, Hacker News & Cyber Security
量子位
U
Unit 42
I
InfoQ
D
DataBreaches.Net
P
Privacy International News Feed
T
Troy Hunt's Blog
博客园 - 叶小钗
T
Threatpost
博客园 - Franky
K
Kaspersky official blog
Hugging Face - Blog
Hugging Face - Blog
IT之家
IT之家
www.infosecurity-magazine.com
CTFtime.org: upcoming CTF events
C
Cisco Blogs

Datadog | The Monitor blog

Introducing our open source AI-native SAST Instrument and monitor Boomi integration flows with OpenTelemetry and Datadog Not all index scans are equal: How we cut query latency by over 99% Platform engineering metrics: What to measure and what to ignore Integrate Recorded Future threat intelligence with Datadog Cloud SIEM CI/CD security: threat modeling using a MITRE-style threat matrix CI/CD security: How to secure your GitHub ecosystem Ingress NGINX is EOL: A practical guide for migrating to Kubernetes Gateway API Operating agentic AI with Amazon Bedrock AgentCore and Datadog LLM Observability: Lessons from NTT DATA Introducing the Datadog Code Security MCP Capture and analyze custom heatmaps in Session Replay Understand session replays faster with AI summaries and smart chapters Monitor ClickHouse query performance with Datadog Database Monitoring How we designed empathetic alert sounds for on-call engineers Search and act across Datadog to resolve issues faster with Bits Assistant Measure the business impact of every product change with Datadog Experiments Analyzing round trip query latency Configuring JavaScript caches for better performance Introducing Bits AI Dev Agent for Code Security Datadog achieves ISO 42001 certification for responsible AI Monitor Nutanix clusters, hosts, and VMs with Datadog Monitor Juniper Mist in Datadog A new Host Map for modern infrastructure Annotate traces to improve LLM quality with Datadog LLM Observability What’s new in Cloud SIEM: AI-powered investigations, enhanced threat intelligence, and scalable security operations Explore Kubernetes with native OpenTelemetry data Monitor Oracle Fusion Cloud Applications with Datadog Announcing the Datadog Terraform provider v4.0.0 Scaling Kubernetes workloads on custom metrics How to design cloud environments for AI-powered threat analysis Monitor Aruba Central in Datadog How we centralize and remediate risks with Datadog Case Management Accelerate incident response with Datadog and ServiceNow Monitor your application and network load balancer logs Understanding Karpenter architecture for Kubernetes autoscaling Tools for collecting metrics and logs from Karpenter Monitor Karpenter with Datadog What your product data is actually saying Key metrics for monitoring Karpenter Securing Datadog’s platform in the AI age: The role of observability data Four ways engineering teams use the Datadog MCP Server to power AI agents Approaching your observability migration with the right mindset Meet the new Bits AI SRE: Deeper reasoning, twice as fast Key learnings from the 2026 State of DevSecOps study Use plain English to query your multi-cloud infrastructure in Resource Catalog Simplifying troubleshooting across the user journey with Datadog Synthetic Monitoring Protect your OCI resources with Datadog Cloud Security This Month in Datadog - February 2026 Amazon EC2 security: How misconfigured and public AMIs expand your cloud attack surface Enable end-to-end visibility into your Java apps with a single command Measure and improve mobile app startup performance with Datadog RUM Evaluating our AI Guard application to improve quality and control cost Identify untested code across every level of your codebase Make use of guardrail metrics and stop babysitting your releases Monitor Versa Networks SD-WAN performance in Datadog Improve performance and reliability with APM Recommendations Remediate transitive vulnerabilities faster with Datadog Software Composition Analysis Generate audit-ready vulnerability and compliance reports with Datadog Sheets Monitor Fortinet FortiManager performance in Datadog Improve test coverage across codebases with Datadog Code Coverage Move fast, don’t break things: Consistent testing standards at scale Enrich logs with ServiceNow CMDB context before routing to any SIEM or logging tool Monitor Lustre with Datadog Make faster, better product decisions with Datadog Product Analytics Surface and remediate runtime posture issues with Workload Protection Findings Protect agentic AI applications with Datadog AI Guard How to optimize JavaScript code with CSS Trace Google Pub/Sub workloads in Cloud Run with Datadog Detect human names in logs with ML in Sensitive Data Scanner How we cut our NLQ agent debugging time from hours to minutes with LLM Observability Debug PostgreSQL query latency faster with EXPLAIN ANALYZE in Datadog Database Monitoring Datadog acquires Propolis Unify and correlate frontend and backend data with retention filters Scale compliance across global frameworks with Datadog Cloud Security Monitor Arista VeloCloud SD-WAN performance with Datadog Building reliable dashboard agents with Datadog LLM Observability Simplify log collection and aggregation for MSSPs with Datadog Observability Pipelines Mitigation for Node.js denial-of-service vulnerability affecting Datadog APM Automate flaky test fixes with the Bits AI Dev Agent and Test Optimization How we built an AI SRE agent that investigates like a team of engineers Datadog integrations 2025 recap: Observability for AI, security, and hybrid cloud Design effective executive dashboards with Datadog Implement dbt data quality checks with dbt-expectations Bring faster visibility into AWS Lambda functions with remote instrumentation Troubleshoot faster with the GitLab Source Code integration in Datadog How Cambia Health Solutions saved $30,000 monthly with Cloud Cost Management and the Datadog Resource Catalog Normalize any logs for Cloud SIEM with Datadog's OCSF processor Optimizing Datadog at scale: Cost-efficient observability at Zendesk Detect, diagnose, and resolve network issues easily with CNM Network Health Connect engineering errors to user impact in early-stage products Cilium configuration for Kubernetes operations at scale Designing feedback loops for progressive delivery Ship features faster and safer with Datadog Feature Flags Choosing the right OpenTelemetry Collector distribution Route your monitor alerts with Datadog monitor notification rules Automate Cloud SIEM investigations with Bits AI Security Analyst Cloud threat detection: How to identify risky activity across control and data planes Collecting Kafka performance metrics Monitoring Kafka with Datadog Monitoring Kafka performance metrics
Alerting 101: Timeseries metric checks
John Matson · 2017-10-02 · via Datadog | The Monitor blog
John Matson

John Matson

In the previous article, we covered four types of alerts that evaluate the instantaneous status of different infrastructure components. In this post we’ll explore alerts that trigger on timeseries metrics and discrete events. The great benefit of these alerts is that they can evaluate not just instantaneous values, but also trends over time:

  • Threshold alerts

  • Change alerts

  • Outlier alerts

  • Anomaly alerts

  • Event alerts

  • Composite alerts

Threshold alerts

Threshold metric checks

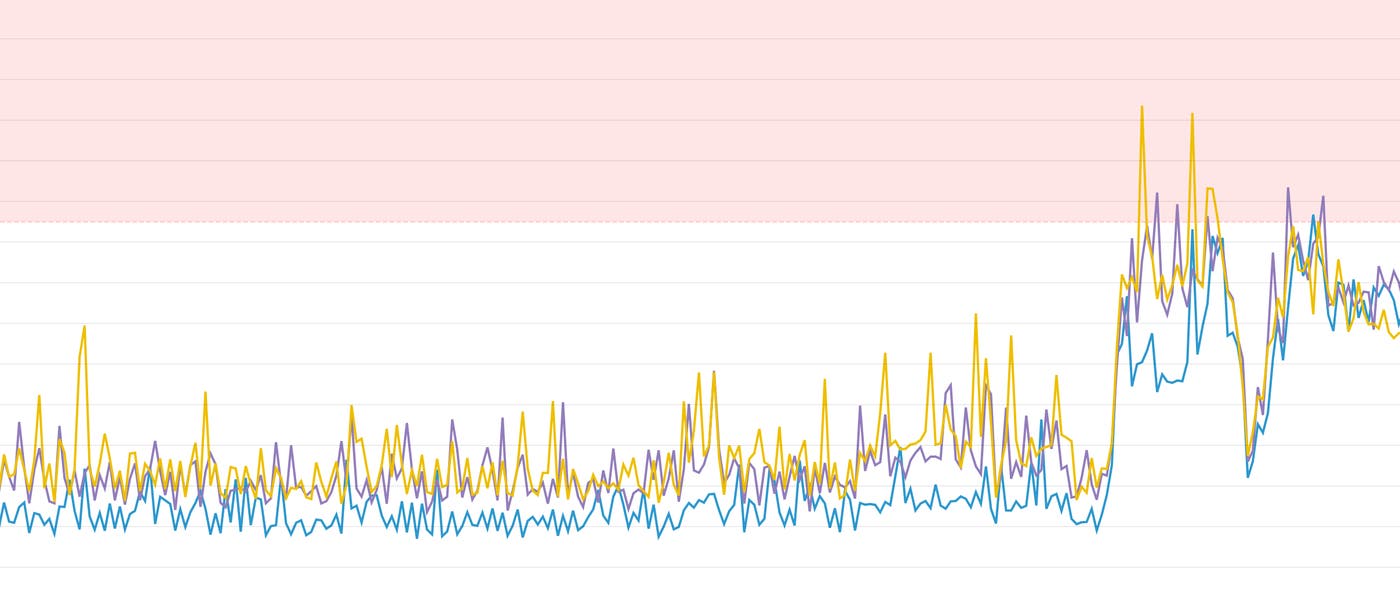
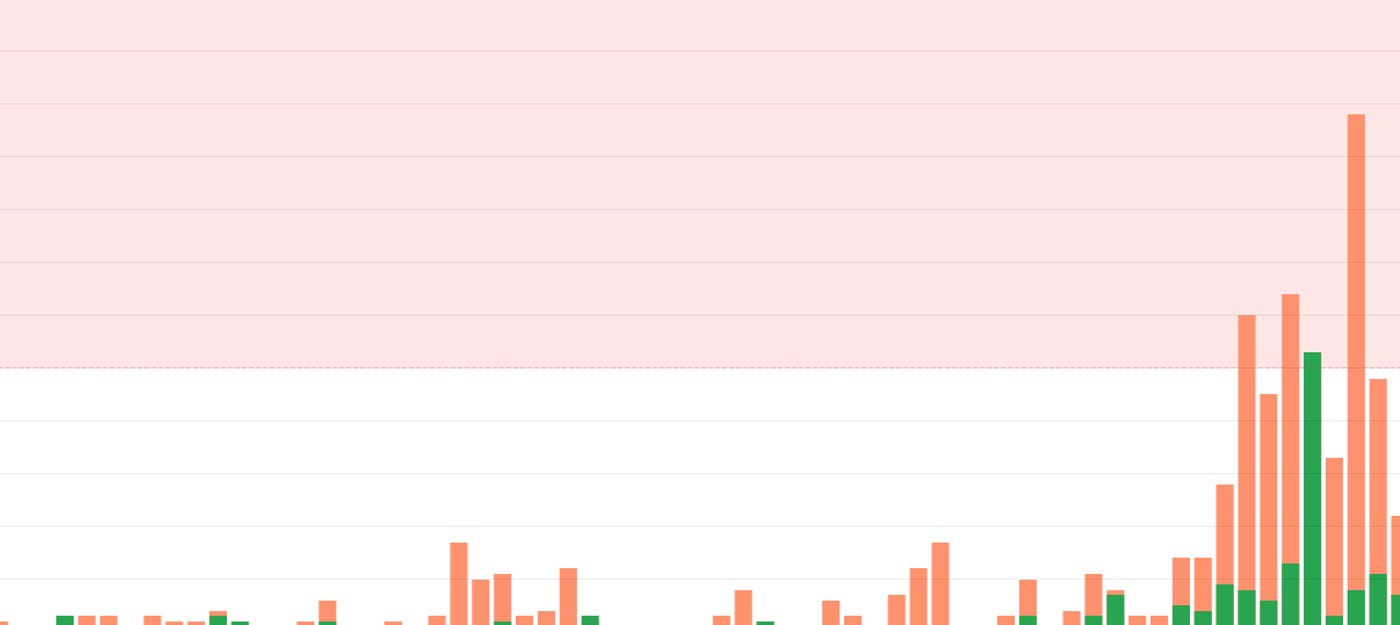
Along with basic availability checks, a threshold alert is one of the simplest kinds of alerts. These alerts trigger whenever the monitored metric goes above (or below) a user-defined threshold. An alert may have multiple thresholds with different responses—for example, a warning threshold that posts a message in an ops channel, and a critical threshold that pages an on-call responder.

Importantly, a threshold alert need not be an absolute red line—you can include a time component in your alert evaluation to avoid false positives caused by momentary blips. For instance, you might wish to alert only if a metric’s value hovers above a given threshold for five minutes or more, or if the average value of the metric over a 15-minute window exceeds a set threshold.

When to use threshold alerts

WhatWhyExample
Metrics with SLAsTo surface unacceptable performance immediatelyp95 application response time
Normalized metrics (percentages or fractions)To identify critical resource constraintsPercent disk available

When to use something else

WhatExampleInstead use...
Metrics with a variable or trending baselineWeb app requests per secondChange alert or anomaly detection to account for expected fluctuations

Change alerts

Percent or absolute change metric checks

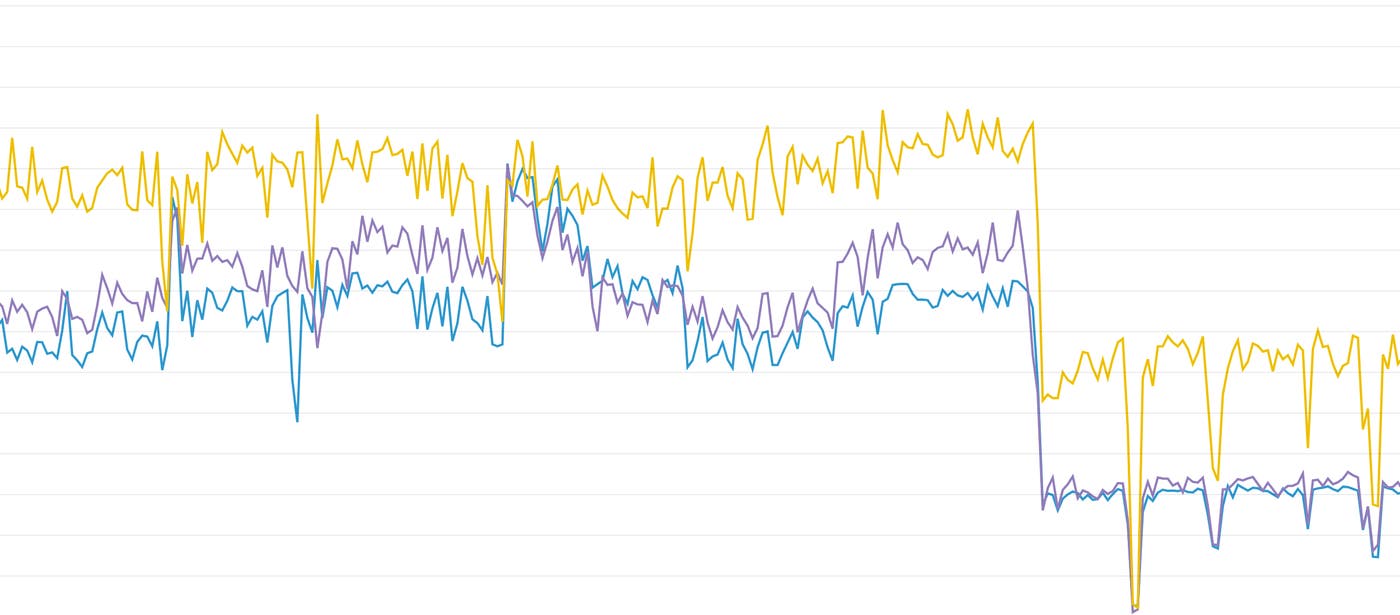
Change alerts evaluate the delta or percentage change in a metric over a certain time interval. Change alerts can notify you of issues such as a large-magnitude drop in database queries processed, as compared to recent values. These alerts are useful for identifying sudden, unexpected changes in metrics where the baseline is highly variable over longer timespans, making it difficult to define a “normal” range for the metric.

When to use change alerts

WhatWhyExample
Metrics with variable or slowly shifting baselinesTo isolate unexpected spikes or drops from normal changesUser count for a growing web app

When to use something else

WhatExampleInstead use...
Metrics with a wide range of acceptable valuesCPU usage on app serversThreshold alert to ensure that CPU does not remain elevated for extended periods
Metrics with small or zero baseline values5xx error count in HTTP serverThreshold alert to avoid triggering on trivial increases that are large on a percentage basis (e.g., 1 error/second to 3 errors/second)

Outlier alerts

Outlier detection on timeseries metrics

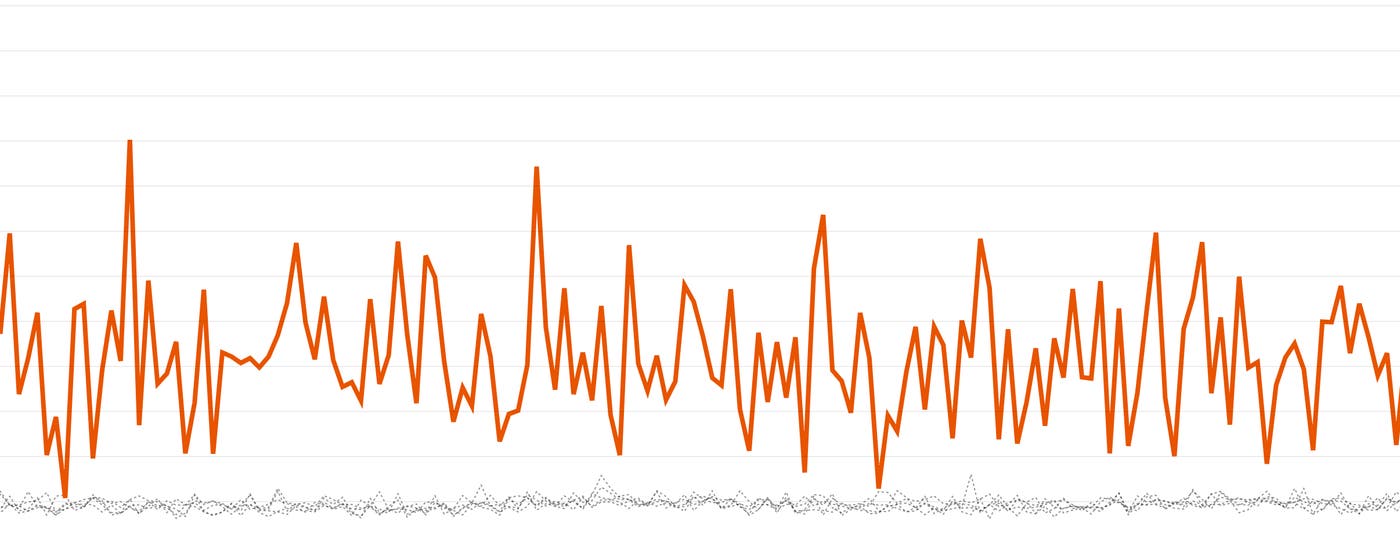
Outlier detection (not to be confused with anomaly detection) tracks deviations from expected group behavior, whether that group comprises hosts, containers, or other units of infrastructure. An outlier alert evaluates metric values from each member of the group, triggering if one or more individuals deviates significantly from the rest.

When to use outlier alerts

WhatWhyExample
Metric values that should be relatively level across the members of the groupTo identify imbalances caused by an internal failureData stored per Cassandra database node
**Work metrics** for distributed systemsTo isolate individual components that are failing to process work effectivelyError rate per application server

When to use something else

WhatExampleInstead use...
Metrics reported by heterogeneous groupsResource metrics (e.g. free memory) across disparate instance typesThreshold alerts on normalized values (e.g. percent memory available)
Metrics that can easily be skewed by random distributionsp99 latency for individual app serversThreshold alerts on aggregate p99 latency at the service level
Metrics from ephemeral infrastructure componentsThroughput metrics for short-lived app containersChange alerts on aggregated, service-level metrics

Anomaly alerts

Anomaly detection on timeseries metrics

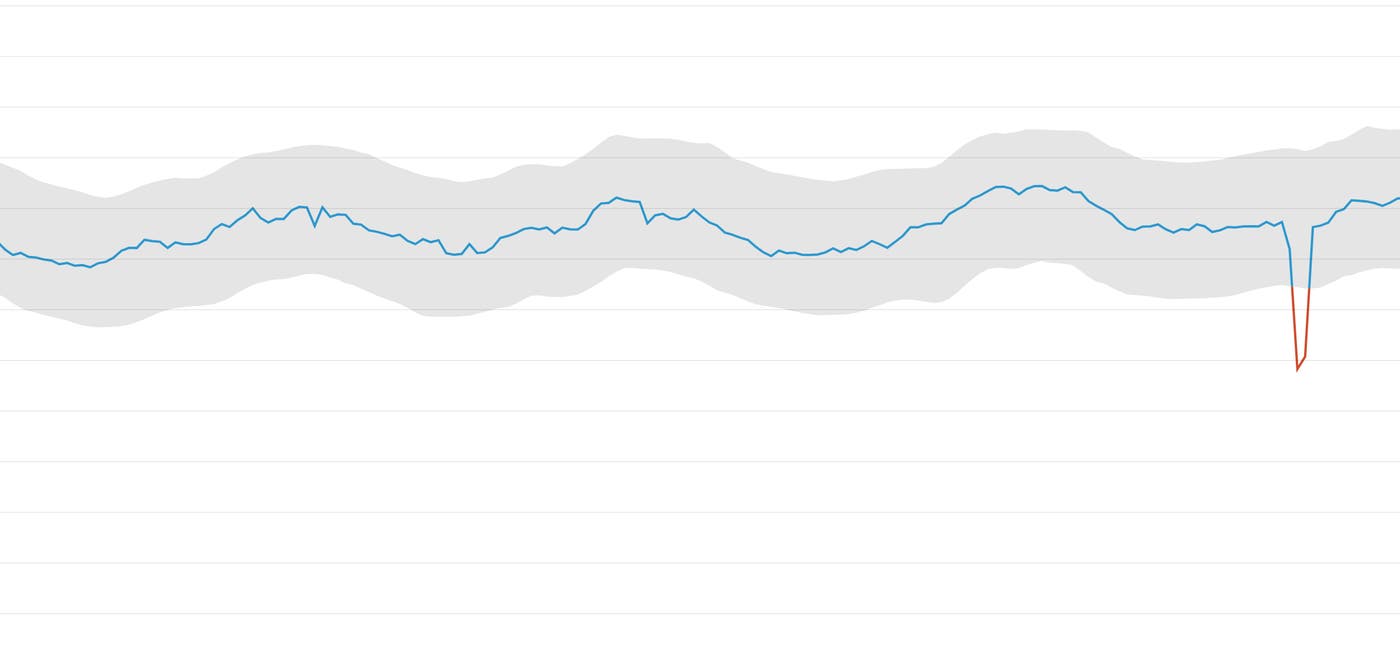
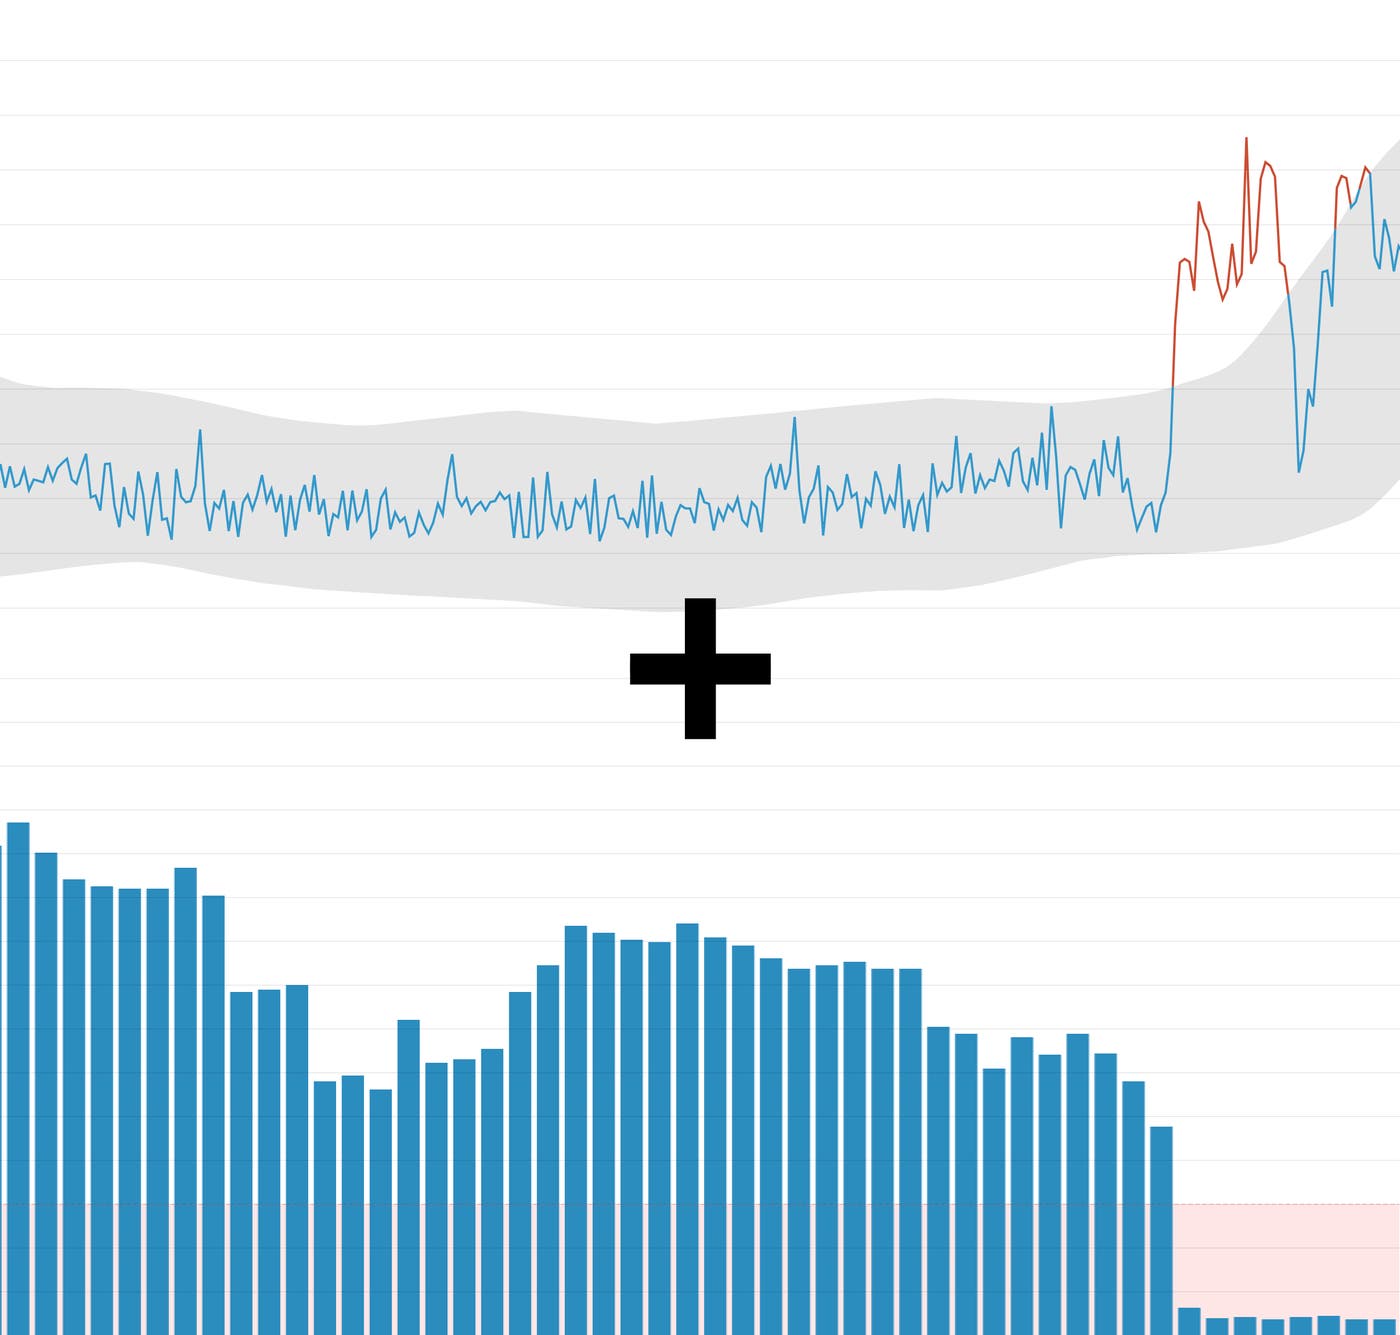
Whereas outlier detection looks for deviations from group behavior in the moment, anomaly detection looks for deviations from recent historical trends. An anomaly alert can account for seasonality (such as daily traffic patterns), allowing you to get notified only when metric peaks or drops cannot be explained by normal, periodic fluctuations.

When to use anomaly alerts

WhatWhyExample
Metrics with expected temporal patternsTo isolate problematic changes from normal fluctuationsLoad balancer throughput for a user-facing application
Metrics with a long-term directional trendTo set robust alerts on metrics with a steadily shifting baselineTransactions processed on an expanding e-commerce platform

When to use something else

WhatExampleInstead use...
Metrics with unpredictable spikes or dipsThroughput for intermittent data-processing jobsEvent alert for absence of job completion

Event alerts

Alert evaluating multiple events over time

Unlike metric alerts, which evaluate a continuous stream of timeseries data, event alerts trigger on discrete occurrences, which may be quite rare. For instance, you might wish to trigger an alert whenever a nightly batch data-processing job fails to complete. Importantly, events can carry much more context than a single timeseries datapoint can. For example, an event generated by a failed run of a configuration management tool can include the actual error message returned, as well as a link to related events in the past.

Even though individual events are discrete, you can still monitor their occurrence over time by counting instances of an event over a particular timespan. For example, you can set an alert to fire whenever a particular service restarts more than three times in a five-minute interval.

When to use event alerts

WhatWhyExample
Completion of critical actionsTo ensure that scheduled or intermittent work is carried outNightly build did not complete
Unexpected or forbidden activityTo monitor for possible breaches or abusesRepeated login failures

Composite alerts

Composite alerts for more complex alerting logic

Composite alerts allow you to build more complex evaluation logic into your alert definitions. With a composite alert, you can specify that an alert fires if and only if a number of specific conditions are met. For example, you might want to alert on multiple indicators of service health, such as the locking rate in your database and the latency of your query service, where correlated trends can point to recurring issues. Or you might want to set a threshold alert on the length of your messaging queue, but withhold an alert shortly after a service restart, when a brief surge in queue length is expected.

When to use composite alerts

WhatWhyExample
Multiple indicators that together point to a particular problemTo alert on known issues that manifest with multiple symptomsIncreased 404 error rate combined with surge in web requests per second
Issues that have a routine explanationTo withhold alerts on deviations that are expected under certain circumstancesSpike in traffic to e-commerce site after flash sale announcement

Stay alert!

In this post we have covered several alert types that you can set on metrics or events from your infrastructure. By understanding the ideal use cases for each of these alert types, as well as the status checks covered in the companion post, you can ensure that you are notified of critical issues in your environment as quickly as possible.