









Blocked queries are one of the key issues faced by database analysts, engineers, and anyone managing database performance at scale. Blocking can be caused by inefficient query or database design as well as resource saturation, and can lead to increased latency, errors, and user frustration. Pinpointing root blockers—the underlying problematic queries that set off cascading locks on database resources—is key to troubleshooting and remediating database performance issues. But it also tends to be difficult, especially when it comes to historical analysis.
Datadog Database Monitoring now provides in-depth visibility into root blocking queries, enabling you to quickly survey and troubleshoot blocked connections and suboptimal performance across your entire fleet of databases and hosts. Database Monitoring lets you quickly assess the number of blocked active connections for each of your hosts and databases and provides detailed insights that enable you to zero in on root blockers. You can also use it to inspect the active connections to each of your databases and hosts and isolate any blocking activity in order to quickly troubleshoot incidents.
In this post, we’ll provide an overview of using Database Monitoring to identify and investigate root blockers, which enables you to monitor and optimize overall database performance and troubleshoot incidents affecting that performance.
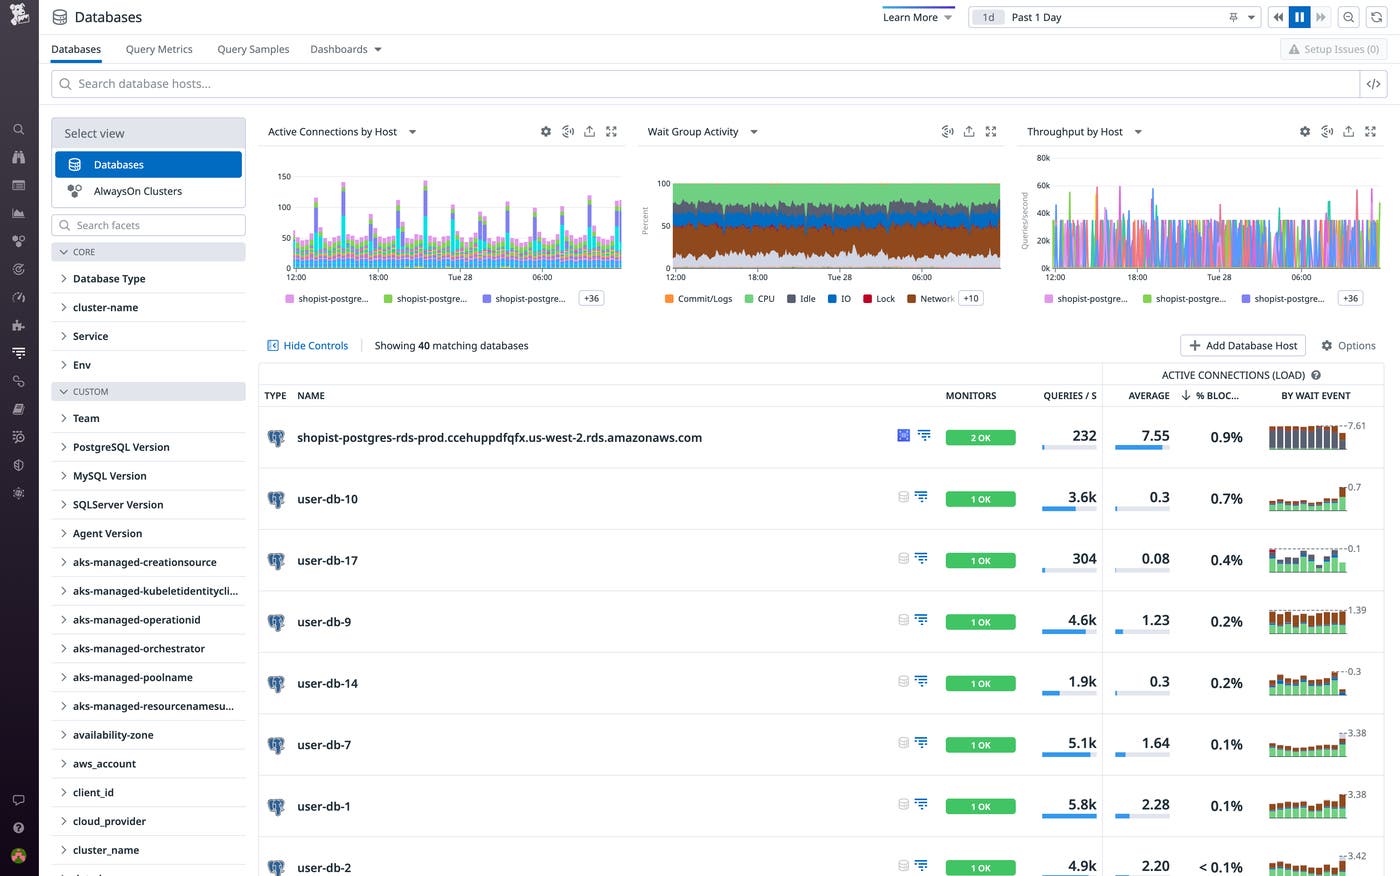
Database Monitoring now lets you sort your hosts and databases by the percentage of blocked active connections to each, so you can quickly determine if and where blocking is occurring and where to focus your optimization efforts.
Blocking Summaries for each of your databases and hosts provide precise pictures of blocking activity over any given time frame, graphing and tabulating the root blockers as well as the queries they have caused or are actively causing to wait. Each Blocking Summary allows you to quickly get to the root of blocked database connections by:
Zeroing in on the precise query statements causing blocking
Identifying which queries have waited as a result of those blockers
Determining how many times a specific blocker has occurred
Determining the maximum blocking and waiting times caused by those blockers within a specified time frame
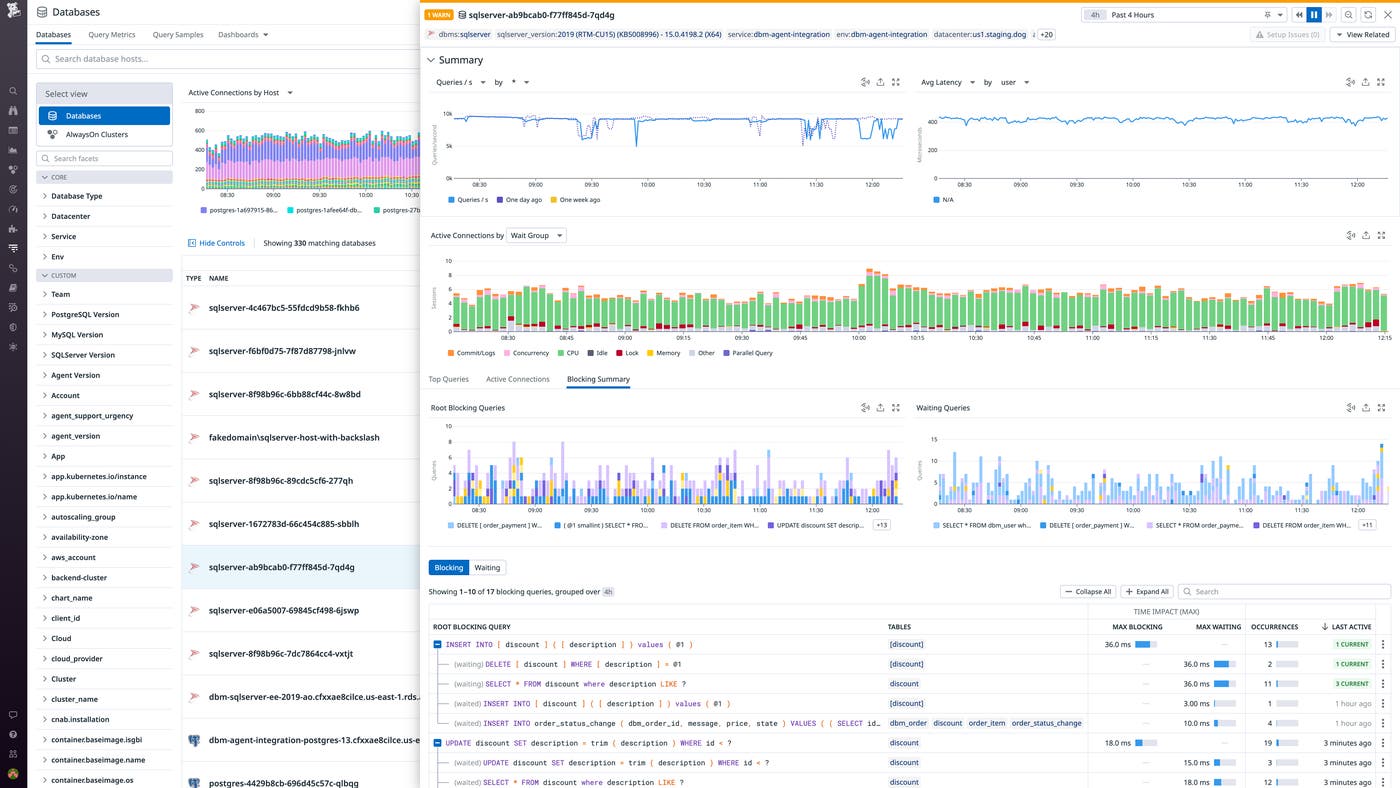
The Blocking Summary table offers separate Blocking and Waiting views, which you can toggle between to assess what is causing the most blocks overall or what is causing specific queries to wait.
You can select any blocking query within a Blocking Summary to open the Query Details panel, which displays in-depth information on individual queries, including their query statements and a catalog of the historical instances in which they’ve blocked other queries, as well as of the databases and hosts on which that blocking occurred. Under this panel’s Metrics tab, you can view historical metrics to see how specific queries have performed over time, which can help you gauge how those queries have been affected by blockers.
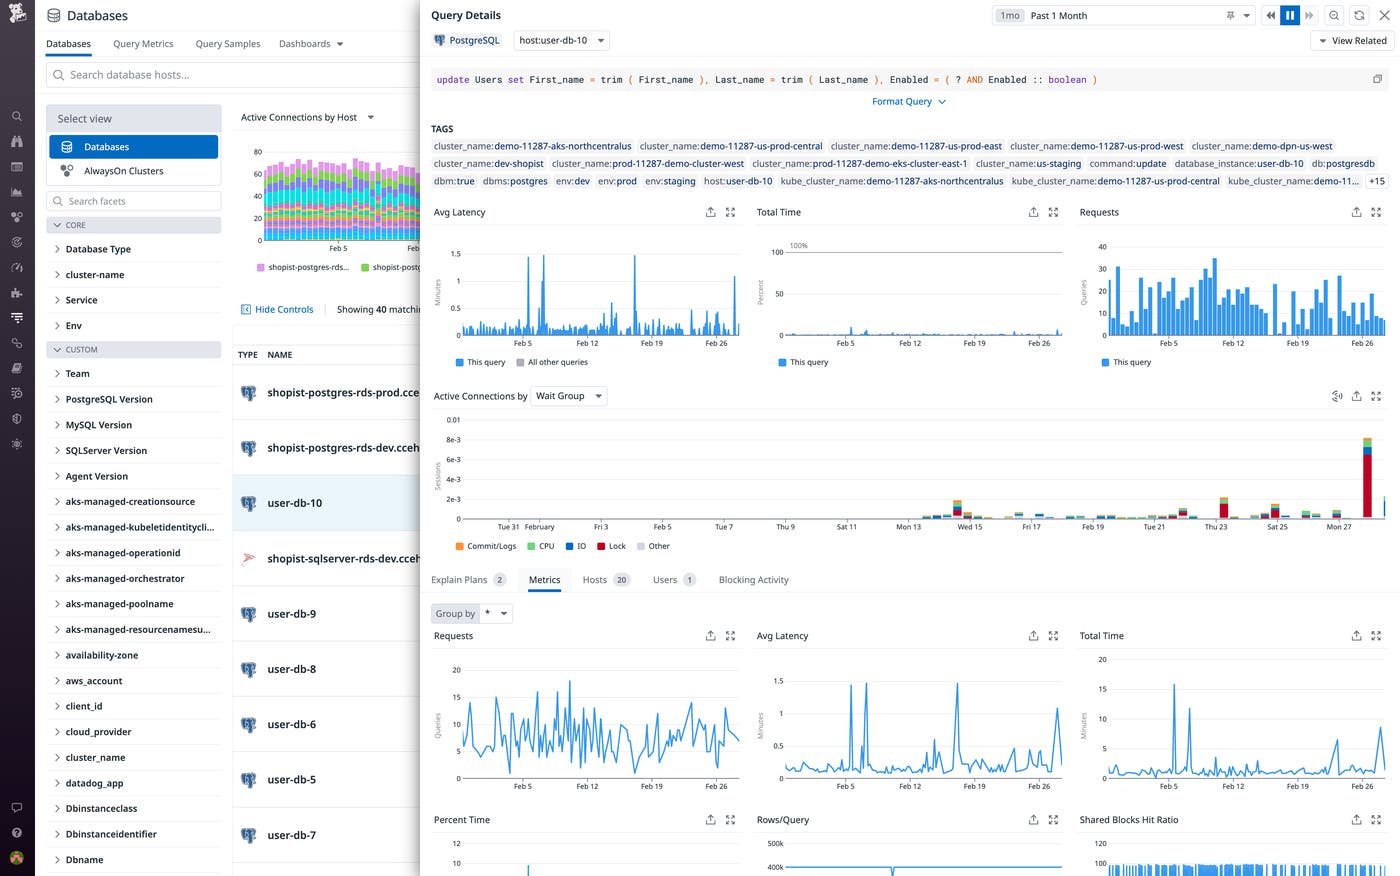
Database Monitoring also now clarifies the frequently cryptic wait events generated by databases by breaking them down into wait groups: easy-to-understand categories such as CPU, Commit/Logs, IO, and Lock. By shedding light on the percentage of time each query spends in each wait group, it enables you to quickly grasp blocking activity and speed up troubleshooting.
Detailed insights such as these can be critical for optimizing overall database performance. For example, if you’re seeing sporadic but consistent locking on a host, its Blocking Summary can help you quickly get to the root of the problem. You can use it to analyze query activity, determine whether and how to change specific queries or how they’re being run at the application level, and initiate the remediation process.
The new, in-depth visibility Database Monitoring provides into blocked queries can be instrumental for identifying and troubleshooting incidents that are affecting database performance. For example, if Database Monitoring shows a spike in the percentage of blocked connections to one of your hosts or databases, that may indicate an ongoing incident.
You can troubleshoot incidents affecting database performance via the Active Connections tab to view the full lock chain for the affected host or database. The Last Active column on the Blocking Summary table also flags any currently active blockers so you can quickly identify the blocking Session ID (for SQL Server databases) or Process ID (for Postgres databases). Selecting a current blocker from this table takes you to the Active Connections tab, where you can toggle the summary of active connections to show blocking activity only. This allows you to focus in on blocking activity with precision at any given moment, displaying the query statements for all currently blocked and waiting queries, as well as their PIDs or SIDs.
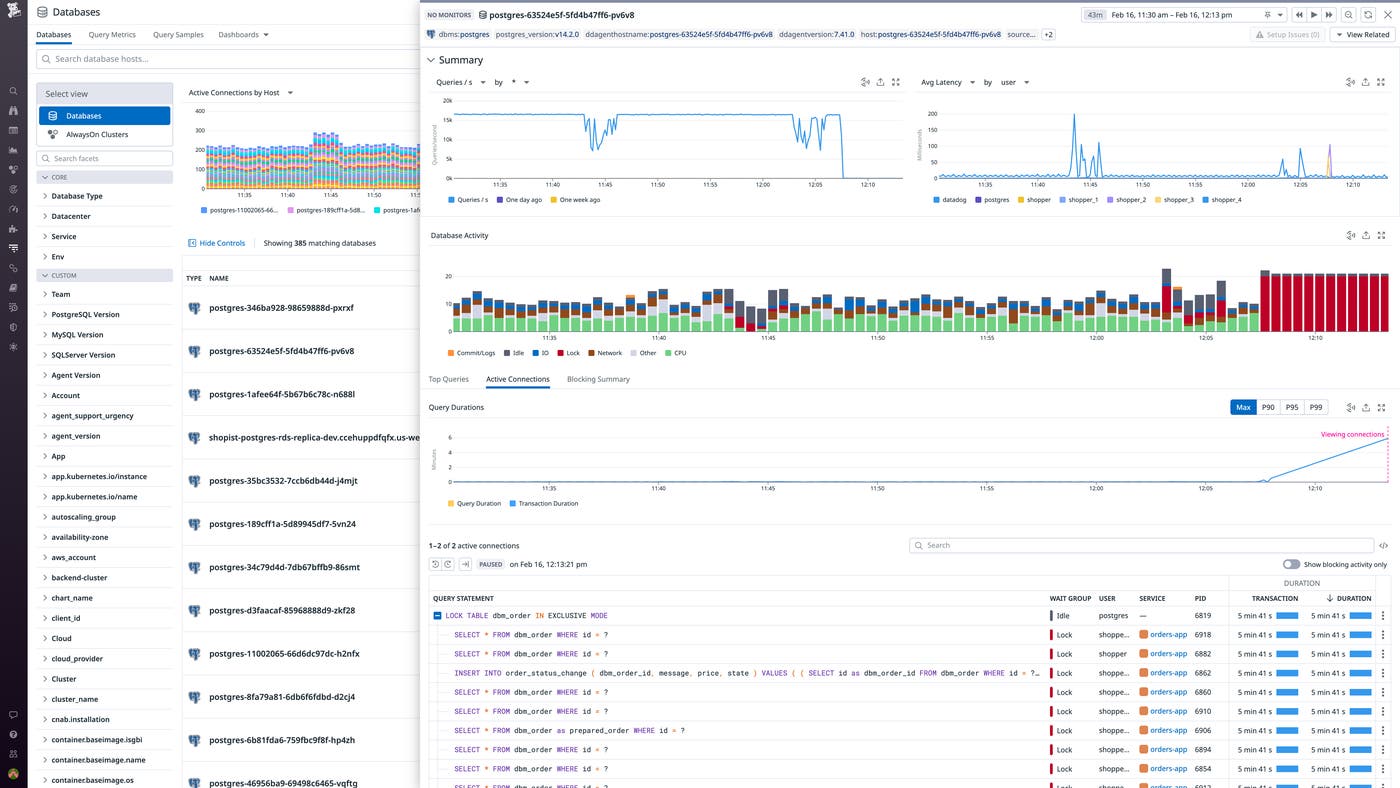
For example, if you have a lock pileup in your database—in which a lot of transactions are waiting on one or more others—you’ll want to quickly identify its exact causes. The Active Connections tab enables you to easily home in on root blockers and suss out key troubleshooting insights, such as how long they’ve been blocking other queries, how many other connections they’re blocking, and what types of queries they’re blocking. If you have direct access to the affected database, Database Monitoring enables you to take direct action by using the PIDs or SIDs provided under Active Connections to manually kill the processes behind the root blockers. This may be advisable in cases of anomalous blockers that aren’t necessarily persistent systemic issues but are blocking a lot of connections—killing the processes behind these types of blockers can help you reduce the load on your database and quickly mitigate performance issues.
Database Monitoring now enables you to quickly get to the root of blockers in your Postgres and SQL Server databases. The new visibility it provides can be critical for troubleshooting and timely remediation of database performance issues, as well as general performance optimization.
Get started with Database Monitoring today to improve the overall performance of your databases and quickly get to the root of blocked queries. If you’re new to Datadog, sign up for a 14-day free trial.
此内容由惯性聚合(RSS阅读器)自动聚合整理,仅供阅读参考。 原文来自 — 版权归原作者所有。