惯性聚合 高效追踪和阅读你感兴趣的博客、新闻、科技资讯
阅读原文 在惯性聚合中打开

推荐订阅源

博客园 - 司徒正美
大猫的无限游戏
大猫的无限游戏
Scott Helme
Scott Helme
CTFtime.org: upcoming CTF events
S
Secure Thoughts
Google DeepMind News
博客园_首页
Hacker News: Ask HN
Hacker News: Ask HN
量子位
Jina AI
Jina AI
I
InfoQ
V
V2EX
Martin Fowler
Martin Fowler
Y
Y Combinator Blog
H
Hackread – Cybersecurity News, Data Breaches, AI and More
人人都是产品经理
人人都是产品经理
B
Blog
IT之家
IT之家
云风的 BLOG
云风的 BLOG
奇客Solidot–传递最新科技情报
奇客Solidot–传递最新科技情报
博客园 - Franky
博客园 - 【当耐特】
N
Netflix TechBlog - Medium
Cloudbric
Cloudbric
H
Heimdal Security Blog
TaoSecurity Blog
TaoSecurity Blog
S
Security @ Cisco Blogs
U
Unit 42
Project Zero
Project Zero
Webroot Blog
Webroot Blog
The Register - Security
N
News | PayPal Newsroom
Microsoft Security Blog
H
Help Net Security
Forbes - Security
Forbes - Security
宝玉的分享
宝玉的分享
Last Week in AI
Last Week in AI
C
Check Point Blog
博客园 - 聂微东
M
MIT News - Artificial intelligence
有赞技术团队
有赞技术团队
D
DataBreaches.Net
Cyberwarzone
Cyberwarzone
N
News and Events Feed by Topic
N
News and Events Feed by Topic
Simon Willison's Weblog
J
Java Code Geeks
G
Google Developers Blog
GbyAI
GbyAI
T
Threatpost

Datadog | The Monitor blog

Introducing our open source AI-native SAST Instrument and monitor Boomi integration flows with OpenTelemetry and Datadog Not all index scans are equal: How we cut query latency by over 99% Platform engineering metrics: What to measure and what to ignore Integrate Recorded Future threat intelligence with Datadog Cloud SIEM CI/CD security: threat modeling using a MITRE-style threat matrix CI/CD security: How to secure your GitHub ecosystem Ingress NGINX is EOL: A practical guide for migrating to Kubernetes Gateway API Operating agentic AI with Amazon Bedrock AgentCore and Datadog LLM Observability: Lessons from NTT DATA Introducing the Datadog Code Security MCP Capture and analyze custom heatmaps in Session Replay Understand session replays faster with AI summaries and smart chapters Monitor ClickHouse query performance with Datadog Database Monitoring How we designed empathetic alert sounds for on-call engineers Search and act across Datadog to resolve issues faster with Bits Assistant Measure the business impact of every product change with Datadog Experiments Analyzing round trip query latency Configuring JavaScript caches for better performance Introducing Bits AI Dev Agent for Code Security Datadog achieves ISO 42001 certification for responsible AI Monitor Nutanix clusters, hosts, and VMs with Datadog Monitor Juniper Mist in Datadog A new Host Map for modern infrastructure Annotate traces to improve LLM quality with Datadog LLM Observability What’s new in Cloud SIEM: AI-powered investigations, enhanced threat intelligence, and scalable security operations Explore Kubernetes with native OpenTelemetry data Monitor Oracle Fusion Cloud Applications with Datadog Announcing the Datadog Terraform provider v4.0.0 Scaling Kubernetes workloads on custom metrics How to design cloud environments for AI-powered threat analysis Monitor Aruba Central in Datadog How we centralize and remediate risks with Datadog Case Management Accelerate incident response with Datadog and ServiceNow Monitor your application and network load balancer logs Understanding Karpenter architecture for Kubernetes autoscaling Tools for collecting metrics and logs from Karpenter Monitor Karpenter with Datadog What your product data is actually saying Key metrics for monitoring Karpenter Securing Datadog’s platform in the AI age: The role of observability data Four ways engineering teams use the Datadog MCP Server to power AI agents Approaching your observability migration with the right mindset Meet the new Bits AI SRE: Deeper reasoning, twice as fast Key learnings from the 2026 State of DevSecOps study Use plain English to query your multi-cloud infrastructure in Resource Catalog Simplifying troubleshooting across the user journey with Datadog Synthetic Monitoring Protect your OCI resources with Datadog Cloud Security This Month in Datadog - February 2026 Amazon EC2 security: How misconfigured and public AMIs expand your cloud attack surface Enable end-to-end visibility into your Java apps with a single command Measure and improve mobile app startup performance with Datadog RUM Evaluating our AI Guard application to improve quality and control cost Identify untested code across every level of your codebase Make use of guardrail metrics and stop babysitting your releases Monitor Versa Networks SD-WAN performance in Datadog Improve performance and reliability with APM Recommendations Remediate transitive vulnerabilities faster with Datadog Software Composition Analysis Generate audit-ready vulnerability and compliance reports with Datadog Sheets Monitor Fortinet FortiManager performance in Datadog Improve test coverage across codebases with Datadog Code Coverage Move fast, don’t break things: Consistent testing standards at scale Enrich logs with ServiceNow CMDB context before routing to any SIEM or logging tool Monitor Lustre with Datadog Make faster, better product decisions with Datadog Product Analytics Surface and remediate runtime posture issues with Workload Protection Findings Protect agentic AI applications with Datadog AI Guard How to optimize JavaScript code with CSS Trace Google Pub/Sub workloads in Cloud Run with Datadog Detect human names in logs with ML in Sensitive Data Scanner How we cut our NLQ agent debugging time from hours to minutes with LLM Observability Debug PostgreSQL query latency faster with EXPLAIN ANALYZE in Datadog Database Monitoring Datadog acquires Propolis Unify and correlate frontend and backend data with retention filters Scale compliance across global frameworks with Datadog Cloud Security Monitor Arista VeloCloud SD-WAN performance with Datadog Building reliable dashboard agents with Datadog LLM Observability Simplify log collection and aggregation for MSSPs with Datadog Observability Pipelines Mitigation for Node.js denial-of-service vulnerability affecting Datadog APM Automate flaky test fixes with the Bits AI Dev Agent and Test Optimization How we built an AI SRE agent that investigates like a team of engineers Datadog integrations 2025 recap: Observability for AI, security, and hybrid cloud Design effective executive dashboards with Datadog Implement dbt data quality checks with dbt-expectations Bring faster visibility into AWS Lambda functions with remote instrumentation Troubleshoot faster with the GitLab Source Code integration in Datadog How Cambia Health Solutions saved $30,000 monthly with Cloud Cost Management and the Datadog Resource Catalog Normalize any logs for Cloud SIEM with Datadog's OCSF processor Optimizing Datadog at scale: Cost-efficient observability at Zendesk Detect, diagnose, and resolve network issues easily with CNM Network Health Connect engineering errors to user impact in early-stage products Cilium configuration for Kubernetes operations at scale Designing feedback loops for progressive delivery Ship features faster and safer with Datadog Feature Flags Choosing the right OpenTelemetry Collector distribution Route your monitor alerts with Datadog monitor notification rules Automate Cloud SIEM investigations with Bits AI Security Analyst Cloud threat detection: How to identify risky activity across control and data planes Collecting Kafka performance metrics Monitoring Kafka with Datadog Monitoring Kafka performance metrics
Troubleshoot blocking queries with Datadog Database Monitoring
Aaron Kaplan, Jason Manson-Hing · 2023-03-01 · via Datadog | The Monitor blog

Blocked queries are one of the key issues faced by database analysts, engineers, and anyone managing database performance at scale. Blocking can be caused by inefficient query or database design as well as resource saturation, and can lead to increased latency, errors, and user frustration. Pinpointing root blockers—the underlying problematic queries that set off cascading locks on database resources—is key to troubleshooting and remediating database performance issues. But it also tends to be difficult, especially when it comes to historical analysis.

Datadog Database Monitoring now provides in-depth visibility into root blocking queries, enabling you to quickly survey and troubleshoot blocked connections and suboptimal performance across your entire fleet of databases and hosts. Database Monitoring lets you quickly assess the number of blocked active connections for each of your hosts and databases and provides detailed insights that enable you to zero in on root blockers. You can also use it to inspect the active connections to each of your databases and hosts and isolate any blocking activity in order to quickly troubleshoot incidents.

In this post, we’ll provide an overview of using Database Monitoring to identify and investigate root blockers, which enables you to monitor and optimize overall database performance and troubleshoot incidents affecting that performance.

Monitor and optimize overall database performance

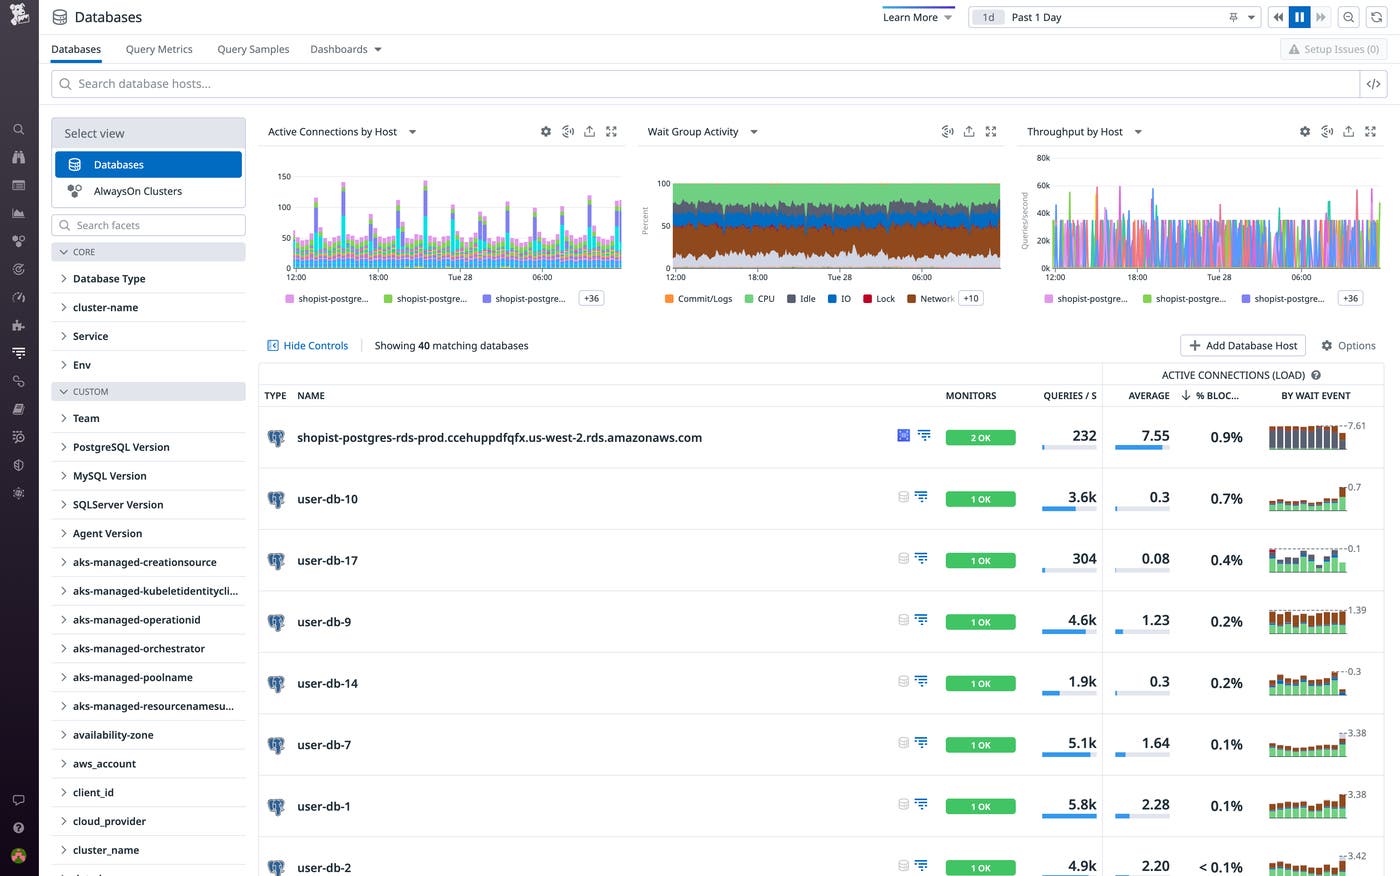
Database Monitoring now lets you sort your hosts and databases by the percentage of blocked active connections to each, so you can quickly determine if and where blocking is occurring and where to focus your optimization efforts.

Sorting databases and hosts by percentage of blocked connections to each

Blocking Summaries for each of your databases and hosts provide precise pictures of blocking activity over any given time frame, graphing and tabulating the root blockers as well as the queries they have caused or are actively causing to wait. Each Blocking Summary allows you to quickly get to the root of blocked database connections by:

  • Zeroing in on the precise query statements causing blocking

  • Identifying which queries have waited as a result of those blockers

  • Determining how many times a specific blocker has occurred

  • Determining the maximum blocking and waiting times caused by those blockers within a specified time frame

Database Monitoring provides a detailed Blocking Summary for each of your databases and hosts

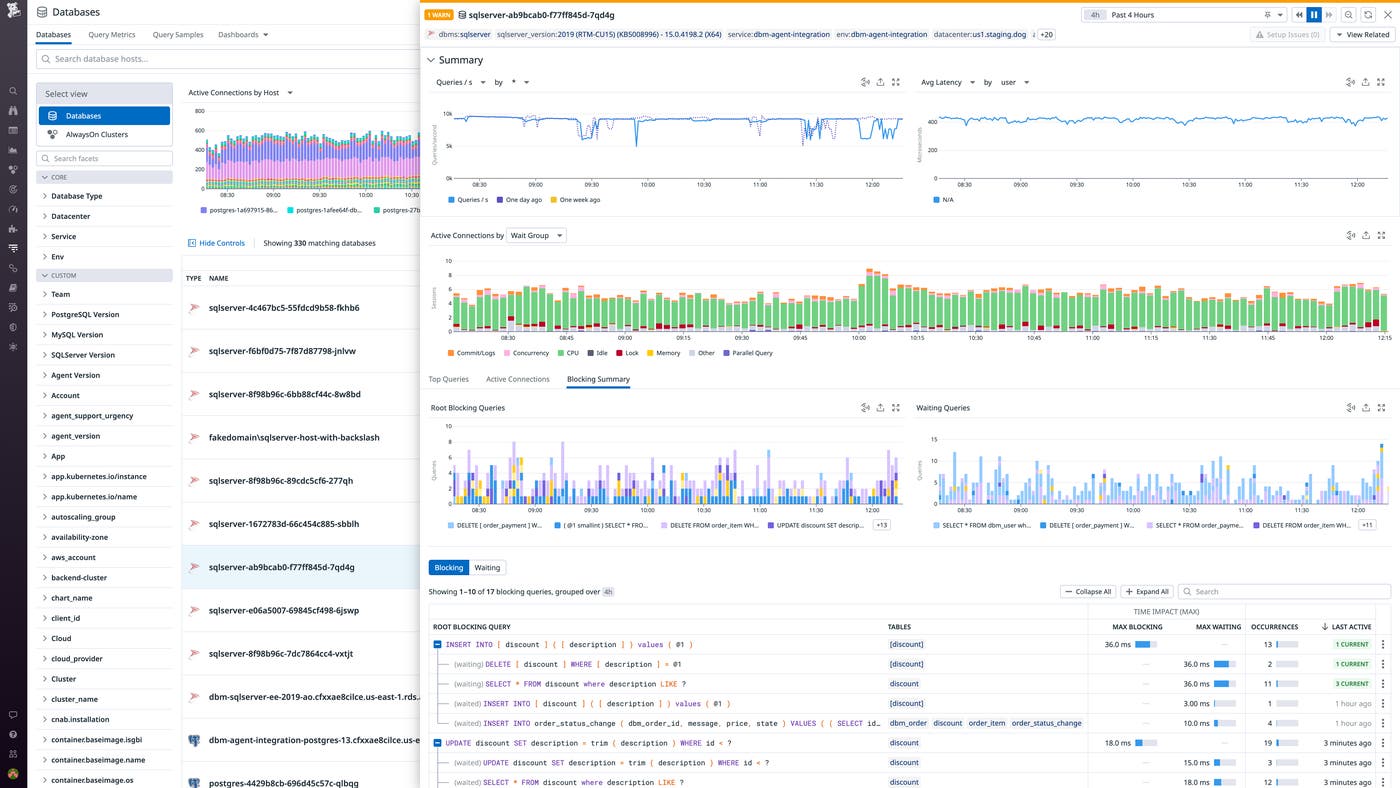
The Blocking Summary table offers separate Blocking and Waiting views, which you can toggle between to assess what is causing the most blocks overall or what is causing specific queries to wait.

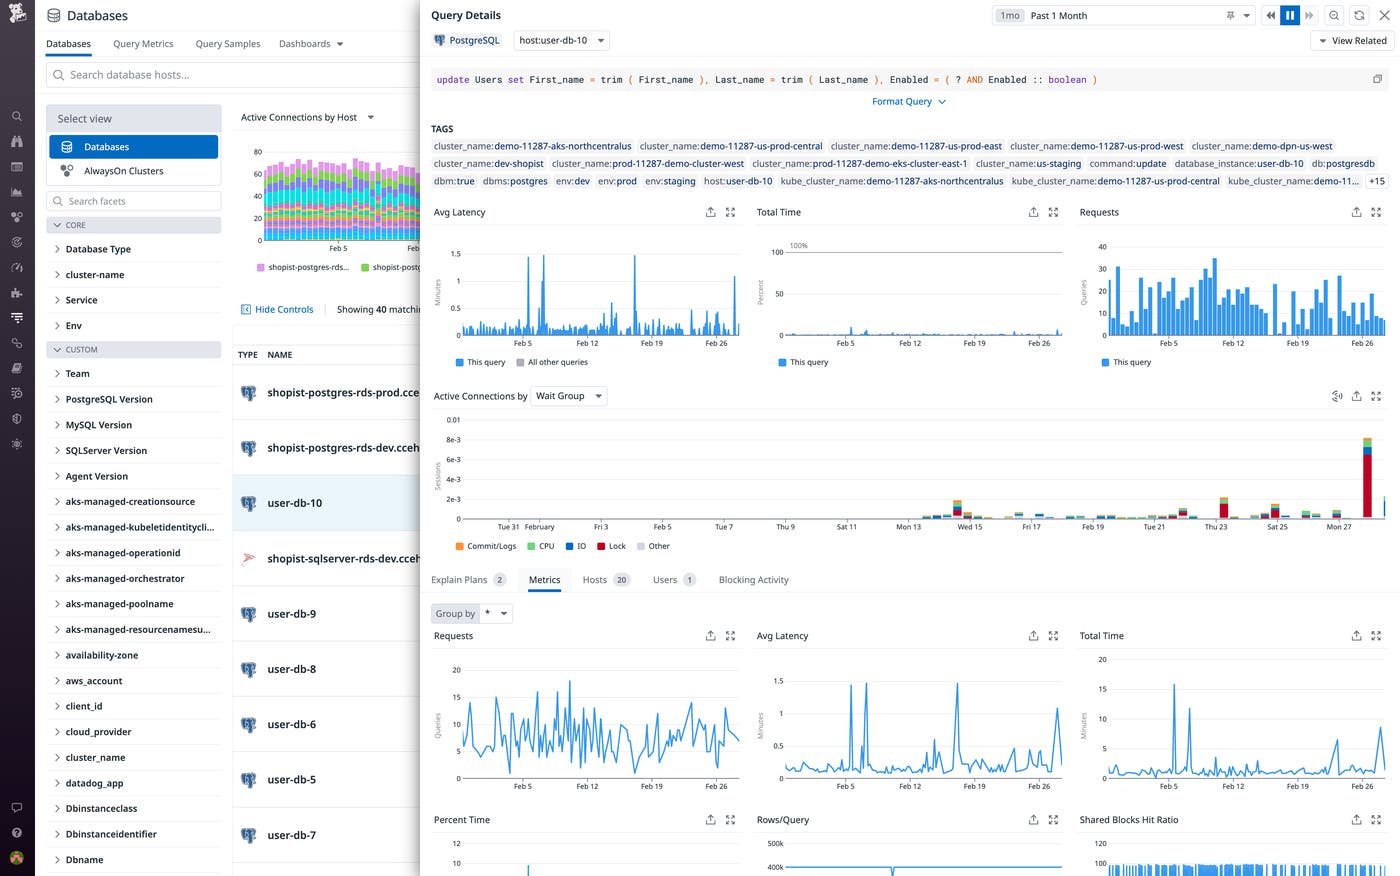
You can select any blocking query within a Blocking Summary to open the Query Details panel, which displays in-depth information on individual queries, including their query statements and a catalog of the historical instances in which they’ve blocked other queries, as well as of the databases and hosts on which that blocking occurred. Under this panel’s Metrics tab, you can view historical metrics to see how specific queries have performed over time, which can help you gauge how those queries have been affected by blockers.

Query performance metrics in the Query Details panel

Database Monitoring also now clarifies the frequently cryptic wait events generated by databases by breaking them down into wait groups: easy-to-understand categories such as CPU, Commit/Logs, IO, and Lock. By shedding light on the percentage of time each query spends in each wait group, it enables you to quickly grasp blocking activity and speed up troubleshooting.

Detailed insights such as these can be critical for optimizing overall database performance. For example, if you’re seeing sporadic but consistent locking on a host, its Blocking Summary can help you quickly get to the root of the problem. You can use it to analyze query activity, determine whether and how to change specific queries or how they’re being run at the application level, and initiate the remediation process.

Troubleshoot incidents affecting database performance

The new, in-depth visibility Database Monitoring provides into blocked queries can be instrumental for identifying and troubleshooting incidents that are affecting database performance. For example, if Database Monitoring shows a spike in the percentage of blocked connections to one of your hosts or databases, that may indicate an ongoing incident.

You can troubleshoot incidents affecting database performance via the Active Connections tab to view the full lock chain for the affected host or database. The Last Active column on the Blocking Summary table also flags any currently active blockers so you can quickly identify the blocking Session ID (for SQL Server databases) or Process ID (for Postgres databases). Selecting a current blocker from this table takes you to the Active Connections tab, where you can toggle the summary of active connections to show blocking activity only. This allows you to focus in on blocking activity with precision at any given moment, displaying the query statements for all currently blocked and waiting queries, as well as their PIDs or SIDs.

dbm-active-connections-2

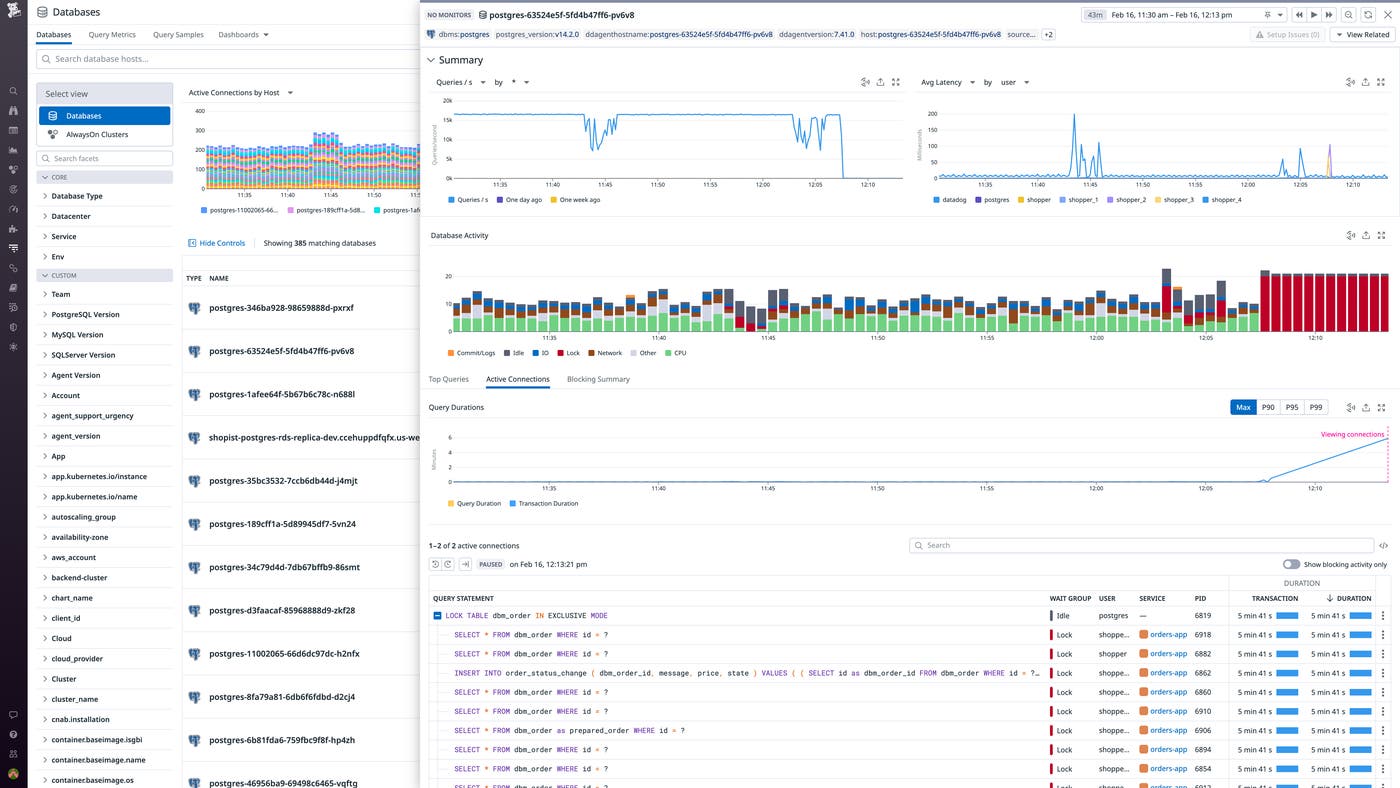
For example, if you have a lock pileup in your database—in which a lot of transactions are waiting on one or more others—you’ll want to quickly identify its exact causes. The Active Connections tab enables you to easily home in on root blockers and suss out key troubleshooting insights, such as how long they’ve been blocking other queries, how many other connections they’re blocking, and what types of queries they’re blocking. If you have direct access to the affected database, Database Monitoring enables you to take direct action by using the PIDs or SIDs provided under Active Connections to manually kill the processes behind the root blockers. This may be advisable in cases of anomalous blockers that aren’t necessarily persistent systemic issues but are blocking a lot of connections—killing the processes behind these types of blockers can help you reduce the load on your database and quickly mitigate performance issues.

Quickly get to the root of blocked queries in your databases

Database Monitoring now enables you to quickly get to the root of blockers in your Postgres and SQL Server databases. The new visibility it provides can be critical for troubleshooting and timely remediation of database performance issues, as well as general performance optimization.

Get started with Database Monitoring today to improve the overall performance of your databases and quickly get to the root of blocked queries. If you’re new to Datadog, sign up for a 14-day free trial.