










Kai Xin Tai
MongoDB Atlas is a fully managed cloud database service for modern applications. Earlier this year, the MongoDB team released MongoDB Atlas for Government, a dedicated environment for US federal agencies and state, local, and education (SLED) entities that need to meet stringent security and compliance requirements. Atlas for Government, which has achieved FedRAMP Ready and FedRAMP In-Process designations, can be deployed in AWS GovCloud, allowing organizations already operating in this environment to quickly get up and running with this robust database platform. It supports Atlas’s core features, as well as a few additions that are unique to GovCloud.
We’re pleased to announce that Datadog for Government now integrates with Atlas for Government, giving you a safe and secure way to monitor the health and performance of your database clusters alongside the rest of your infrastructure telemetry. Our Atlas for Government integration comes with the same capabilities as our standard Atlas integration, which means that you’ll have a consistent monitoring experience regardless of the version you’re running.
Once you enable the Atlas for Government integration, you will begin to see key database metrics like throughput, latency, and resource utilization flowing into an out-of-the-box dashboard. This data enables you to identify and address fluctuations in the same metrics that are important to monitor in the standard version of Atlas, such as unexpected spikes in throughput, slowdowns in reads and writes, and connection failures.
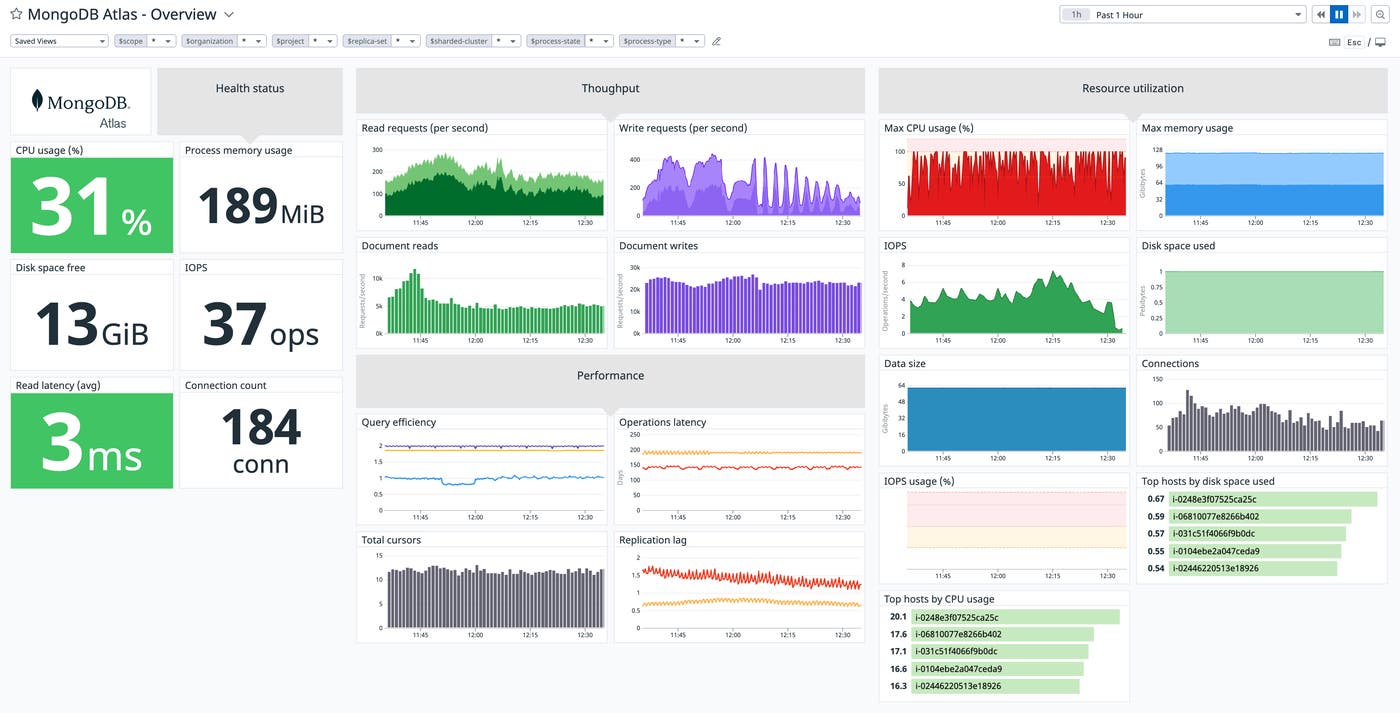
You can also clone and customize this dashboard to include metrics from the rest of your cloud-hosted and on-premises services for a fuller picture of your application’s performance. For instance, you can correlate the amount of traffic your load balancer is handling with that of individual Atlas for Government instances to see if load is getting evenly distributed. By bringing operational data from across your entire environment into a single view, Datadog allows you to easily identify bottlenecks and troubleshoot issues—without having to switch between tools.
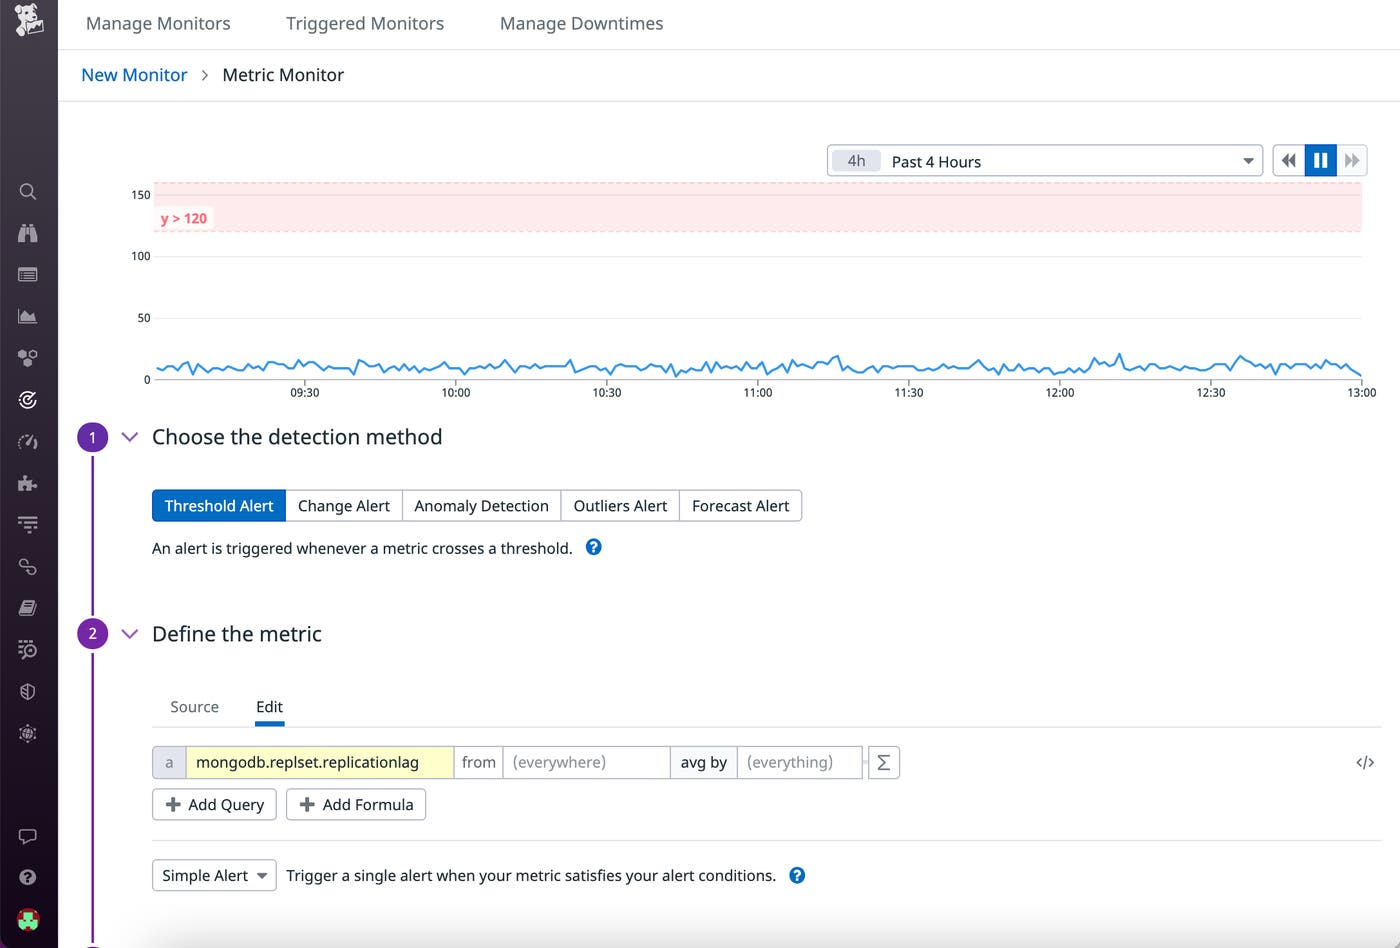
Datadog also lets you go beyond reactive monitoring with proactive notifications. For instance, you might want to configure an alert to inform you when replication lag—the delay in copying a write operation on the primary node to a secondary node—exceeds a certain threshold. If this alert triggers, you’ll want to check for increased network latency or long-running operations on the primary node. Refer to MongoDB’s documentation for other possible causes.
With Datadog for Government and MongoDB Atlas for Government, US federal and SLED agencies can modernize their legacy systems, innovate faster, and improve the reliability of their services—while complying with strict regulations. Check out our other MongoDB blog posts for more tips on monitoring your database clusters.
To get started with MongoDB Atlas for Government, get in touch with the MongoDB team here. You can then enable the MongoDB Atlas for Government integration right away, if you already have a Datadog for Government account. If not, sign up for a 14-day free trial of Datadog today.
此内容由惯性聚合(RSS阅读器)自动聚合整理,仅供阅读参考。 原文来自 — 版权归原作者所有。