惯性聚合 高效追踪和阅读你感兴趣的博客、新闻、科技资讯
阅读原文 在惯性聚合中打开

推荐订阅源

P
Proofpoint News Feed
Microsoft Azure Blog
Jina AI
Jina AI
博客园_首页
宝玉的分享
宝玉的分享
The Cloudflare Blog
钛媒体:引领未来商业与生活新知
钛媒体:引领未来商业与生活新知
量子位
T
Tailwind CSS Blog
雷峰网
雷峰网
Blog — PlanetScale
Blog — PlanetScale
Last Week in AI
Last Week in AI
奇客Solidot–传递最新科技情报
奇客Solidot–传递最新科技情报
Hugging Face - Blog
Hugging Face - Blog
月光博客
月光博客
罗磊的独立博客
F
Fortinet All Blogs
酷 壳 – CoolShell
酷 壳 – CoolShell
Stack Overflow Blog
Stack Overflow Blog
J
Java Code Geeks
V
V2EX
OSCHINA 社区最新新闻
OSCHINA 社区最新新闻
The GitHub Blog
The GitHub Blog
Apple Machine Learning Research
博客园 - 聂微东
U
Unit 42
freeCodeCamp Programming Tutorials: Python, JavaScript, Git & More
Cyber Security Advisories - MS-ISAC
D
Docker
阮一峰的网络日志
阮一峰的网络日志
I
InfoQ
Simon Willison's Weblog
D
DataBreaches.Net
Threat Intelligence Blog | Flashpoint
I
Intezer
Scott Helme
Scott Helme
B
Blog
M
MIT News - Artificial intelligence
K
Kaspersky official blog
H
Help Net Security
V
Vulnerabilities – Threatpost
C
CXSECURITY Database RSS Feed - CXSecurity.com
Engineering at Meta
Engineering at Meta
博客园 - 【当耐特】
L
Lohrmann on Cybersecurity
P
Privacy & Cybersecurity Law Blog
Project Zero
Project Zero
The Hacker News
The Hacker News
B
Blog RSS Feed
T
Tor Project blog

Datadog | The Monitor blog

Introducing our open source AI-native SAST Instrument and monitor Boomi integration flows with OpenTelemetry and Datadog Not all index scans are equal: How we cut query latency by over 99% Platform engineering metrics: What to measure and what to ignore Integrate Recorded Future threat intelligence with Datadog Cloud SIEM CI/CD security: threat modeling using a MITRE-style threat matrix CI/CD security: How to secure your GitHub ecosystem Ingress NGINX is EOL: A practical guide for migrating to Kubernetes Gateway API Operating agentic AI with Amazon Bedrock AgentCore and Datadog LLM Observability: Lessons from NTT DATA Introducing the Datadog Code Security MCP Capture and analyze custom heatmaps in Session Replay Understand session replays faster with AI summaries and smart chapters Monitor ClickHouse query performance with Datadog Database Monitoring How we designed empathetic alert sounds for on-call engineers Search and act across Datadog to resolve issues faster with Bits Assistant Measure the business impact of every product change with Datadog Experiments Analyzing round trip query latency Configuring JavaScript caches for better performance Introducing Bits AI Dev Agent for Code Security Datadog achieves ISO 42001 certification for responsible AI Monitor Nutanix clusters, hosts, and VMs with Datadog Monitor Juniper Mist in Datadog A new Host Map for modern infrastructure Annotate traces to improve LLM quality with Datadog LLM Observability What’s new in Cloud SIEM: AI-powered investigations, enhanced threat intelligence, and scalable security operations Explore Kubernetes with native OpenTelemetry data Monitor Oracle Fusion Cloud Applications with Datadog Announcing the Datadog Terraform provider v4.0.0 Scaling Kubernetes workloads on custom metrics How to design cloud environments for AI-powered threat analysis Monitor Aruba Central in Datadog How we centralize and remediate risks with Datadog Case Management Accelerate incident response with Datadog and ServiceNow Monitor your application and network load balancer logs Understanding Karpenter architecture for Kubernetes autoscaling Tools for collecting metrics and logs from Karpenter Monitor Karpenter with Datadog What your product data is actually saying Key metrics for monitoring Karpenter Securing Datadog’s platform in the AI age: The role of observability data Four ways engineering teams use the Datadog MCP Server to power AI agents Approaching your observability migration with the right mindset Meet the new Bits AI SRE: Deeper reasoning, twice as fast Key learnings from the 2026 State of DevSecOps study Use plain English to query your multi-cloud infrastructure in Resource Catalog Simplifying troubleshooting across the user journey with Datadog Synthetic Monitoring Protect your OCI resources with Datadog Cloud Security This Month in Datadog - February 2026 Amazon EC2 security: How misconfigured and public AMIs expand your cloud attack surface Enable end-to-end visibility into your Java apps with a single command Measure and improve mobile app startup performance with Datadog RUM Evaluating our AI Guard application to improve quality and control cost Identify untested code across every level of your codebase Make use of guardrail metrics and stop babysitting your releases Monitor Versa Networks SD-WAN performance in Datadog Improve performance and reliability with APM Recommendations Remediate transitive vulnerabilities faster with Datadog Software Composition Analysis Generate audit-ready vulnerability and compliance reports with Datadog Sheets Monitor Fortinet FortiManager performance in Datadog Improve test coverage across codebases with Datadog Code Coverage Move fast, don’t break things: Consistent testing standards at scale Enrich logs with ServiceNow CMDB context before routing to any SIEM or logging tool Monitor Lustre with Datadog Make faster, better product decisions with Datadog Product Analytics Surface and remediate runtime posture issues with Workload Protection Findings Protect agentic AI applications with Datadog AI Guard How to optimize JavaScript code with CSS Trace Google Pub/Sub workloads in Cloud Run with Datadog Detect human names in logs with ML in Sensitive Data Scanner How we cut our NLQ agent debugging time from hours to minutes with LLM Observability Debug PostgreSQL query latency faster with EXPLAIN ANALYZE in Datadog Database Monitoring Datadog acquires Propolis Unify and correlate frontend and backend data with retention filters Scale compliance across global frameworks with Datadog Cloud Security Monitor Arista VeloCloud SD-WAN performance with Datadog Building reliable dashboard agents with Datadog LLM Observability Simplify log collection and aggregation for MSSPs with Datadog Observability Pipelines Mitigation for Node.js denial-of-service vulnerability affecting Datadog APM Automate flaky test fixes with the Bits AI Dev Agent and Test Optimization How we built an AI SRE agent that investigates like a team of engineers Datadog integrations 2025 recap: Observability for AI, security, and hybrid cloud Design effective executive dashboards with Datadog Implement dbt data quality checks with dbt-expectations Bring faster visibility into AWS Lambda functions with remote instrumentation Troubleshoot faster with the GitLab Source Code integration in Datadog How Cambia Health Solutions saved $30,000 monthly with Cloud Cost Management and the Datadog Resource Catalog Normalize any logs for Cloud SIEM with Datadog's OCSF processor Optimizing Datadog at scale: Cost-efficient observability at Zendesk Detect, diagnose, and resolve network issues easily with CNM Network Health Connect engineering errors to user impact in early-stage products Cilium configuration for Kubernetes operations at scale Designing feedback loops for progressive delivery Ship features faster and safer with Datadog Feature Flags Choosing the right OpenTelemetry Collector distribution Route your monitor alerts with Datadog monitor notification rules Automate Cloud SIEM investigations with Bits AI Security Analyst Cloud threat detection: How to identify risky activity across control and data planes Collecting Kafka performance metrics Monitoring Kafka with Datadog Monitoring Kafka performance metrics
Monitor MongoDB Atlas for Government with Datadog
Kai Xin Tai · 2022-02-23 · via Datadog | The Monitor blog
Kai Xin Tai

Kai Xin Tai

MongoDB Atlas is a fully managed cloud database service for modern applications. Earlier this year, the MongoDB team released MongoDB Atlas for Government, a dedicated environment for US federal agencies and state, local, and education (SLED) entities that need to meet stringent security and compliance requirements. Atlas for Government, which has achieved FedRAMP Ready and FedRAMP In-Process designations, can be deployed in AWS GovCloud, allowing organizations already operating in this environment to quickly get up and running with this robust database platform. It supports Atlas’s core features, as well as a few additions that are unique to GovCloud.

We’re pleased to announce that Datadog for Government now integrates with Atlas for Government, giving you a safe and secure way to monitor the health and performance of your database clusters alongside the rest of your infrastructure telemetry. Our Atlas for Government integration comes with the same capabilities as our standard Atlas integration, which means that you’ll have a consistent monitoring experience regardless of the version you’re running.

Monitor and correlate MongoDB Atlas for Government metrics with full-stack telemetry data

Once you enable the Atlas for Government integration, you will begin to see key database metrics like throughput, latency, and resource utilization flowing into an out-of-the-box dashboard. This data enables you to identify and address fluctuations in the same metrics that are important to monitor in the standard version of Atlas, such as unexpected spikes in throughput, slowdowns in reads and writes, and connection failures.

MongoDB Atlas for Government out-of-the-box dashboard

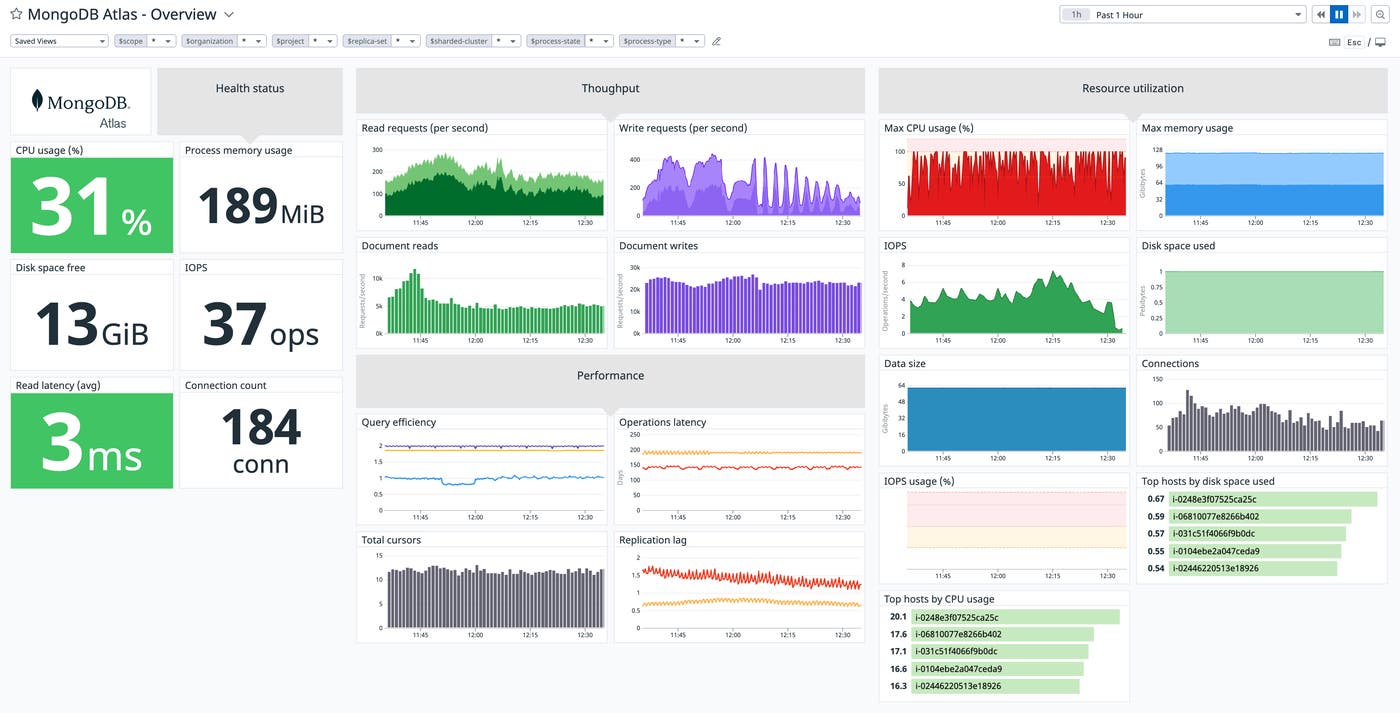
You can also clone and customize this dashboard to include metrics from the rest of your cloud-hosted and on-premises services for a fuller picture of your application’s performance. For instance, you can correlate the amount of traffic your load balancer is handling with that of individual Atlas for Government instances to see if load is getting evenly distributed. By bringing operational data from across your entire environment into a single view, Datadog allows you to easily identify bottlenecks and troubleshoot issues—without having to switch between tools.

Stay ahead of issues with automated alerts

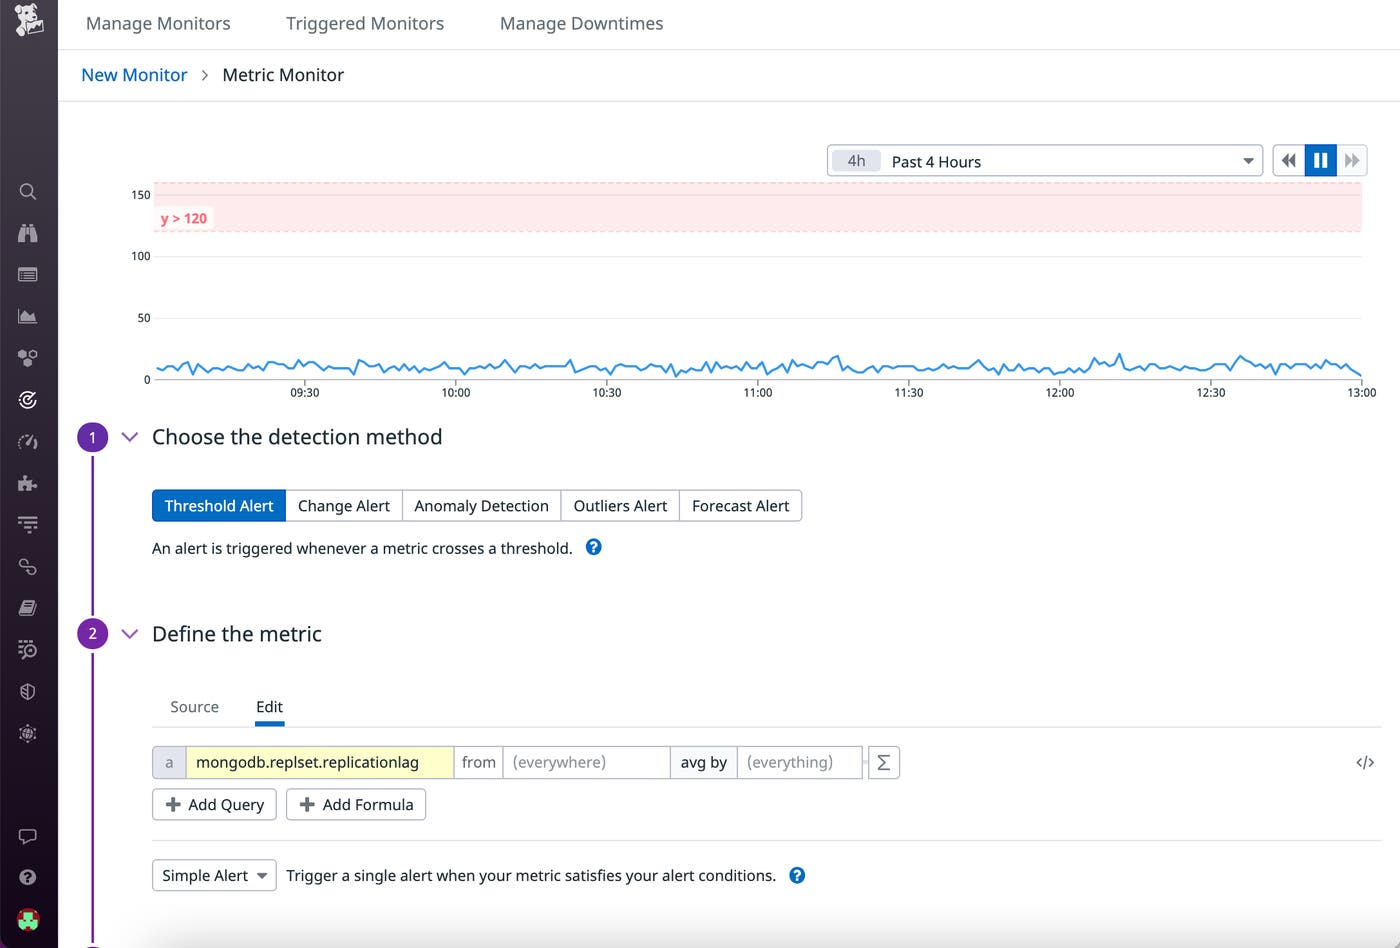
Datadog also lets you go beyond reactive monitoring with proactive notifications. For instance, you might want to configure an alert to inform you when replication lag—the delay in copying a write operation on the primary node to a secondary node—exceeds a certain threshold. If this alert triggers, you’ll want to check for increased network latency or long-running operations on the primary node. Refer to MongoDB’s documentation for other possible causes.

Set up a monitor to be automatically notified of increased replication lag

Start monitoring MongoDB Atlas for Government today

With Datadog for Government and MongoDB Atlas for Government, US federal and SLED agencies can modernize their legacy systems, innovate faster, and improve the reliability of their services—while complying with strict regulations. Check out our other MongoDB blog posts for more tips on monitoring your database clusters.

To get started with MongoDB Atlas for Government, get in touch with the MongoDB team here. You can then enable the MongoDB Atlas for Government integration right away, if you already have a Datadog for Government account. If not, sign up for a 14-day free trial of Datadog today.