










 We have a server where we’re going to run self-hosted LLMs. We spent quite a while choosing what exactly to use for running the models – vLLM, SGLang, or llama.cpp, and eventually settled on llama.cpp – at least for now.
In the post NixOS: getting started, package installation, and system configuration I described installing Node Exporter on NixOS, where our LLMs will be running. I also have a draft about NVIDIA DCGM Exporter, FluentBit and VictoriaLogs – maybe I’ll finish it someday.
And today the topic is monitoring again – but this time specifically llama.cpp monitoring.
The server is not in production yet and there is no real traffic, so the graphs don’t really tell us much – but for a start, let’s just go through the metrics and see what we can observe about how llama.cpp works.
What we’ll do:
To make llama.cpp start generating metrics, add the --metrics option when starting it. The endpoint is the standard /metrics.
But there is one important thing about how exactly to retrieve these metrics.
Contents
llama.cpp can work in two modes:
See New in llama.cpp: Model Management.
When running in single-model mode, all metrics are available normally via requests to /metrics.
But when running in router mode, a plain request to /metrics returns a 400 error:
# curl 'http://127.0.0.1:31000/metrics'
{"error":{"code":400,"message":"model name is missing from the request","type":"invalid_request_error"}}
Because in this mode llama.cpp expects a ?model=<MODEL_NAME> parameter:
# curl 'http://127.0.0.1:37259/metrics?model=gemma-4-26b-a4b-it-q8'
# HELP llamacpp:prompt_tokens_total Number of prompt tokens processed.
# TYPE llamacpp:prompt_tokens_total counter
llamacpp:prompt_tokens_total 26
# HELP llamacpp:prompt_seconds_total Prompt process time
# TYPE llamacpp:prompt_seconds_total counter
llamacpp:prompt_seconds_total 0.093
...
There is another option: when running in router mode, each model is started as a separate llama.cpp instance (process) and listens on its own port:
# ps aux | grep 'llama-server'
[...] /nix/store/3vq7fxic7zaznzsip9zwbj4nblxfqpk5-llama-cpp-cuda-0.0.0/bin/llama-server --metrics --no-ui --host 0.0.0.0 --port 31000 --models-dir /srv/llm/models/llama-cpp/local --models-preset /nix/store/4g0chnaiidzbz25izygnxf1lj2rqwx78-matrix-llama-models.ini --models-max 3
[...] /nix/store/3vq7fxic7zaznzsip9zwbj4nblxfqpk5-llama-cpp-cuda-0.0.0/bin/llama-server --host 127.0.0.1 --metrics --port 37259 --no-webui --alias gemma-4-26b-a4b-it-q8 --ctx-size 65536 --device CUDA0 --flash-attn on --fit off --model /srv/llm/models/gguf/gemma-4-26b-a4b-it-q8-gguf/gemma-4-26B-A4B-it-Q8_0.gguf --n-gpu-layers all --parallel 1 --split-mode none
Here on port 31000 we have the “master process”, which handles routing requests to the models, while the second process on port 37259 accepts requests to Gemma-4.
So we can simply get metrics from 127.0.0.1:37259/metrics:
# curl -s http://127.0.0.1:37259/metrics
# HELP llamacpp:prompt_tokens_total Number of prompt tokens processed.
# TYPE llamacpp:prompt_tokens_total counter
llamacpp:prompt_tokens_total 83
# HELP llamacpp:prompt_seconds_total Prompt process time
# TYPE llamacpp:prompt_seconds_total counter
llamacpp:prompt_seconds_total 0.36
...
Still, this approach is not very reliable, because for each model we need to know the ports, and those ports can change – so it’s better to use the “master instance”.
Of course, this comes with its own complications and the approach is not very convenient. There is a Feature Request [Feat Request] Aggregated Prometheus metrics endpoint in router mode to add an aggregated endpoint – maybe one day they’ll change this behavior.
Because, imho, this is of course a rather strange design decision: why not just put the model name into a label and return a metric like llamacpp:prompt_tokens_total{model_name="gemma-4-26B"}?
But the llama.cpp developers know better. There were clearly some reasons to implement it the way it works now, so it is what it is.
Of course, it would be better to first run llama.cpp locally for a while and take a look at its configuration in general, because the only local runtime I’ve played with is Ollama, and that was a long time ago (see AI: getting started with Ollama for running LLMs locally), but I don’t have time for that now – so let’s figure out the metrics on the fly.
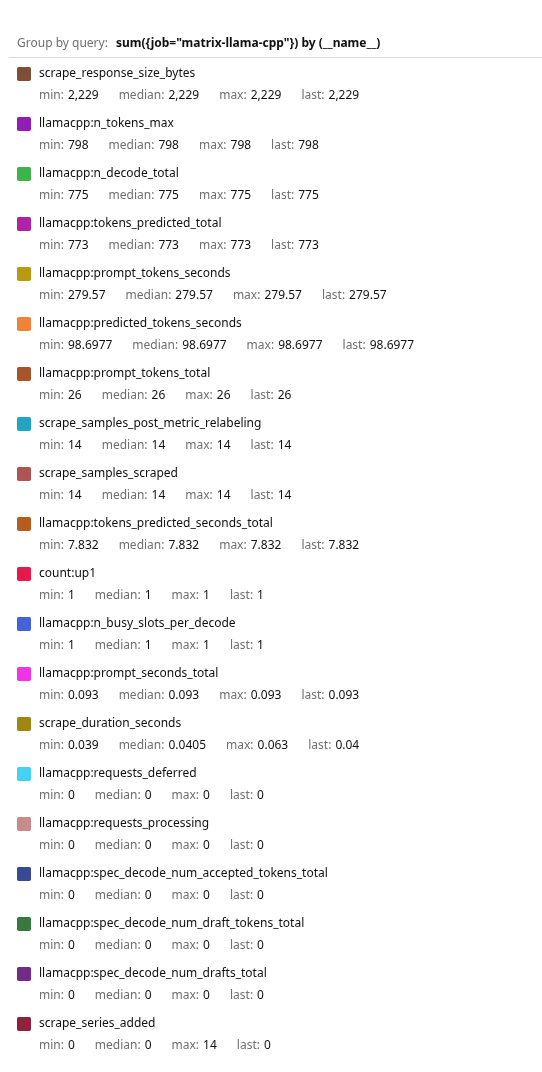
The metrics documentation is here – GET /metrics: Prometheus compatible metrics exporter. Things may change, but as of today the interesting ones are:
llamacpp:prompt_tokens_total: total number of input prompt tokens processed since the server was startedllamacpp:prompt_seconds_total: total time in seconds spent processing input prompts since the server was startedllamacpp:prompt_tokens_seconds: average prompt processing speed in tokens per second (higher value means faster processing)llamacpp:tokens_predicted_total: how many tokens were generated for responsesllamacpp:tokens_predicted_seconds_total: how much time was spent generating responsesllamacpp:predicted_tokens_seconds: similar to prompt_tokens_seconds – average response generation speed in tokens per second (the more tokens generated per second, the faster the generation)llamacpp:requests_processing: how many client requests are being processed right now
--parallel – the maximum number of requests processed in parallel), but there is no separate metric for that (yet?)GET /props and the total_slots field, or use GET /slots and count the number of elements, or simply read the --parallel value from the configllamacpp:requests_deferred: number of requests currently waiting to start processing (for example, because of insufficient resources or busy slots)llamacpp:n_tokens_max: the largest number of tokens we’ve seen in the context window
--ctx-size) – but there is no metric for that eitherllamacpp:n_decode_total: number of model compute runs (calls to the llama_decode() function) for processing input or generated tokens
llama_decode() call can process several tokens at once and requests from multiple slots – so this metric is not equal to the number of tokens or requestsllamacpp:n_busy_slots_per_decode: average number of busy slots per llama_decode() call
n_busy_slots_per_decode is ~1, requests are processed sequentially. If it is higher, requests are combined into batches that are then passed to the model through a llama_decode() callllamacpp:spec_decode_num_draft_tokens_total: number of tokens proposed by the draft model when using Speculative Decoding
--spec-type option, but we don’t use it (yet?)llamacpp:spec_decode_num_accepted_tokens_total: number of tokens proposed by the draft model and accepted by the main LLM
llamacpp:spec_decode_num_drafts_total: number of verification steps for draft model predictionsllamacpp:spec_decode_num_accepted_tokens_per_pos_total: number of accepted tokens for each position in a prediction proposed by the draft modelThe main difficulty here is that we need to pass a specific model to get its metrics.
The simplest option is to just define several targets in a scrape job and give each one its own parameter with the model name.
Check all models that are currently running:
# curl -sS http://127.0.0.1:31000/v1/models \
  | jq -r '.data[] | select(.status.value == "loaded") | .id'
gemma-4-26b-a4b-it-q8
Add a new job to VMAgent:
- job_name: matrix-llama-cpp
  metrics_path: /metrics
  params:
    model: ["gemma-4-26b-a4b-it-q8"]
    autoload: ["false"]
  static_configs:
    - targets: ["matrix.neoc.vpn.ops.example.co:31000"]
      labels:
        model: "gemma-4-26b-a4b-it-q8"
Here the values in params form the query parameters that are added to the URI, so the full request will look like /metrics?autoload=false&model=gemma-4-26b-a4b-it-q8. See How to modify scrape URLs in targets.
With autoload, we tell llama.cpp not to load the model if it is not currently running.
And in labels, we add a static label with the model name so it will be easier to build graphs and alerts later (which is exactly what I expected llama.cpp itself to do).
Deploy it and check the targets:

And check the metrics – query sum({job="matrix-llama-cpp"}) by (__name__):
The Feature Request includes an automation option where you add a service local to llama.cpp that polls the /models endpoint and returns JSON with the models (see this example in the Feature Request comments).
Then for VMAgent we could create a job with http_sd_configs like this:
scrape_configs:
  - job_name: llama-cpp
    metrics_path: /metrics

    http_sd_configs:
      - url: http://matrix.neoc.vpn.ops.example.co:31000/targets.json

    relabel_configs:
      - source_labels: [llama_model_id]
        target_label: __param_model

      - target_label: __param_autoload
        replacement: "false"

      - source_labels: [llama_model_id]
        target_label: model
But first, this only really makes sense when there are many models or they change often. And second, I hope the Feature Request will eventually be implemented and we’ll get a simpler way to retrieve metrics, so there is no point in building some automation around it now. Especially since in my particular case there will be 2-3 models at most.
There are already ready-made dashboards, for example llama.cpp Monitoring, and for a start we can just take something like that and tweak it a bit for our needs.
That’s exactly what I did, but I added the ability to select a model:
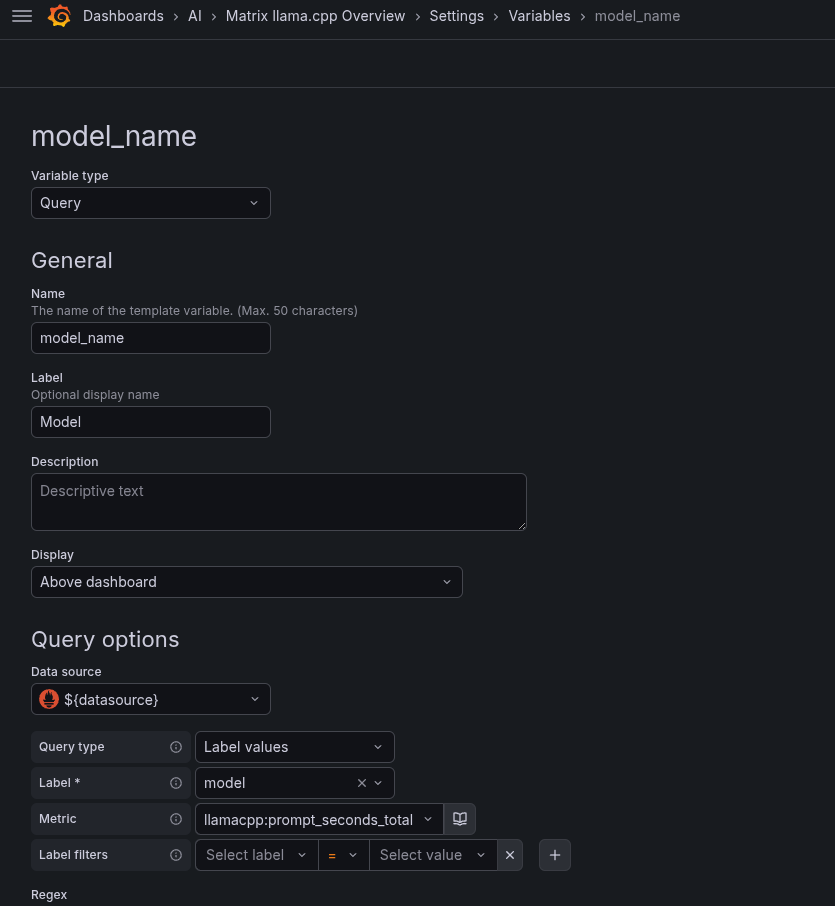
Accordingly, I had to update the queries and add sum by (model) (the label defined in our scrape_job) and a filter by the $model_name variable.
For example, the query for the “Tokens per Decode” graph:
sum by (model) (
  rate(llamacpp:tokens_predicted_total{model=~"$model_name"}[$__rate_interval])
)
/
on(model)
sum by (model) (
  rate(llamacpp:n_decode_total{model=~"$model_name"}[$__rate_interval])
)
And the whole dashboard currently looks like this – again, there is no real traffic yet, but this is the general idea for now:
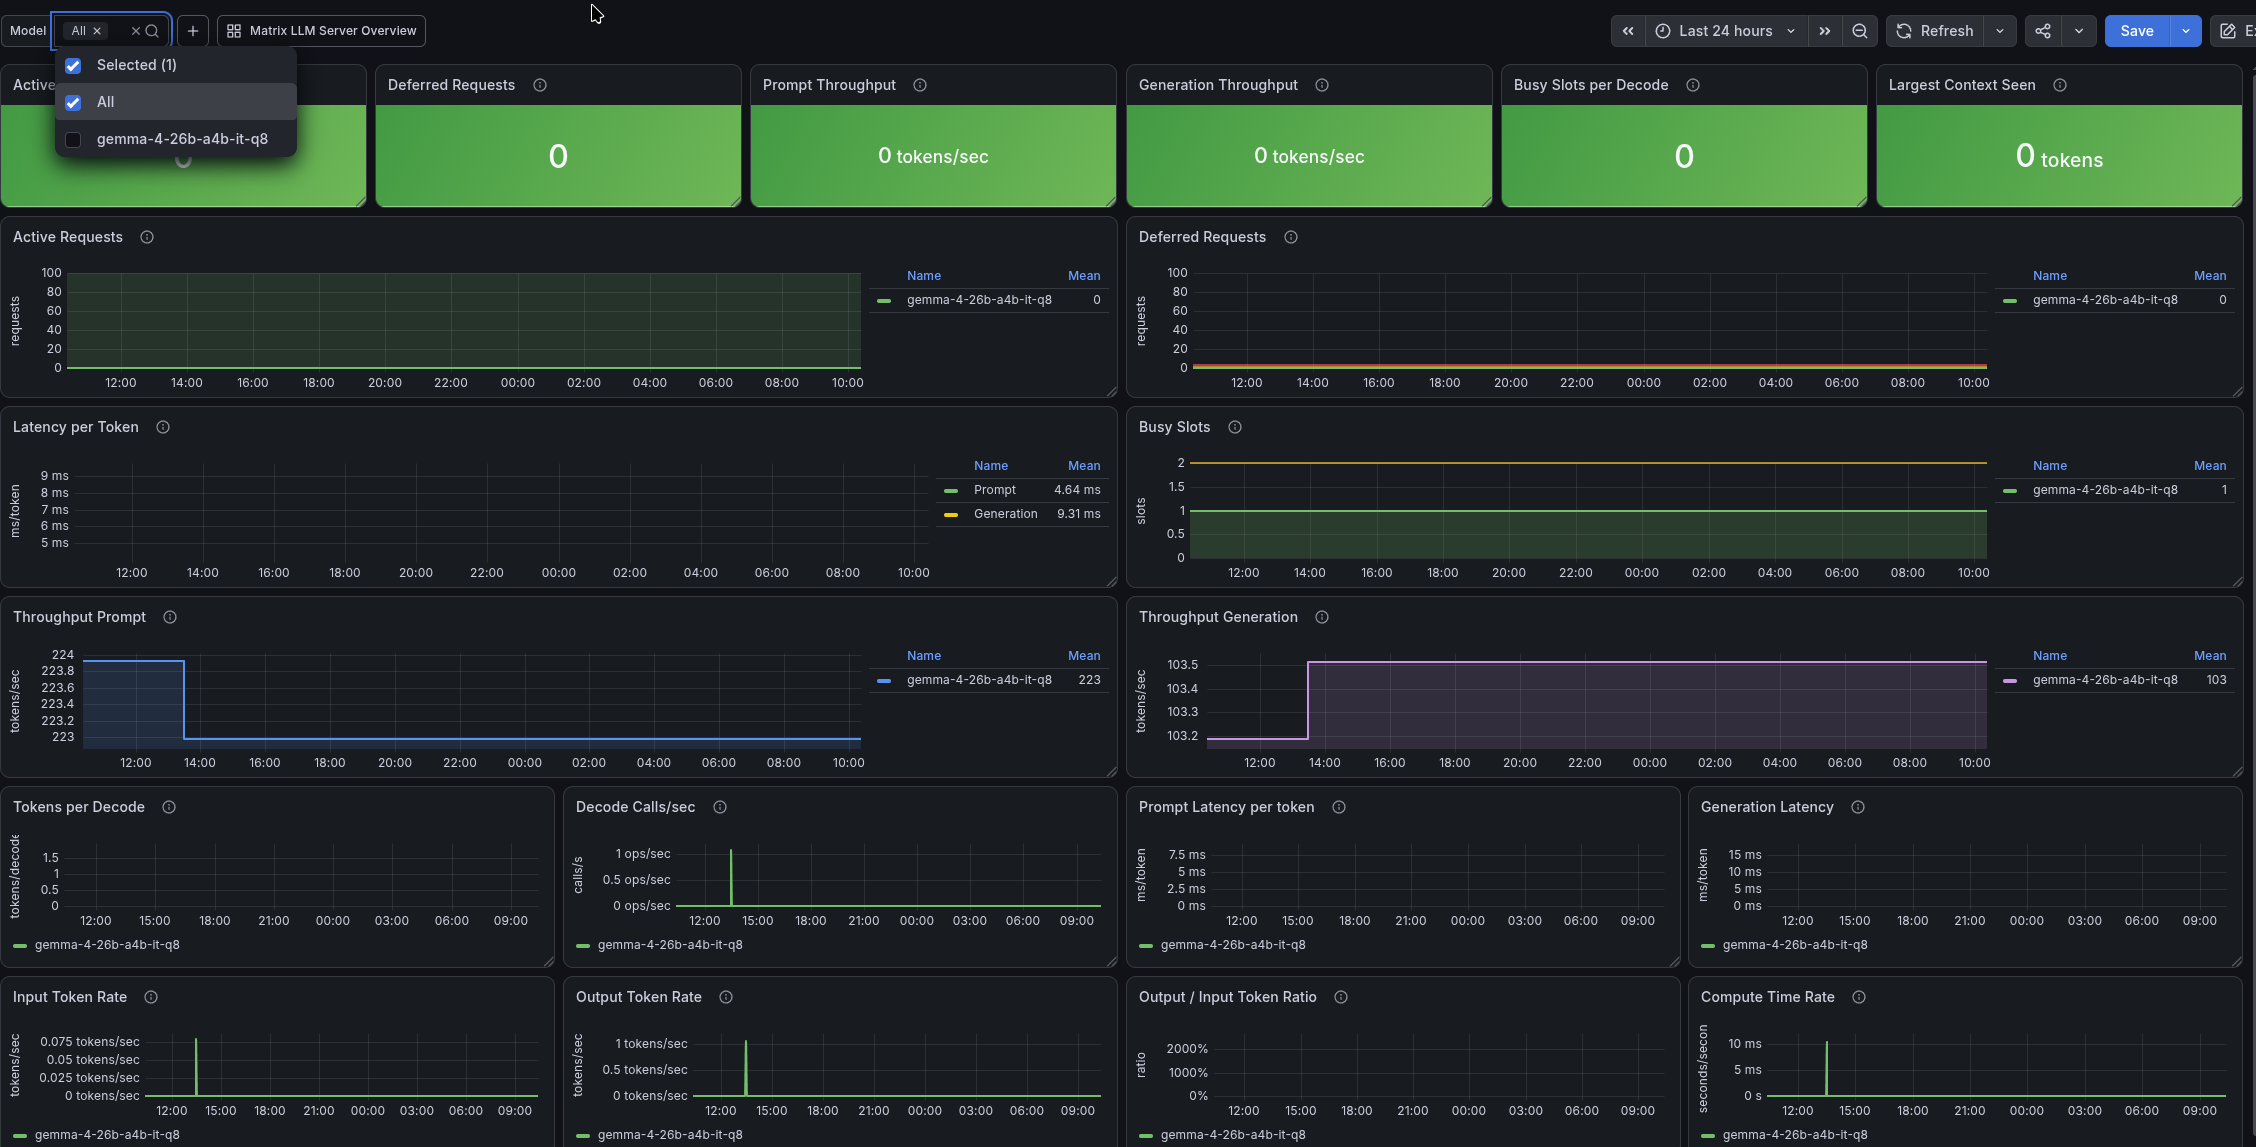
Done.
See also llama.cpp guide – Running LLMs locally, on any hardware, from scratch.

此内容由惯性聚合(RSS阅读器)自动聚合整理,仅供阅读参考。 原文来自 — 版权归原作者所有。