








Same input. Same prompt. Different output. That's the reality of testing AI agents that write code, and most teams are shipping without solving it.
Nick Nisi from WorkOS tackled this by building eval systems for two AI tools:
npx workos, a CLI agent that installs AuthKit into your project
WorkOS agent skills that power LLM responses about SSO, directory sync, and RBAC.
The post covers how to test against real project structures, score output that's different every time, and catch when your agent makes up methods that don't exist.
Every growing engineering organization eventually discovers the same problem. When something breaks in production, engineers debug it. When it breaks again, they debug it again. Hundreds of teams, thousands of incidents, each one investigated mostly from scratch.
The experienced engineer knows where to look and what patterns to check, but that knowledge lives in their head, not in the system. Over time, runbooks go stale, and scripts that one person wrote become tribal knowledge.
Meta hit this wall years ago. Their answer was DrP, a platform that lets engineers turn investigation expertise into actual code. It is a software component that runs automatically, gets tested through code review, and improves over time. It now runs across 300 teams and executes 50,000 automated analyses daily.
While Meta’s specific tool is interesting to learn about, even more insightful is the underlying principle that debugging itself can be engineered. In this article, we will look at how DrP works on a high level and the design choices Meta made while building it.
Disclaimer: This post is based on publicly shared details from the Meta Engineering Team. Please comment if you notice any inaccuracies.
The way most teams investigate incidents has a predictable failure mode, and writing better documentation doesn’t fix it.
Knowledge is trapped in people. Your best debugger carries mental models nobody else has, such as which services are flaky, which metrics actually matter, and which dashboards lie under certain conditions. When that person is asleep, on vacation, or leaves the company, the knowledge is gone. If you’ve ever been paged at 2 AM and wished someone had already figured this out last time it happened, you’ve felt this problem.
Systems change frequently, sometimes dozens of times a day. The runbook that was accurate last month now references a dashboard that was renamed and a service that was refactored. Modern software moves too fast for static documentation to keep up.
Teams often write one-off scripts to automate their own checks, and that’s a good thing to have. But those scripts can’t cross service boundaries. Neither are they tested systematically. Ultimately, they become their own form of tribal knowledge, useful to the author and opaque to everyone else.
These problems aren’t unique to Meta. Every organization at a certain scale hits the same wall. The industry has approached it in different ways. Some companies focus on coordinating people better during incidents (Netflix built and open-sourced Dispatch for exactly this), others focus on automating the investigation itself (Meta’s approach), and still others are leaning into AI-driven diagnostics.
There are at least three distinct layers to incident response:
Coordination (getting the right people together)
Investigation (figuring out what went wrong)
Remediation (fixing it).
Meta invested deepest in the investigation layer, and their approach is worth studying because it has been in production for over five years at a massive scale.
You can also think about this as a maturity progression from tribal knowledge to wiki runbooks to ad-hoc scripts to testable analyzers to a composable platform. Most teams are stuck somewhere around step two or three, whereas DrP represents step five.

AI has changed how engineers write code. But 70% of engineering time isn’t spent writing code, it’s spent running it.
Most teams are still operating manually to triage alerts, investigate incidents, debug systems, and ship with full production context.
A new wave of engineering orgs including those at Coinbase, Zscaler, and DoorDash are deploying AI agents specifically in their production systems.
This practical guide covers the four workflows where leading teams are seeing measurable impact, and what the human-agent handoff actually looks like in each one.
DrP’s core philosophy is that investigation workflows should be written as code, go through code review, have CI/CD, and be tested, just like any other software the team ships.
The core unit is the “analyzer,” a programmatic investigation workflow. Engineers use DrP’s SDK to codify their debugging steps, such as which data to pull, which anomalies to look for, and which decision trees to follow. The output is structured findings (both human-readable and machine-readable) and not just a wiki page that someone might skim.
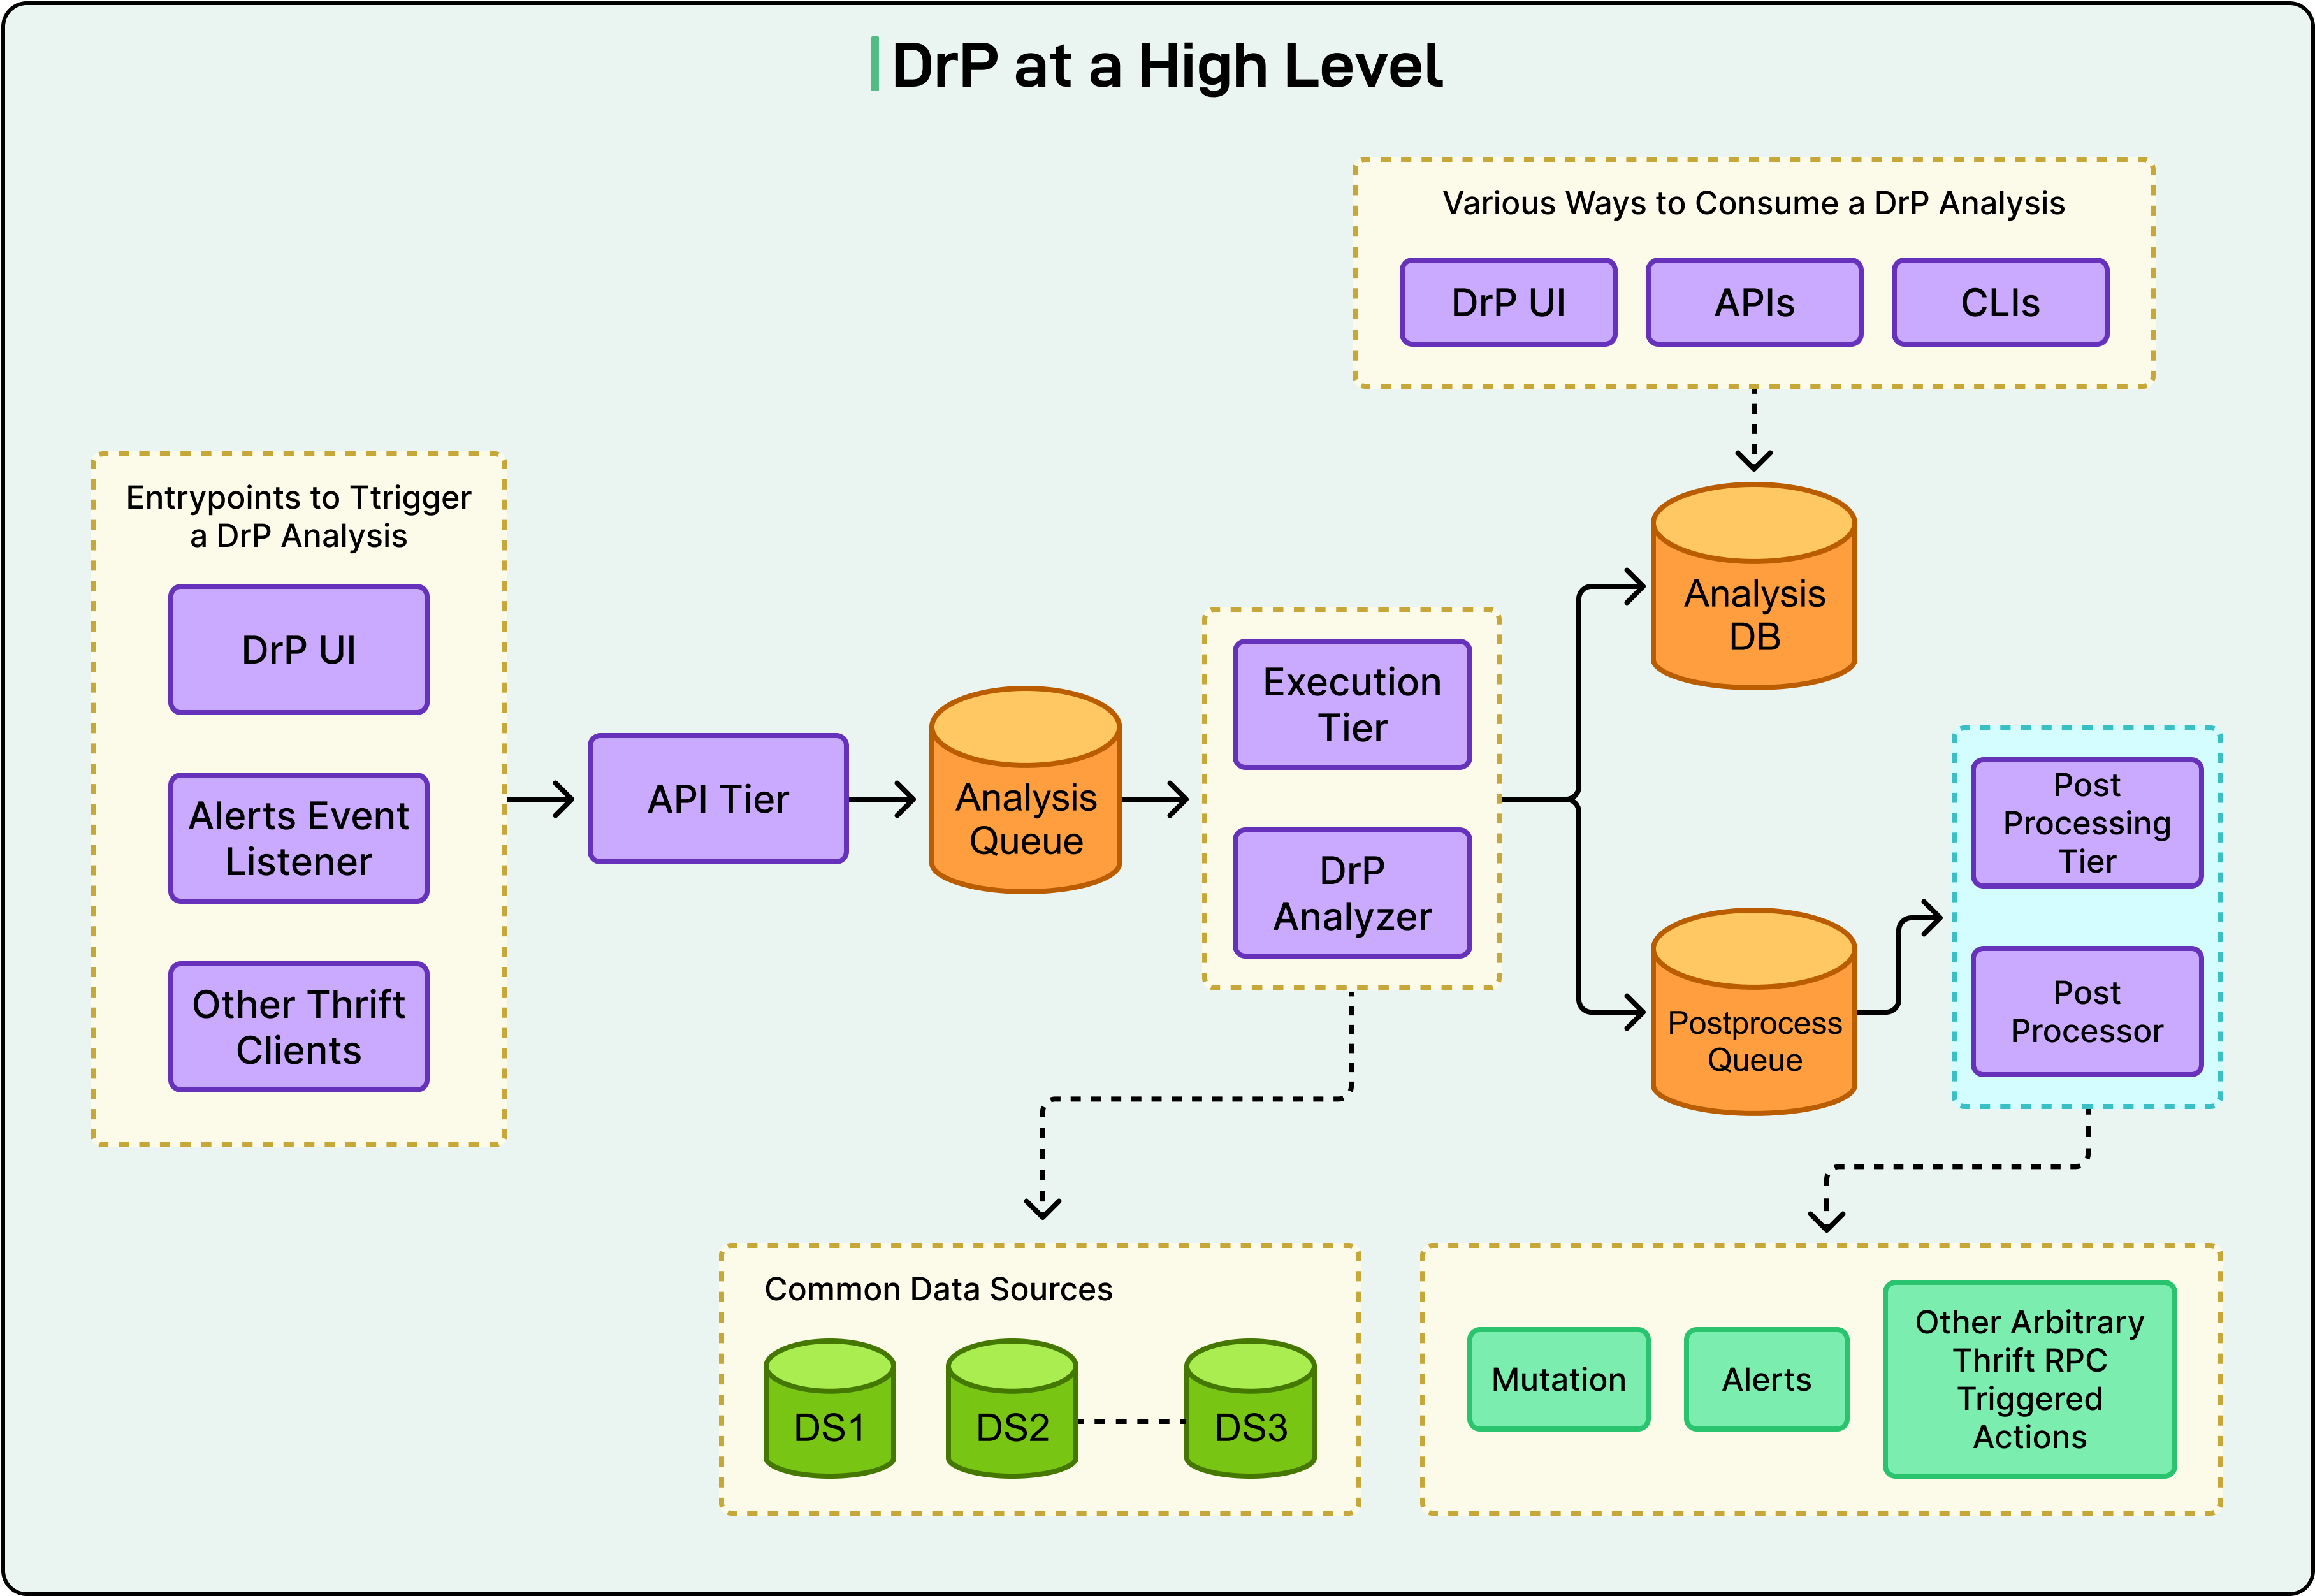
What makes this different from “just writing a script” is the engineering rigor around it.
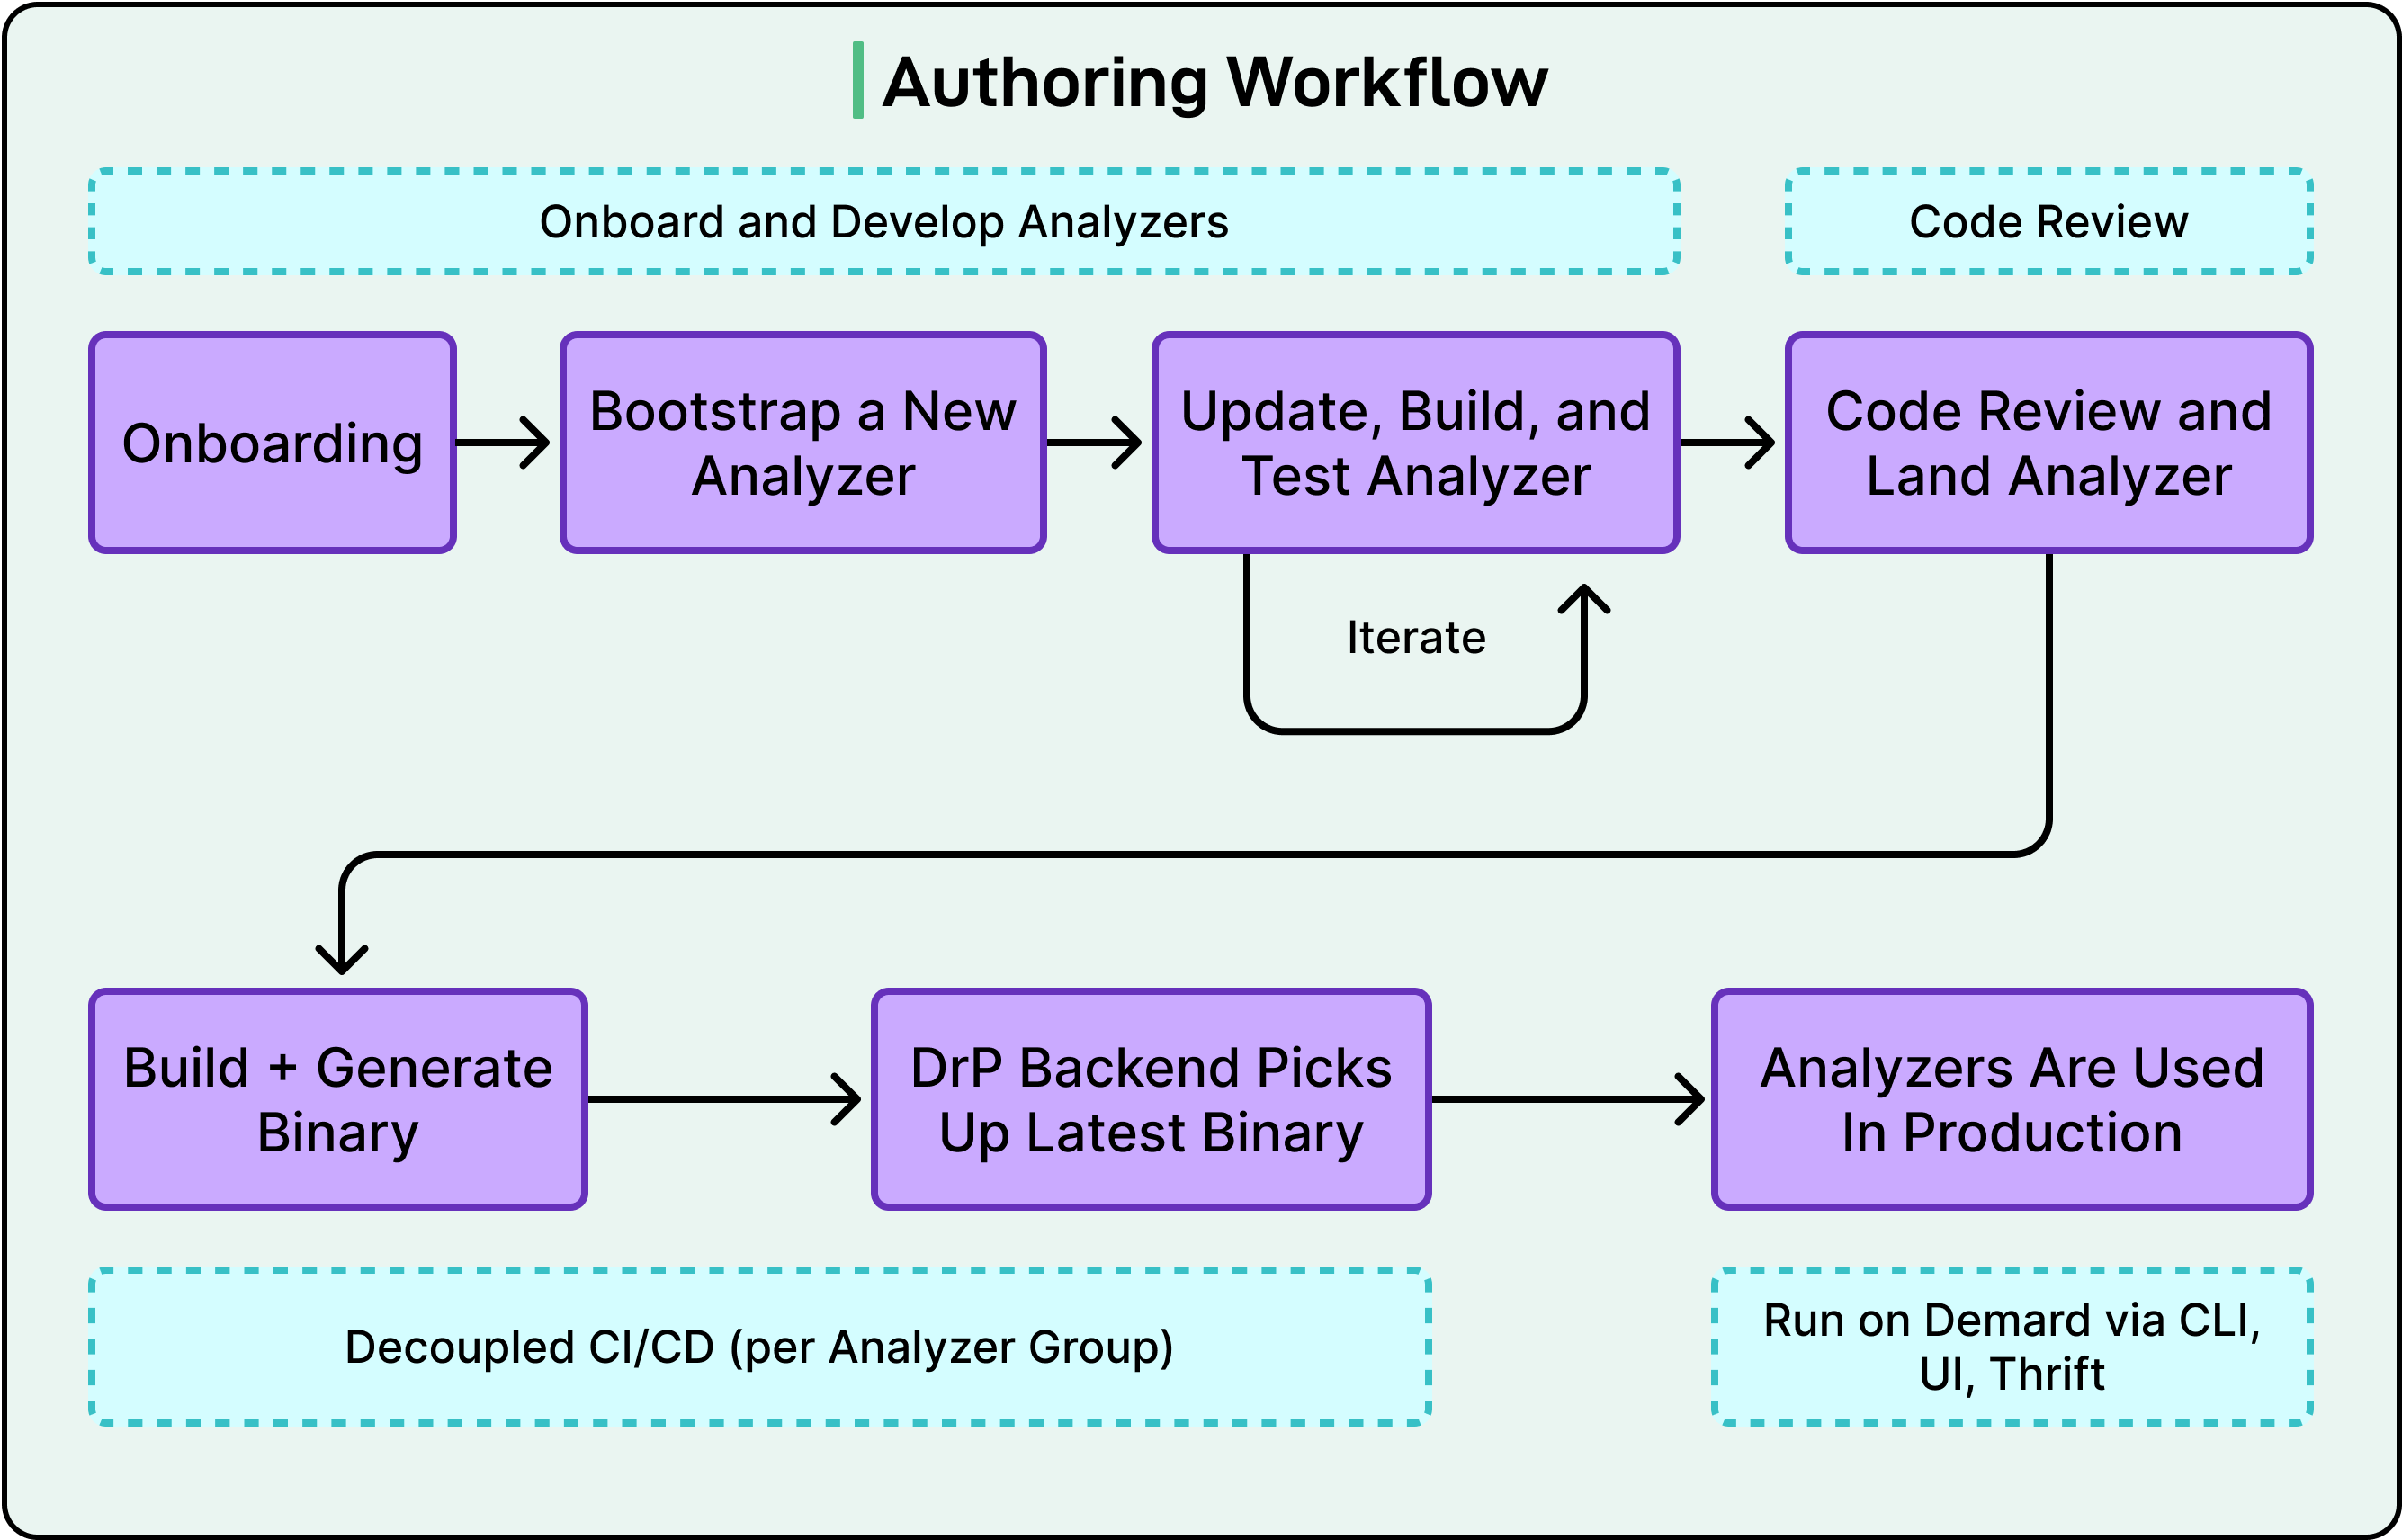
Analyzers go through code review. They have automated backtesting integrated into the review process, so you can verify an analyzer would have caught last month’s incidents before you deploy it. They ship through a CI/CD process. When the underlying system changes, the analyzer gets updated through the same development workflow as any other code.
See the diagram below that shows the authoring workflow for the same:
The SDK also provides shared libraries for common investigation patterns, such as anomaly detection (spotting unusual behavior in metrics), time series correlation (checking whether a metric spike lines up with a deploy or config change), and dimension analysis (automatically slicing metrics by region, device type, or other attributes to isolate where a problem is concentrated). Engineers don’t reinvent these from scratch for each analyzer.
The mental shift matters as much as the technology. DrP has users (on-call engineers), a platform team, deployment pipelines, and usage metrics. It is maintained and improved continuously, not abandoned after the initial author moves teams.
Writing analyzers as code is the foundation. But the real leverage comes from what happens when you connect them.
In a microservices architecture, the root cause is rarely in the service showing symptoms. Your API error rate spiked, but the actual cause may be a config change in a storage service three layers down. With standalone scripts, each team can only investigate its own domain. With DrP, analyzers chain across service boundaries. The API analyzer discovers the issue is downstream, invokes the Storage Service analyzer, passes along the context it has already gathered, and gets back a confirmed root cause. This happens automatically, without anyone pinging a Slack channel.
DrP also integrates directly into the alert lifecycle. Analyzers trigger automatically when an alert fires. Results annotate the alert itself, so the on-call engineer sees the diagnosis alongside the page, before they have opened a single dashboard.
After the investigation, a post-processing system can close the loop: create a revert task, file a bug, or trigger a mitigation step. And there’s a broader feedback loop too.
DrP Insights periodically analyzes outputs across all investigations to identify and rank the most common alert causes across the organization. Individual investigations become organizational learning.
To make this concrete, here’s what a DrP-powered investigation looks like in practice. This is a possible scenario based on DrP’s documented capabilities, not a specific Meta incident.
Let’s consider that the error rates spike on an API service. The alert fires and auto-triggers the relevant analyzer. From there, the investigation unfolds in a series of automated steps:
The analyzer pulls error rate data and runs dimension analysis, slicing by region, device type, and data center. It isolates the problem to one region.
It runs time series correlation, comparing the error spike against other signals like latency, deploy events, and config changes. It finds a strong match with a recent config change on a downstream storage service.
Since the storage service is a separate dependency, the analyzer chains into the Storage Service analyzer, passing along the regional context. That analyzer confirms the config change pushed response latency past the API’s timeout threshold.
The findings surface to the on-call engineer as a structured summary: affected region, root cause, correlated timestamp, and a link to the offending change.
The post-processing system creates a revert task assigned to the storage team.
The engineer reviews the analysis, approves the revert, and the incident is resolved. The investigation that might have taken 45 minutes of manual work across multiple tools and teams happened in the background before the engineer finished reading the alert.
DrP has reduced mean time to resolve incidents by 20-80% across Meta’s teams, with over 2,000 analyzers in production. Those numbers are compelling, but the lasting takeaway isn’t about a specific tool at a specific company.
Investigation knowledge is too valuable to live in people’s heads or in documents that go stale. It can be codified into testable, composable software.
However, this doesn’t eliminate the need for human judgment. DrP deliberately keeps engineers in the loop, presenting findings for review rather than auto-remediating. And it’s not free; analyzers are code, and code needs maintenance. You’re trading unpredictable on-call toil for more manageable engineering work. But wherever you work, the question is worth asking: is your team’s debugging knowledge engineered into your system, or is it waiting to walk out the door?
References: