








Now I am going to introduce our recent work. We call it "Investigator". Investigator uses hardware features to diagnose concurrency bugs on Arm.
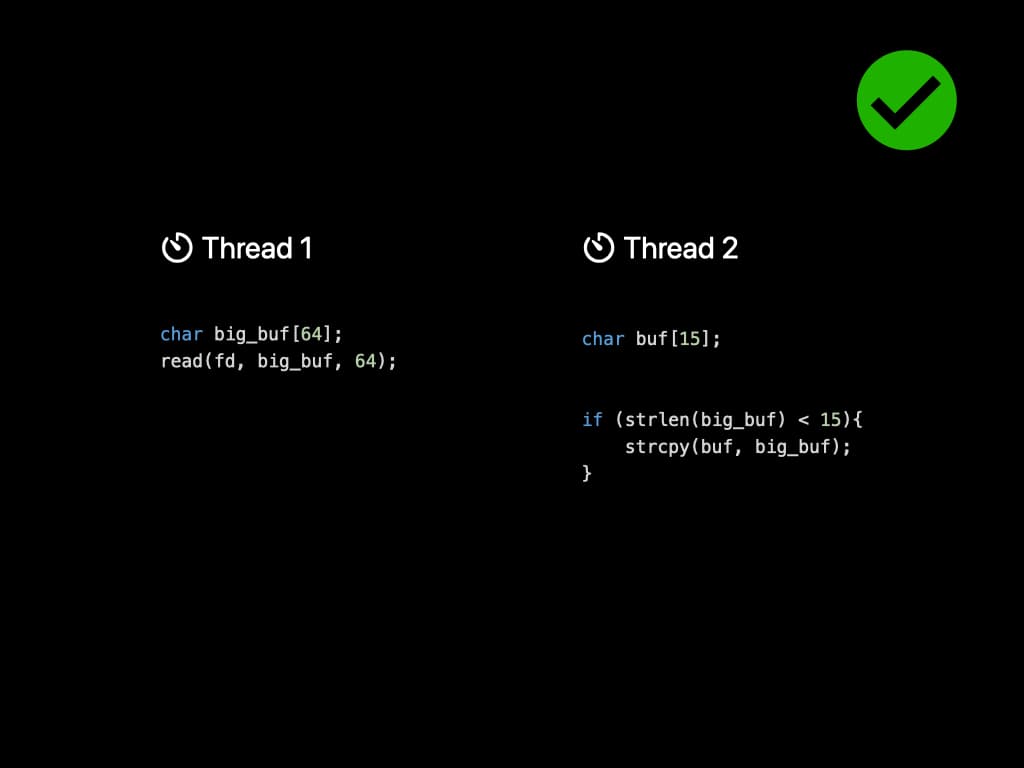
First, let's look at a straitforward example of concurrency bugs. There're two threads sharing one variable called big_buf. Thread 1 tries to read content from a file descriptor, and put it into the big_buf array. Thread 2, at the meantime, has a smaller buf and wants to perform a string copy. Since the buf has a smaller size, it must check the content inside big_buf, make sure it does not exceed the length. By far, the program seems to run normally.
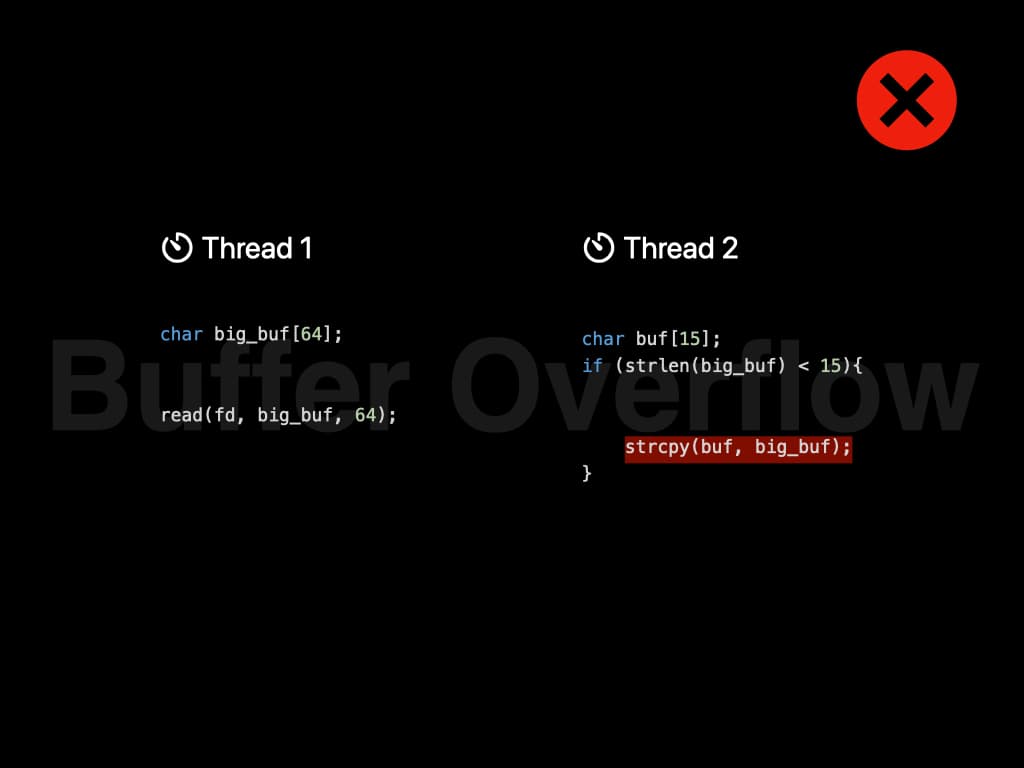
However, the scheduling of threads is controlled by Operating System. Since the two threads don't have any kind of locks, it might be executed in this order: Length checking is performed before reading. And string copy is performed after reading. Now the string copy is dangerous since it introduces a buffer overflow. The content in the file might overwrite the runtime stack, and that is a serious security risk.
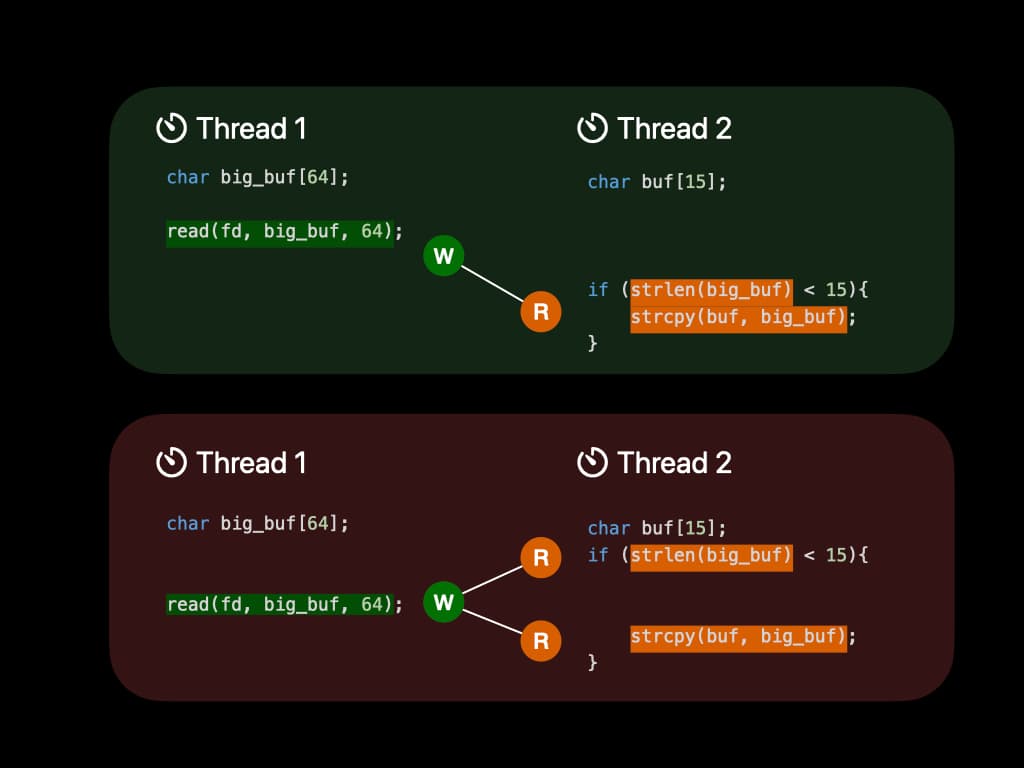
What we learned from the example is that concurrency bugs are hard to find. Those bugs are not 100% triggered when executing. Furthermore, we can induce some conclusions. In the former case, big_buf is first written by Thread 1 and then read by Thread 2. It follows the pattern "W-R". In the latter case, big_buf is read by Thread 2, then written by Thread 1, and read by Thread 2 again. It follows the pattern "R-W-R".
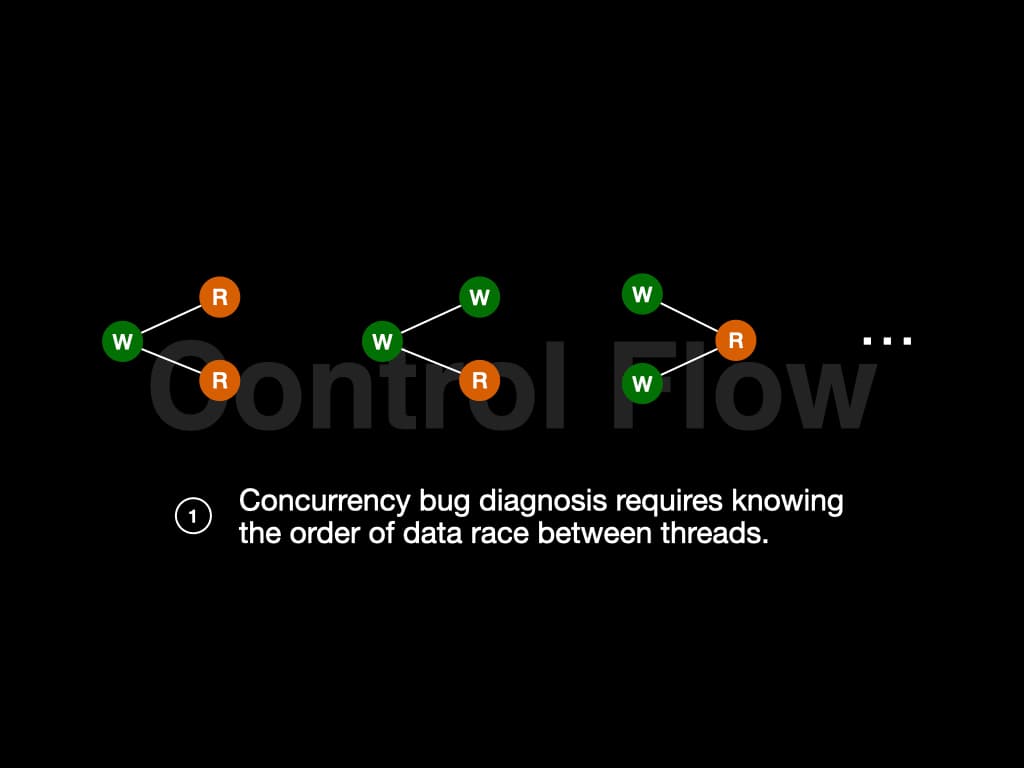
Many different patterns might leads to concurrency bugs, like "R-W-R", "W-W-R", "W-R-W", etc. To find if the patterns exist in our program, we need to know the order of data race between threads. In other words, we need to know the control flow.
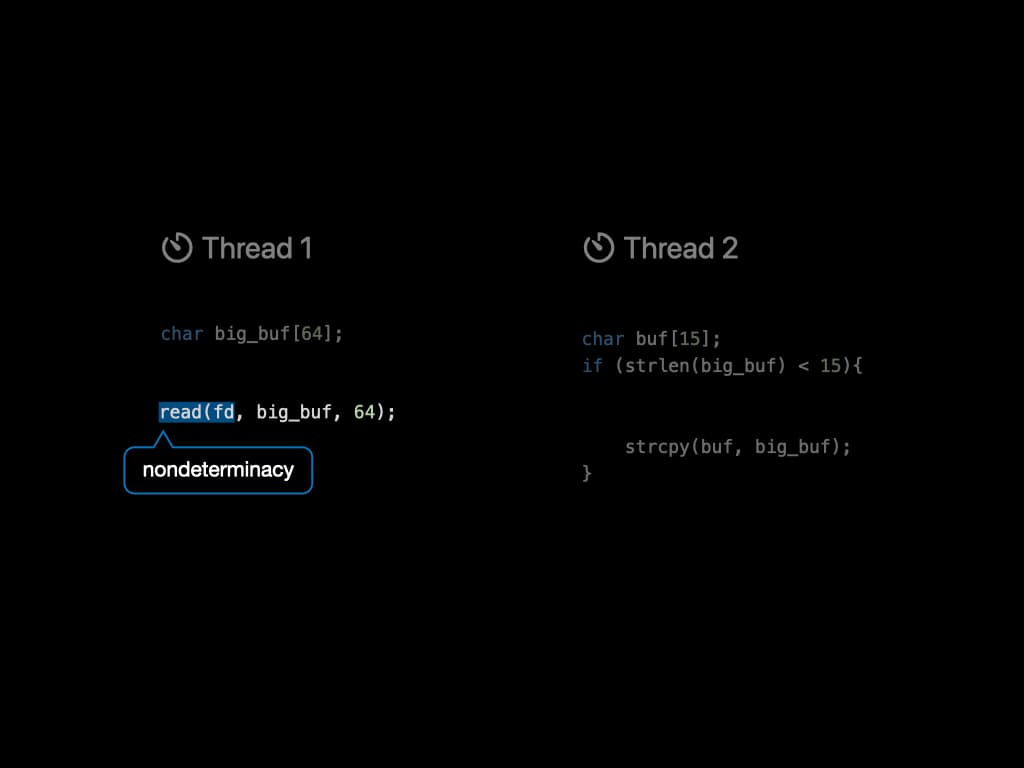
There is another key fact in the example. Thread 1 tries to read content from a file descriptor. What if the content itself has a length smaller than 15? Then there will be no bugs! The input to a program will affect its behavior. The system call read() is an example of introducing nondeterminacy to a program.
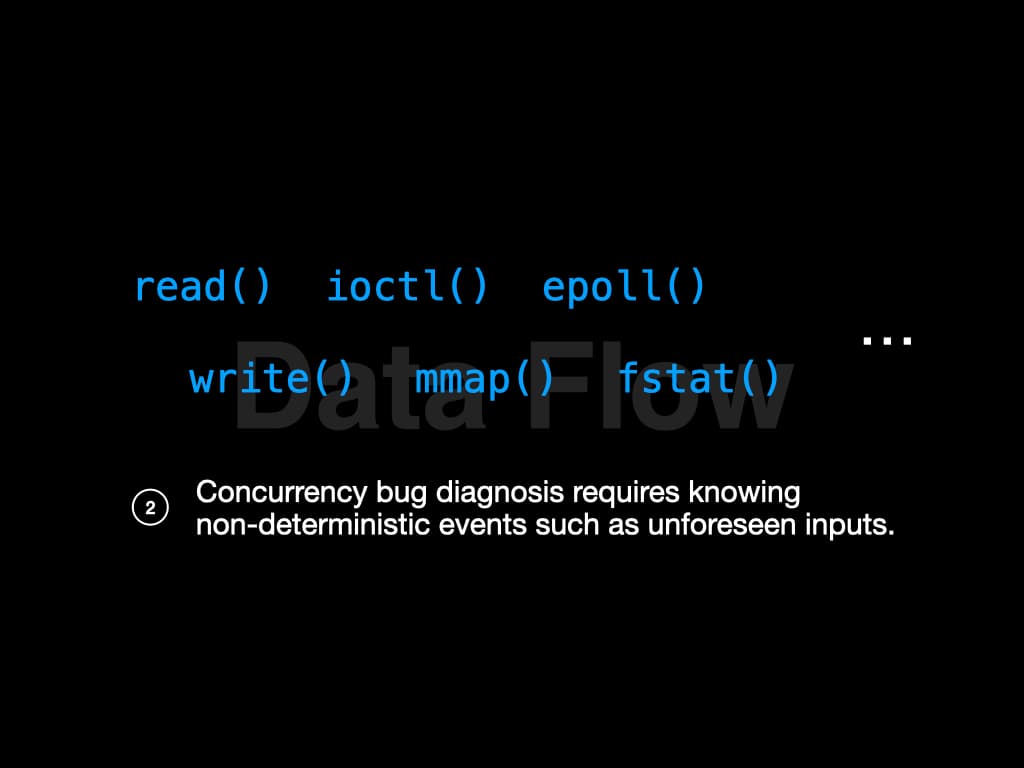
And there're more non-deterministic factors during the runtime of a program, such as write(), ioctl(), etc. We need to know the influence of these non-deterministic factors to diagnose the bugs further. In other words, we need to know the data flow.
So investigator finds a way to do failure diagnosis of these bugs with low overhead.
Every time we run a concurrency program, the control flow is slightly different. Since the execution of threads must be recorded online, and the customers are unwilling to employ online recording with a large overhead, the system must not consume too much time.
Recall that concurrency bug diagnosis requires knowing the control flow and the data flow—there are many challenges to get this information with low overhead.
Control Flow
First, let's talk about the control flow. To trace fine-grained interleaving of data race, one may need to inject code into the kernel, like write logs when context switch. This will incur around 200% of performance overhead.
Investigator uses a hardware-assisted recording solution. With the help of hardware, we claim that almost zero overhead is introduced to the system.
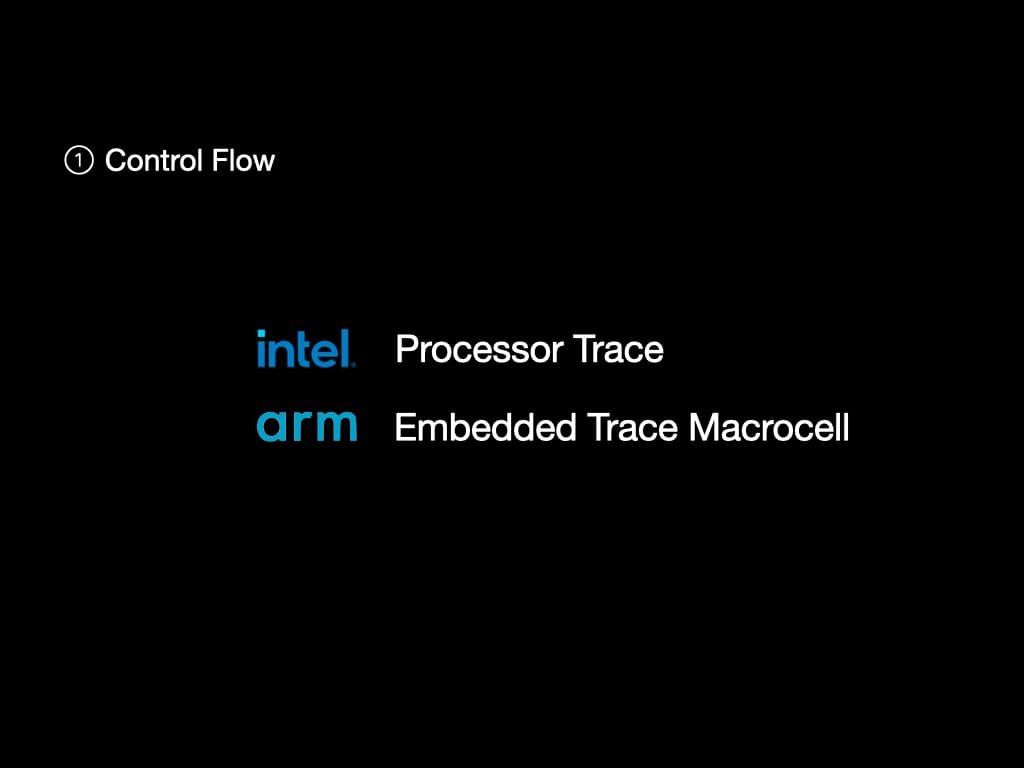
The amazing hardware which helps us to trace execution is called arm Embedded Trace Macrocell (ETM). If you are familiar with Intel Processor Trace (Intel PT), you may find that these two hardware provides the same functionality.
ETM can record the memory address of executing instruction, encode it to a small stream, and then put it into a buffer called ETR.
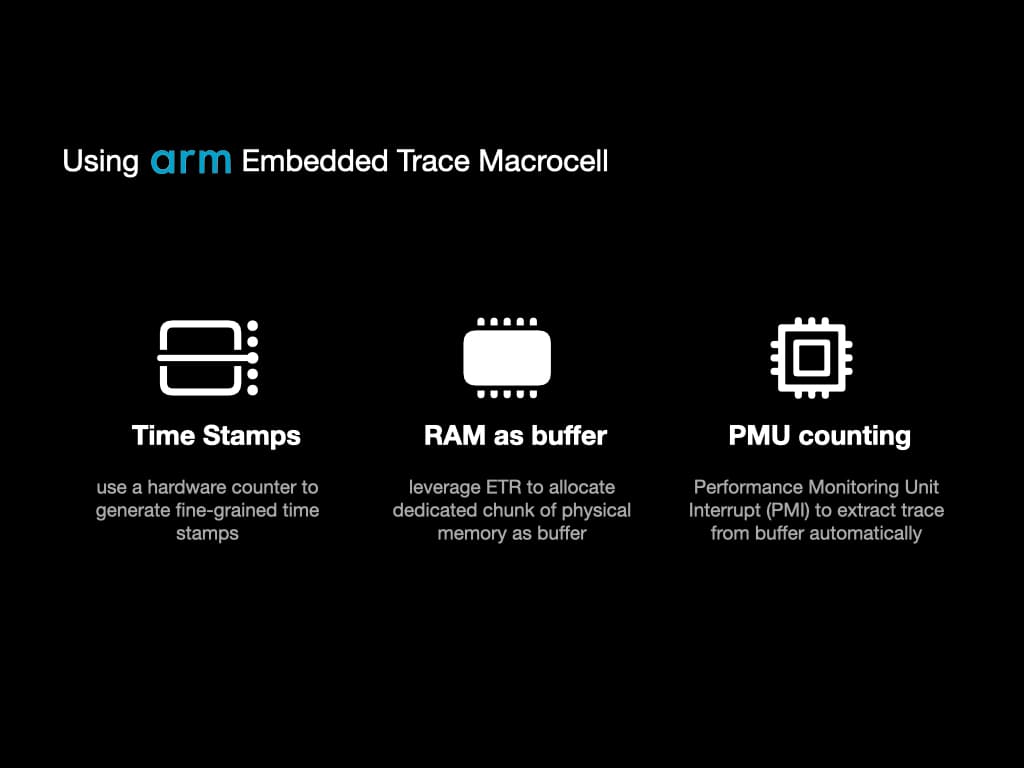
We did some extra work to fully leverage the functionality of ETM to help us diagnose concurrency programs.
First, we use a hardware component called "Counter" to generate fine-grained time stamps of ETM output. With the timestamps, we can know the execution order even across different processors.
Second, we leverage ETR to allocate a dedicated chunk of physical memory as a buffer of ETM. That means the ETM output stream is directly sent to RAM. We can avoid frequently pausing the program to get ETM output, which will alleviate the performance.
Third, we use another hardware component called "Performance Monitoring Unit (PMU)" to automatically extract traces from the buffer. We use PMU to count the number of executed instructions. When the instruction number exceeds the threshold we set, a hardware interrupt will be sent to the kernel, and our predefined handler can extract the trace.
Data Flow
The next challenge is to build the data flow. Since ETM can trace every instruction executed in the CPU, it should be fine to rerun the control flow to get the data flow. However, using ETM to trace kernel and shared library is a kind of waste.
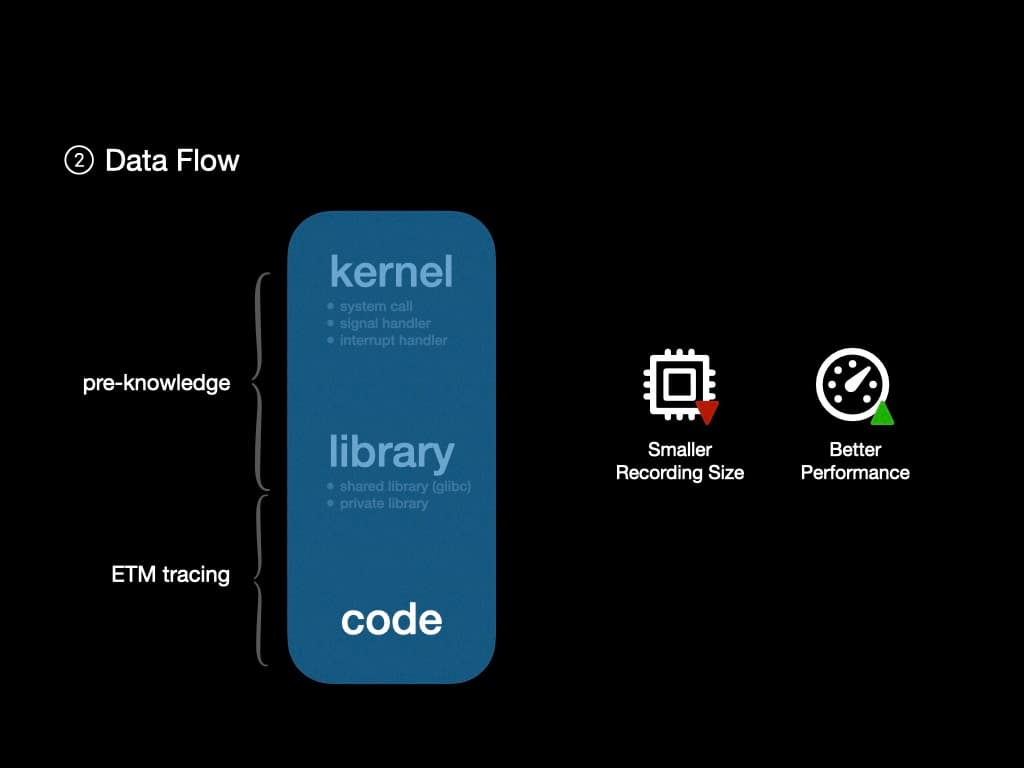
Since we have pre-knowledge about the kernel and some shared libraries like glibc, we can ignore the control flow and data flow inside them but focus on the user space program.
Thus we can further reduce the size of ETM output. The smaller ETM output is, the less frequently we need to extract them from RAM, which leads to better performance.
Instead of tracing the full execution, we implement a lightweight event capturer to record system calls, exceptions, signals and interrupts.
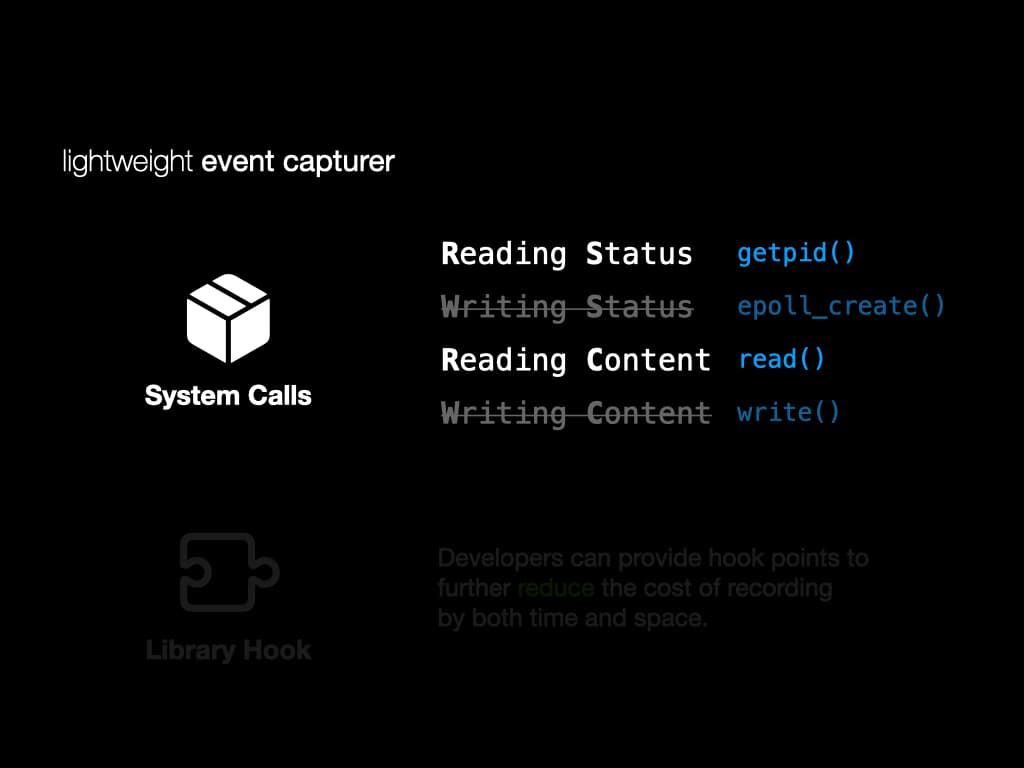
For system calls, we classify them into four groups. "Reading Status", "Writing Status", "Reading Content", and "Writing Content". For RS and RC, those system calls affect the data flow, so we will record them in detail. For WS and WC, those system calls won't affect the data flow, so we only record their return values.
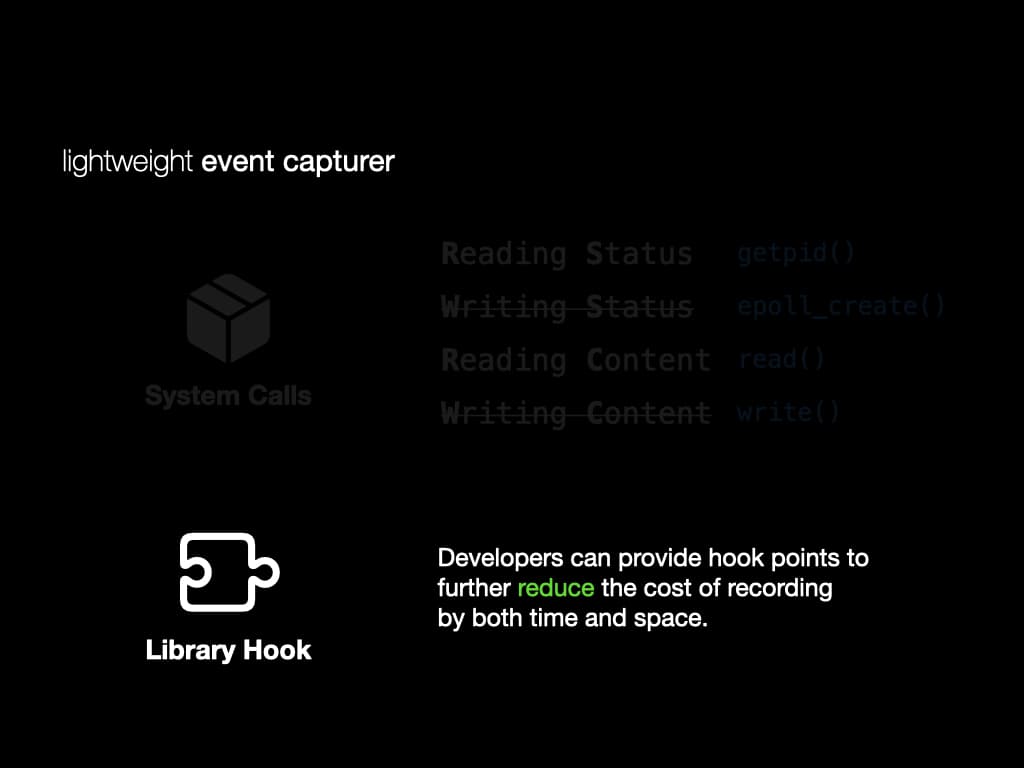
We also implement a library hook of glibc to reduce the cost of recording this dynamic library. The invoked library functions are recorded to rebuild the data flow.
Developers can also provide their own hook to reduce the cost of recording further. (We also show how to do it in the long-term experiment)
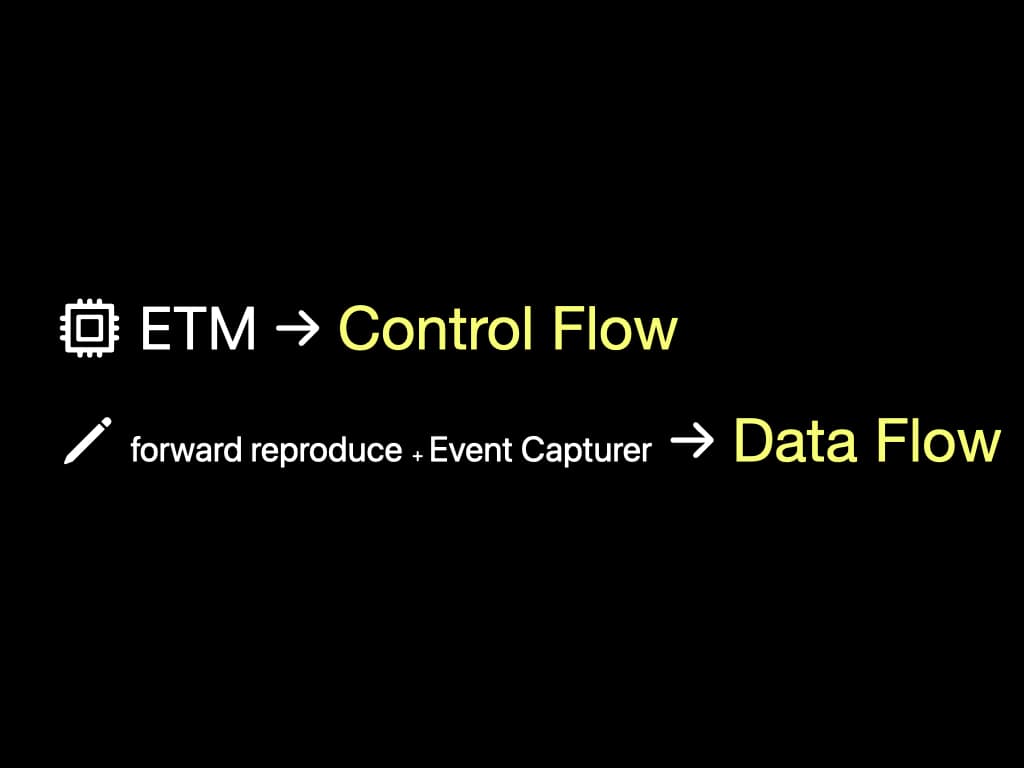
In summary, we use ETM to generate the control flow. We use forward reproduction and a lightweight event capturer to build the data flow.
Control Flow of Multi-processor Program
We just talked about using the timestamps in ETM to generate the control flow. There might be some problem when the program is executing among multiple processors.
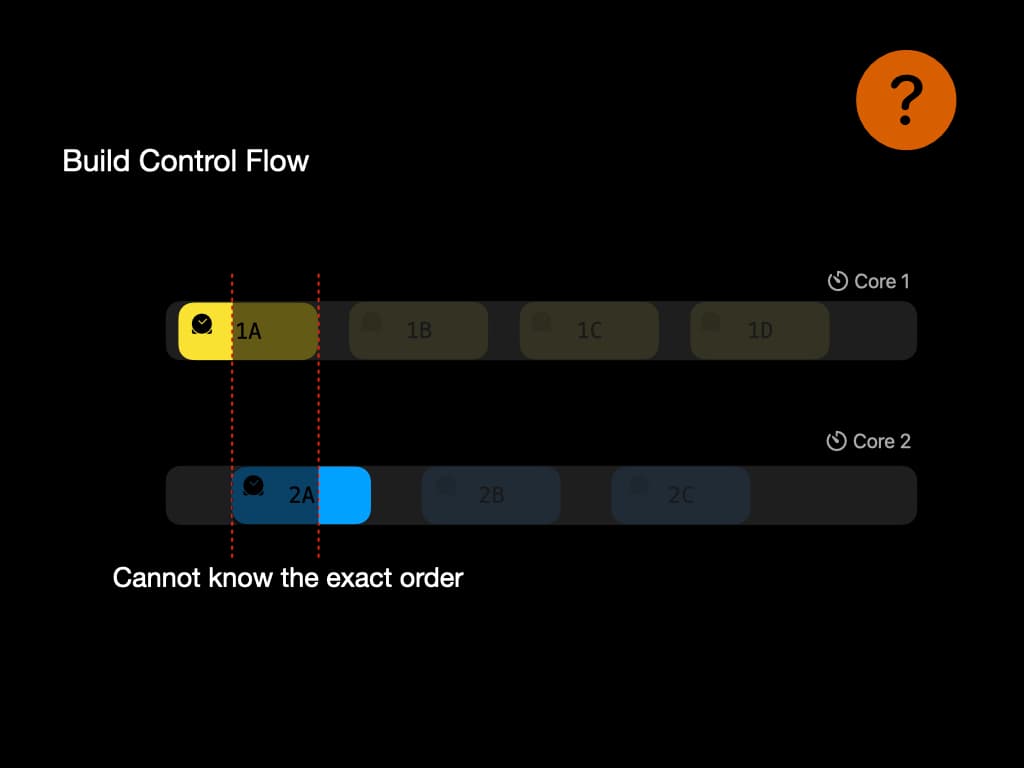
For example, the time stamp might not be precise enougth to give the exact order of execution. In this example, there is an overlap between 1A and 2A. Thus we might lose the information about data race. This problem is still a puzzle among researchers.
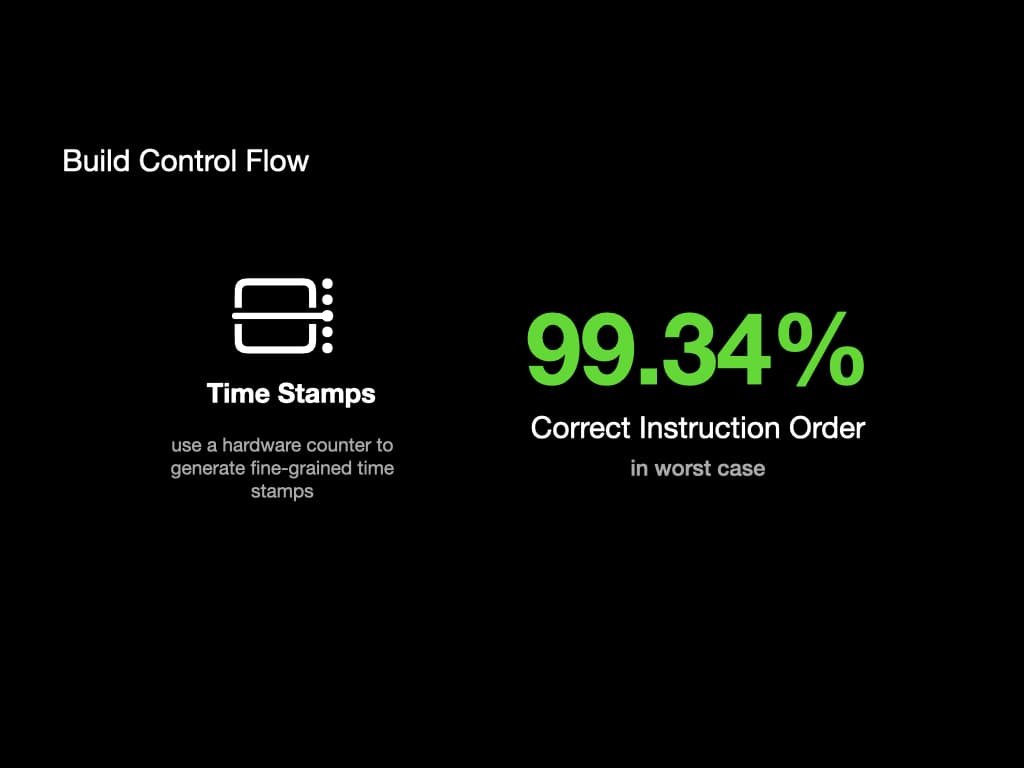
Our solution is to use the "counter" hardware to generate as many timestamps as possible to make it precise enough. In our test, 99.34% of instructions can be recorded in the correct order, in the worst case where data race happens.
After a program failure, we then have the control flow and data flow. To find the root cause of the failure, we use these methods: hybrid analysis, pattern matching, and adaptive collection.
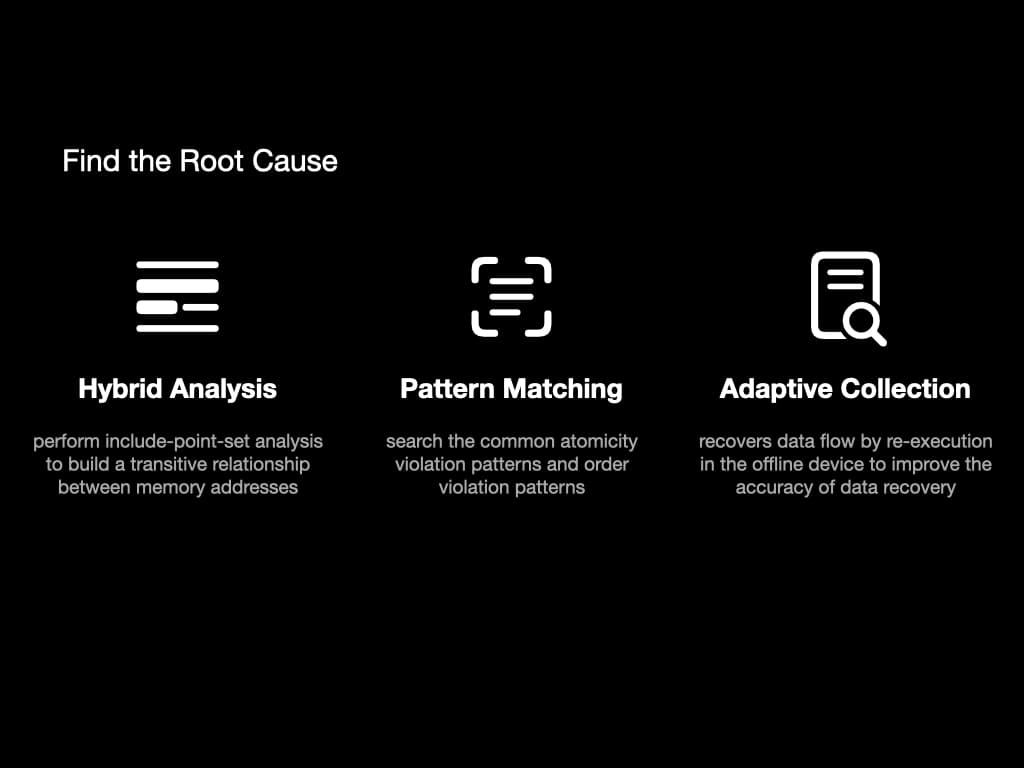
In hybrid analysis, we perform an analysis called "include-point-set". It will build a transitive relationship between memory addresses. Basically, it contains information like "variable x is influenced by variable y".
In pattern matching, we search the common atomicity violation patterns and order violation patterns to find the key instructions that lead to the failure.
The adaptive collection is a way to help recover data flow. We re-execute some instructions to improve the accuracy of data recovery.
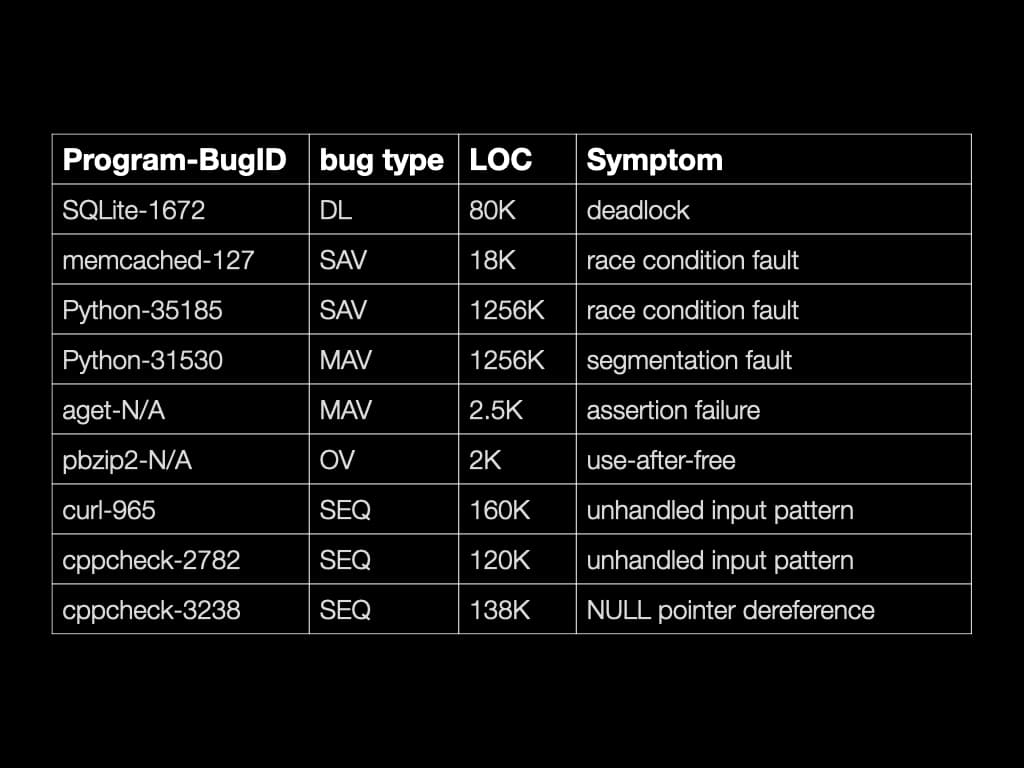
Investigator is able to find the root cause of many famous concurrency bugs. It is also able to find the root cause of some non-concurrency bugs.
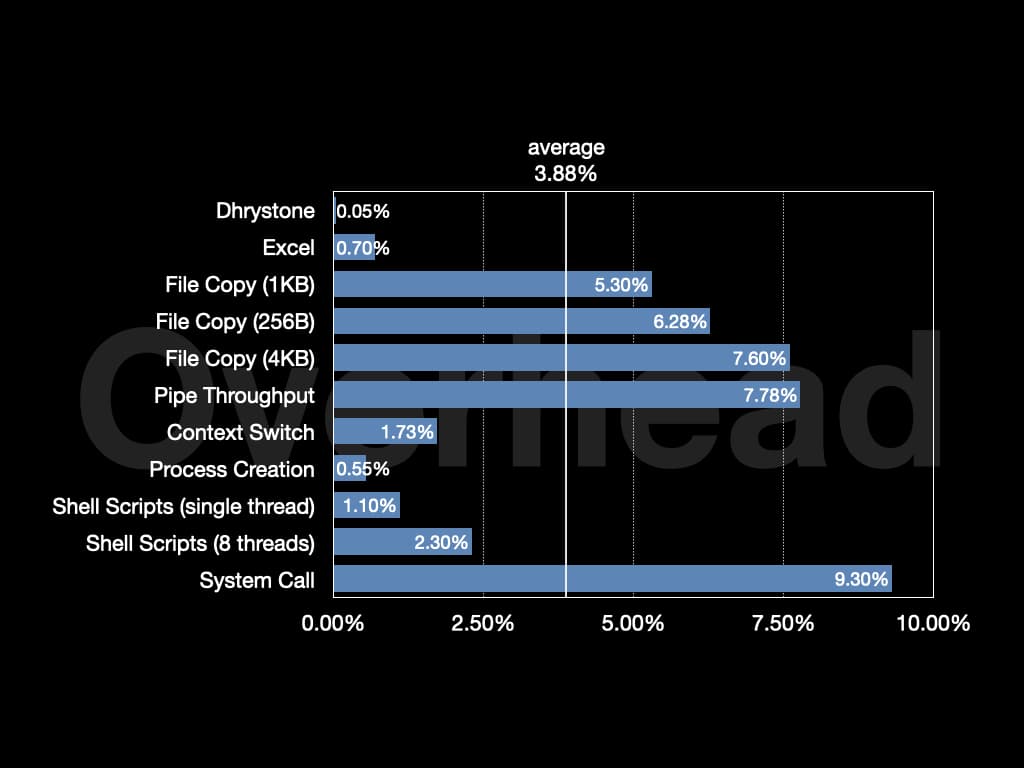
The overall overhead is around 4% on Unixbench. On Nginx, the overhead is around 1.3%.
© LICENSED UNDER CC BY-NC-SA 4.0