


PMU interrupts act as an essential role between hardware and software. It gives the software the ability to gain insight into its execution on the hardware. In this article, I introduce you to the power of PMU and PMI and how to use them to achieve your goal.
Before diving into handling PMU interrupts, I need to introduce you to the mind model. PMU is not only a hardware component. It is also the bridge between the physical implementation and the algorithmic model. If you are not interested in what PMU and PMI are (in my unique perspective), you can directly jump to "Handle PMU Interrupts in the kernel".
If you work with hardware-assisted projects, you definitely will come to PMU one day. PMU is short for the Performance Monitor Unit. Just as the name says, it provides performance-related functionality. It is widely available on different architectures, from the powerful Intel Xeon Processors installed on servers to Arm Cortex-M used in embedded IoT devices.
In short, PMU is a group of counters that can count any of the events available in the core. For example, if you want to know how many cycles your program use, you go to PMU. If you want to know how many instructions in a program are executed, you go to PMU. I know what you think, "okay, a counter counting things that I don't care." What about this: PMU lets you know how many branches were incorrectly predicted and pre-executed, which is used to improve your program's performance further.
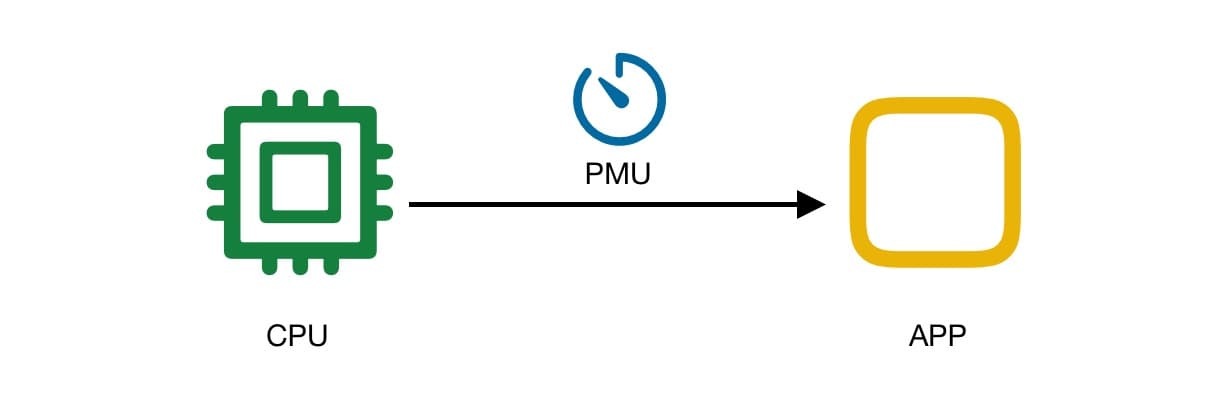
Yes, the hardware world is wild and crazy. Even if your algorithm is perfect, it will still face many problems because of the implementation. For example, issues that affect the runtime spend like memory fragmentation, memory leaks, too many context switches, constantly wrong branch predictions, etc. The bad thing is -- you don't even know these things are happening! As a software designer, it's hard to envision everything that happens on hardware when you code. That's why we need PMU, a component dedicated to counting all kinds of hardware events.
When I say events, I mean it literally. These events happen in the real, physical world. They're not like the GUI programming events that a button is mouse-hovered or clicked. I mean events such as these:
- The CPU finishes processing instruction and starts processing the next one.
- The crystal finishes an oscillation.
- The cache hits.
As you may conclude: PMU is a counter. To promptly know what is going on in the hardware, the program needs to check the counter repeatedly and observe the changes, which will take lots of CPU clocks as it will finally become an overhead burden.
PMU Interrupt is an excellent way to notify the software instead of wasting time observation. Do notice PMU itself is not going to report every increment of its counter registers. The interrupt is generated only when the PMU counter overflows. The purpose of the PMU interrupt is to inform the software that the counter will be reset to zero due to an overflow, that it should not trust the result of the end value minus the start value.
If we want to be notified as soon as possible about events that happen in hardware, we want to get interrupted every time the counter grows. Is this possible? The answer is yes. PMU counters, being 32-bit unsigned registers in hardware, are designed to be both readable and writable. So we can control the timing of hardware interrupts. For example, we let the software reset the value of the register to max_integer (i.e., 0xffffffffffff) every time an interrupt occurs. In this case, we can get interrupted every time the event happens. We can also dynamically change the number set in the register to seek a balance between performance and accuracy.
Handling an interrupt may sound unfamiliar to you. After all, it should be done by a device driver. Of course, Linux is shipped with a PMU driver, which handles the interrupts correctly. But Linux gives us no chance to customize the build-in interrupt handling process. That's why we need to reimplement it.
Before we start, you can check out the Linux interrupt handler by typing
You can see the PMU interrupt handler named "arm-pmu" among them. And do notice that there are two critical numbers in the table. One is the Logical Interrupt ID, which is in the first column of the table. Another is the Hardware Interrupt ID, which is followed by Level. We will use them both in the following steps.
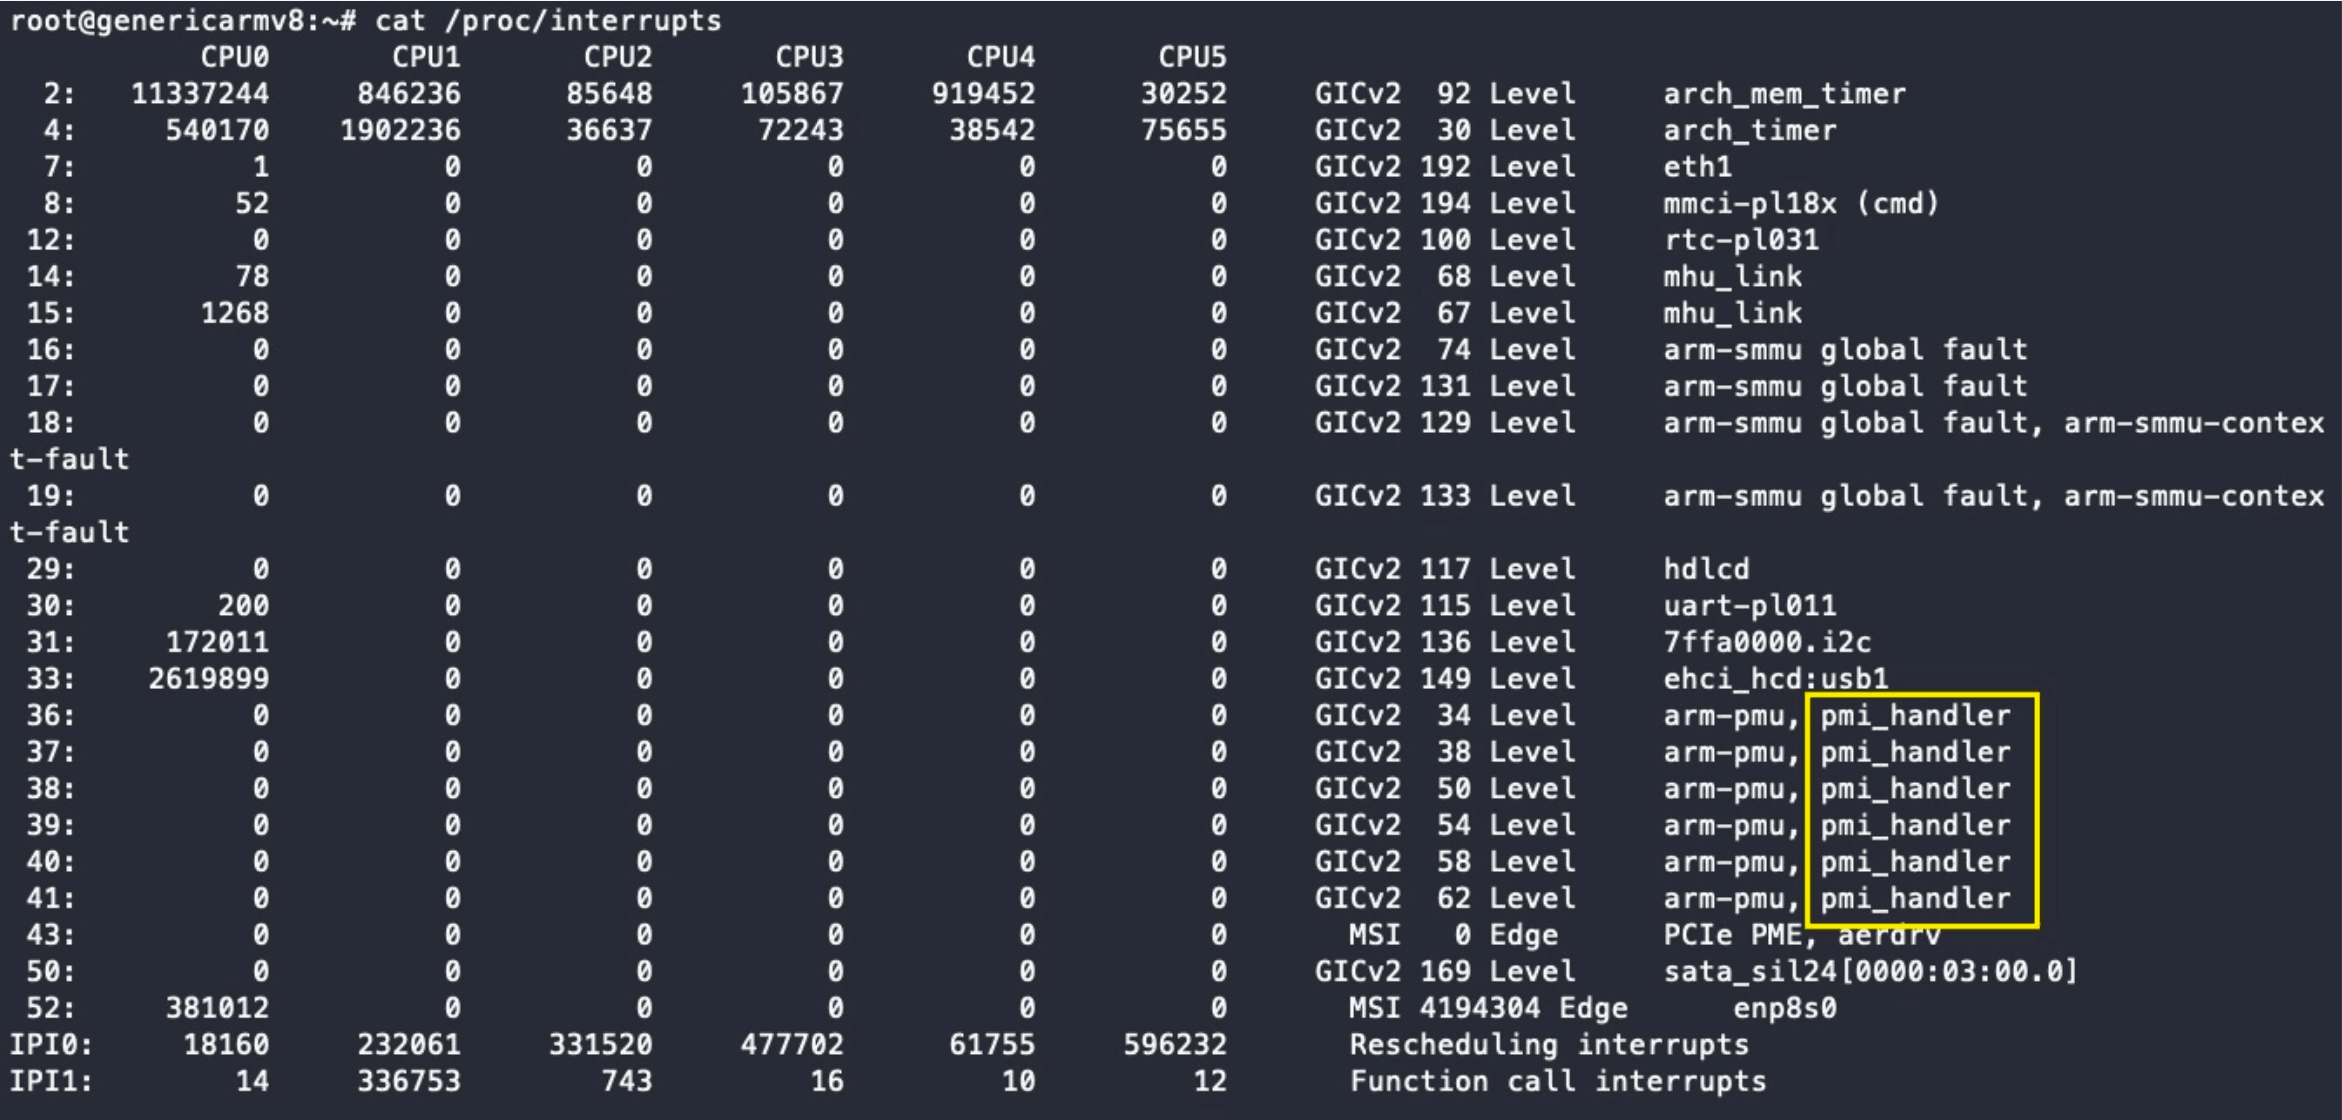
For example, on my device, the logical interrupt ID of PMU in the first CPU is 36, while the hardware interrupt ID is 36. Logical interrupt ID 36~41 on my machine is left for PMU.

Now we can handle the interrupts with these IDs. Programs cannot touch hardware in user mode, so a kernel module is necessary. In that module, you can use the Linux API request_irq(). The API takes a logical interrupt ID as its first parameter. Here's an example.
int irq_id = 36; // handle PMU Interrupt on CPU 0
unsigned long irq_flags = IRQF_PERCPU
                 | IRQF_NOBALANCING
                 | IRQF_NO_THREAD
                 | IRQF_SHARED;
request_irq(irq_id, pmu_irq_handler,
            // pmu_irq_handler is a function pointer
            irq_flags, "pmi_handler",
            (void*)pmu_irq_handler);
However, you cannot register the handler of PMU interrupts simply by running this code. Usually, an interrupt can only have one handler. Since Linux already has one, we need to unregister it first.
I want the built-in handler can work with my handler together. So I go to the Linux source code and modify the Linux version's handler called arm-pmu. I added the flag IRQF_SHARED to it, making the interrupt shareable, which means other handlers can hook it simultaneously.
The easiest way to use PMU is not to handle the interrupts by yourself! The famous, powerful profiler tool, perf, is why Linux has its own interrupt handler. Perf uses PMU to monitor a lot of things. You can go to the excellent article Linux perf Examples by Brendan Gregg and see what perf can do.
© LICENSED UNDER CC BY-NC-SA 4.0