





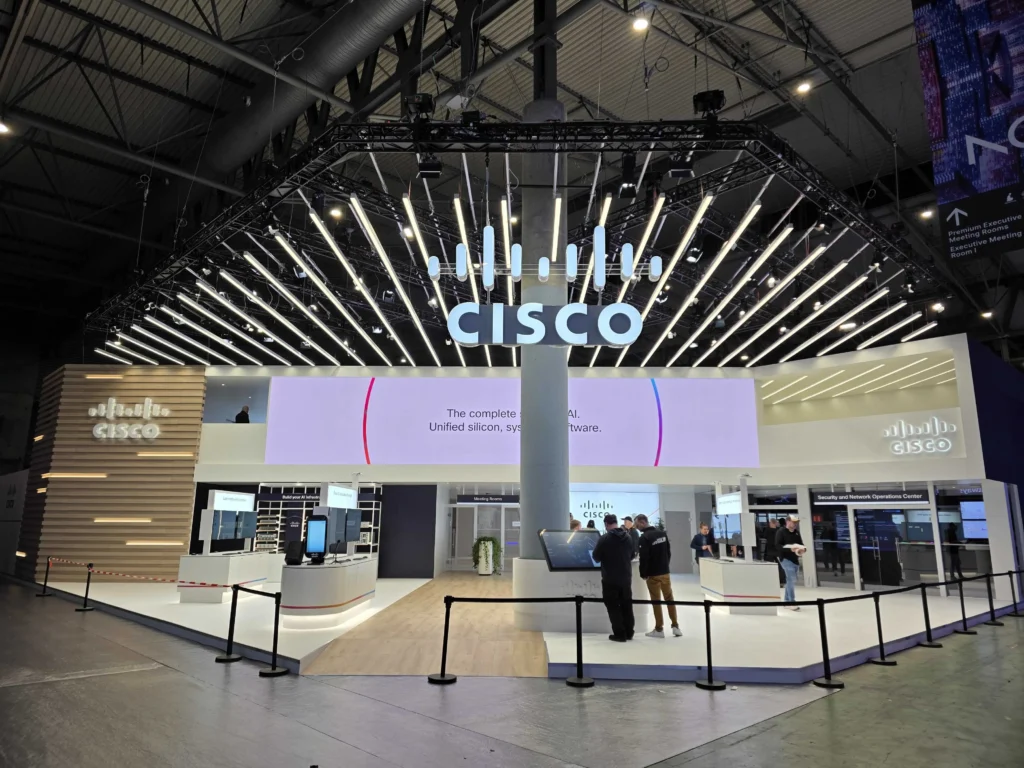
Mobile World Congress (MWC) Barcelona is one of the most demanding environments for network and security operations. With thousands of attendees, unmanaged devices, and applications interacting in real time, operational visibility and threat detection must function flawlessly.
For the 2nd year, the Cisco team leveraged Splunk, in addition to its other security products, to deliver a unified Security Operations Center (SOC) and Network Operations Center (NOC) experience. Together, we used Splunk as the central data platform and integrating telemetry across a broad set of Cisco technologies.
What made this deployment particularly notable was not just the breadth of integrations, but the speed and flexibility with which we operationalized the environment.
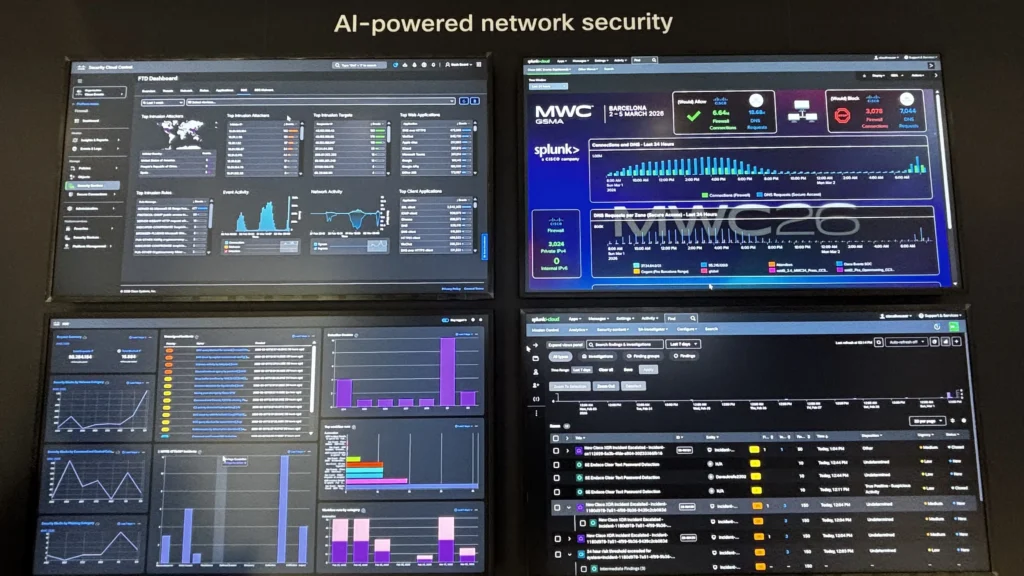
At the core of the deployment was Splunk Cloud, acting as the single pane of glass for both SOC and NOC workflows.
We ingested data from multiple Cisco platforms, including:
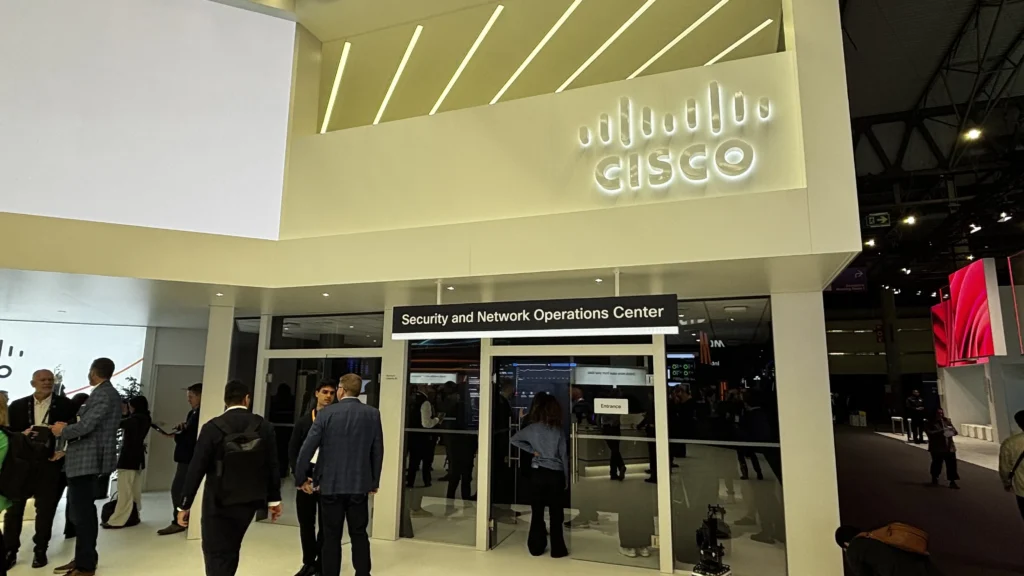
This architecture allowed us to converge traditionally siloed operational domains into a single analytics layer, enabling faster correlation between network events and security incidents.
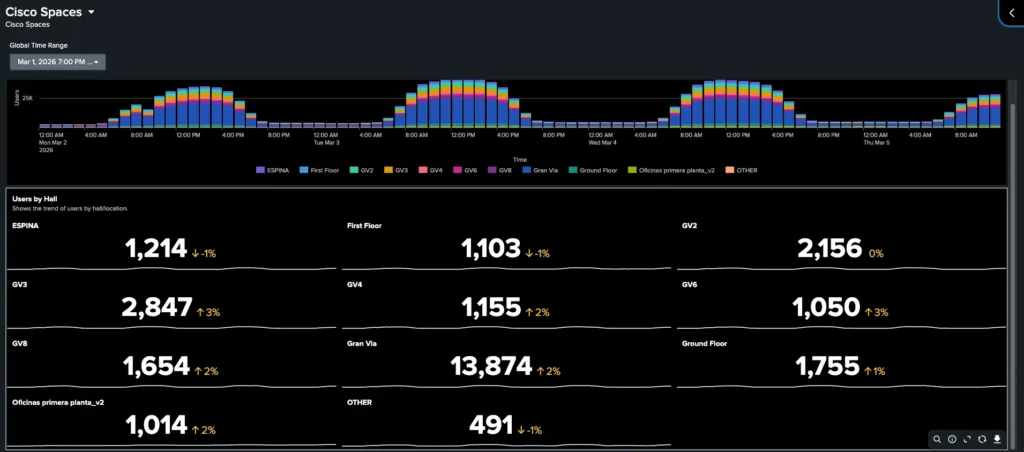
One of the most impactful outcomes was how quickly we were able to deliver operational visibility following various requests from other teams present at the event.
Using Splunk’s data platform and visualization capabilities, we were able to build a fully functional NOC dashboard in just a few hours. The dashboard provided:
Because all telemetry was collected within Splunk, creating meaningful dashboards required minimal transformation work. This highlights a key advantage of using a unified data platform: once ingestion is solved, insights can follow quickly.
Traditionally, SOC and NOC teams operate in parallel, often using separate tools and datasets. At MWC, we intentionally broke down that barrier.
By leveraging Splunk as the common platform:
This convergence enabled faster root cause analysis and reduced mean time to resolution (MTTR), particularly in scenarios where performance issues or traffic anomalies had potential security implications.
A standout aspect of this deployment was the use of the Cisco Secure Firewall 6160—marking its first deployment in a public event environment.
Bringing this data into Splunk required a bit of engineering:
Because of the scale and performance characteristics of the firewall, we implemented a structured ingestion pipeline:
The following diagram illustrates the ingestion pipeline used to reliably transport high-volume firewall telemetry into Splunk Cloud:
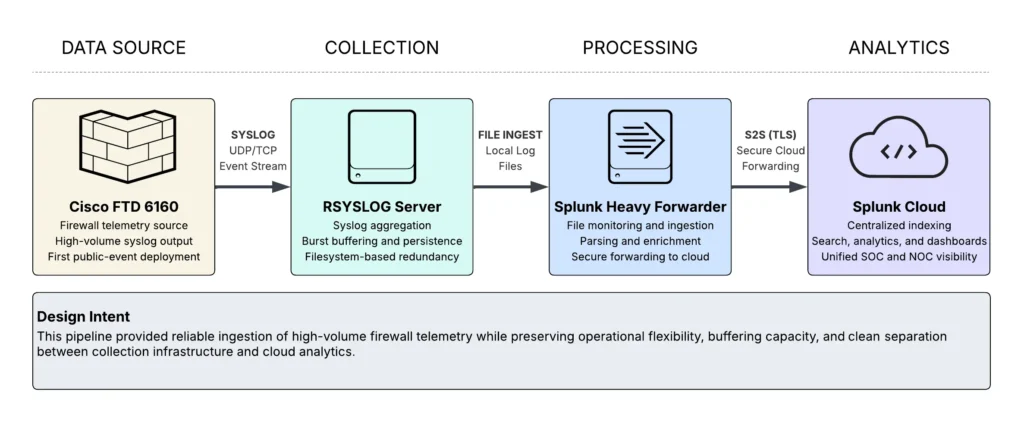
This pipeline ensured reliable ingestion of high-volume firewall telemetry while maintaining performance and data integrity.
A few key takeaways from the deployment:
Bringing SOC and NOC data into a single platform improves operations and makes new insights possible
Once data is flowing and normalized, building dashboards and detections becomes significantly easier.
Components like RSYSLOG and Heavy Forwarders remain critical for handling real-world data ingestion challenges.
Building a production-grade NOC dashboard in hours—not days—is realistic when the platform is designed for it.
Check out the lessons learned from the Event SOCs we deploy around the world, with the white paper and latest blogs.
We’d love to hear what you think! Ask a question and stay connected with Cisco Security on social media.
Cisco Security Social Media
此内容由惯性聚合(RSS阅读器)自动聚合整理,仅供阅读参考。 原文来自 — 版权归原作者所有。