






Our updated Datadog integration and new Prometheus endpoints make discovering insights into your indexes' performance and usage easier than ever. Building upon existing health metrics, you can now also monitor request frequency and duration, consumption of read and write units, and core metrics on latency through our Datadog integration or directly via our new Prometheus endpoints.
Our Datadog integration now delivers metrics for both serverless and pod-based indexes, with 25 new metrics for more granular performance monitoring and improved observability. With the updated integration, you can:
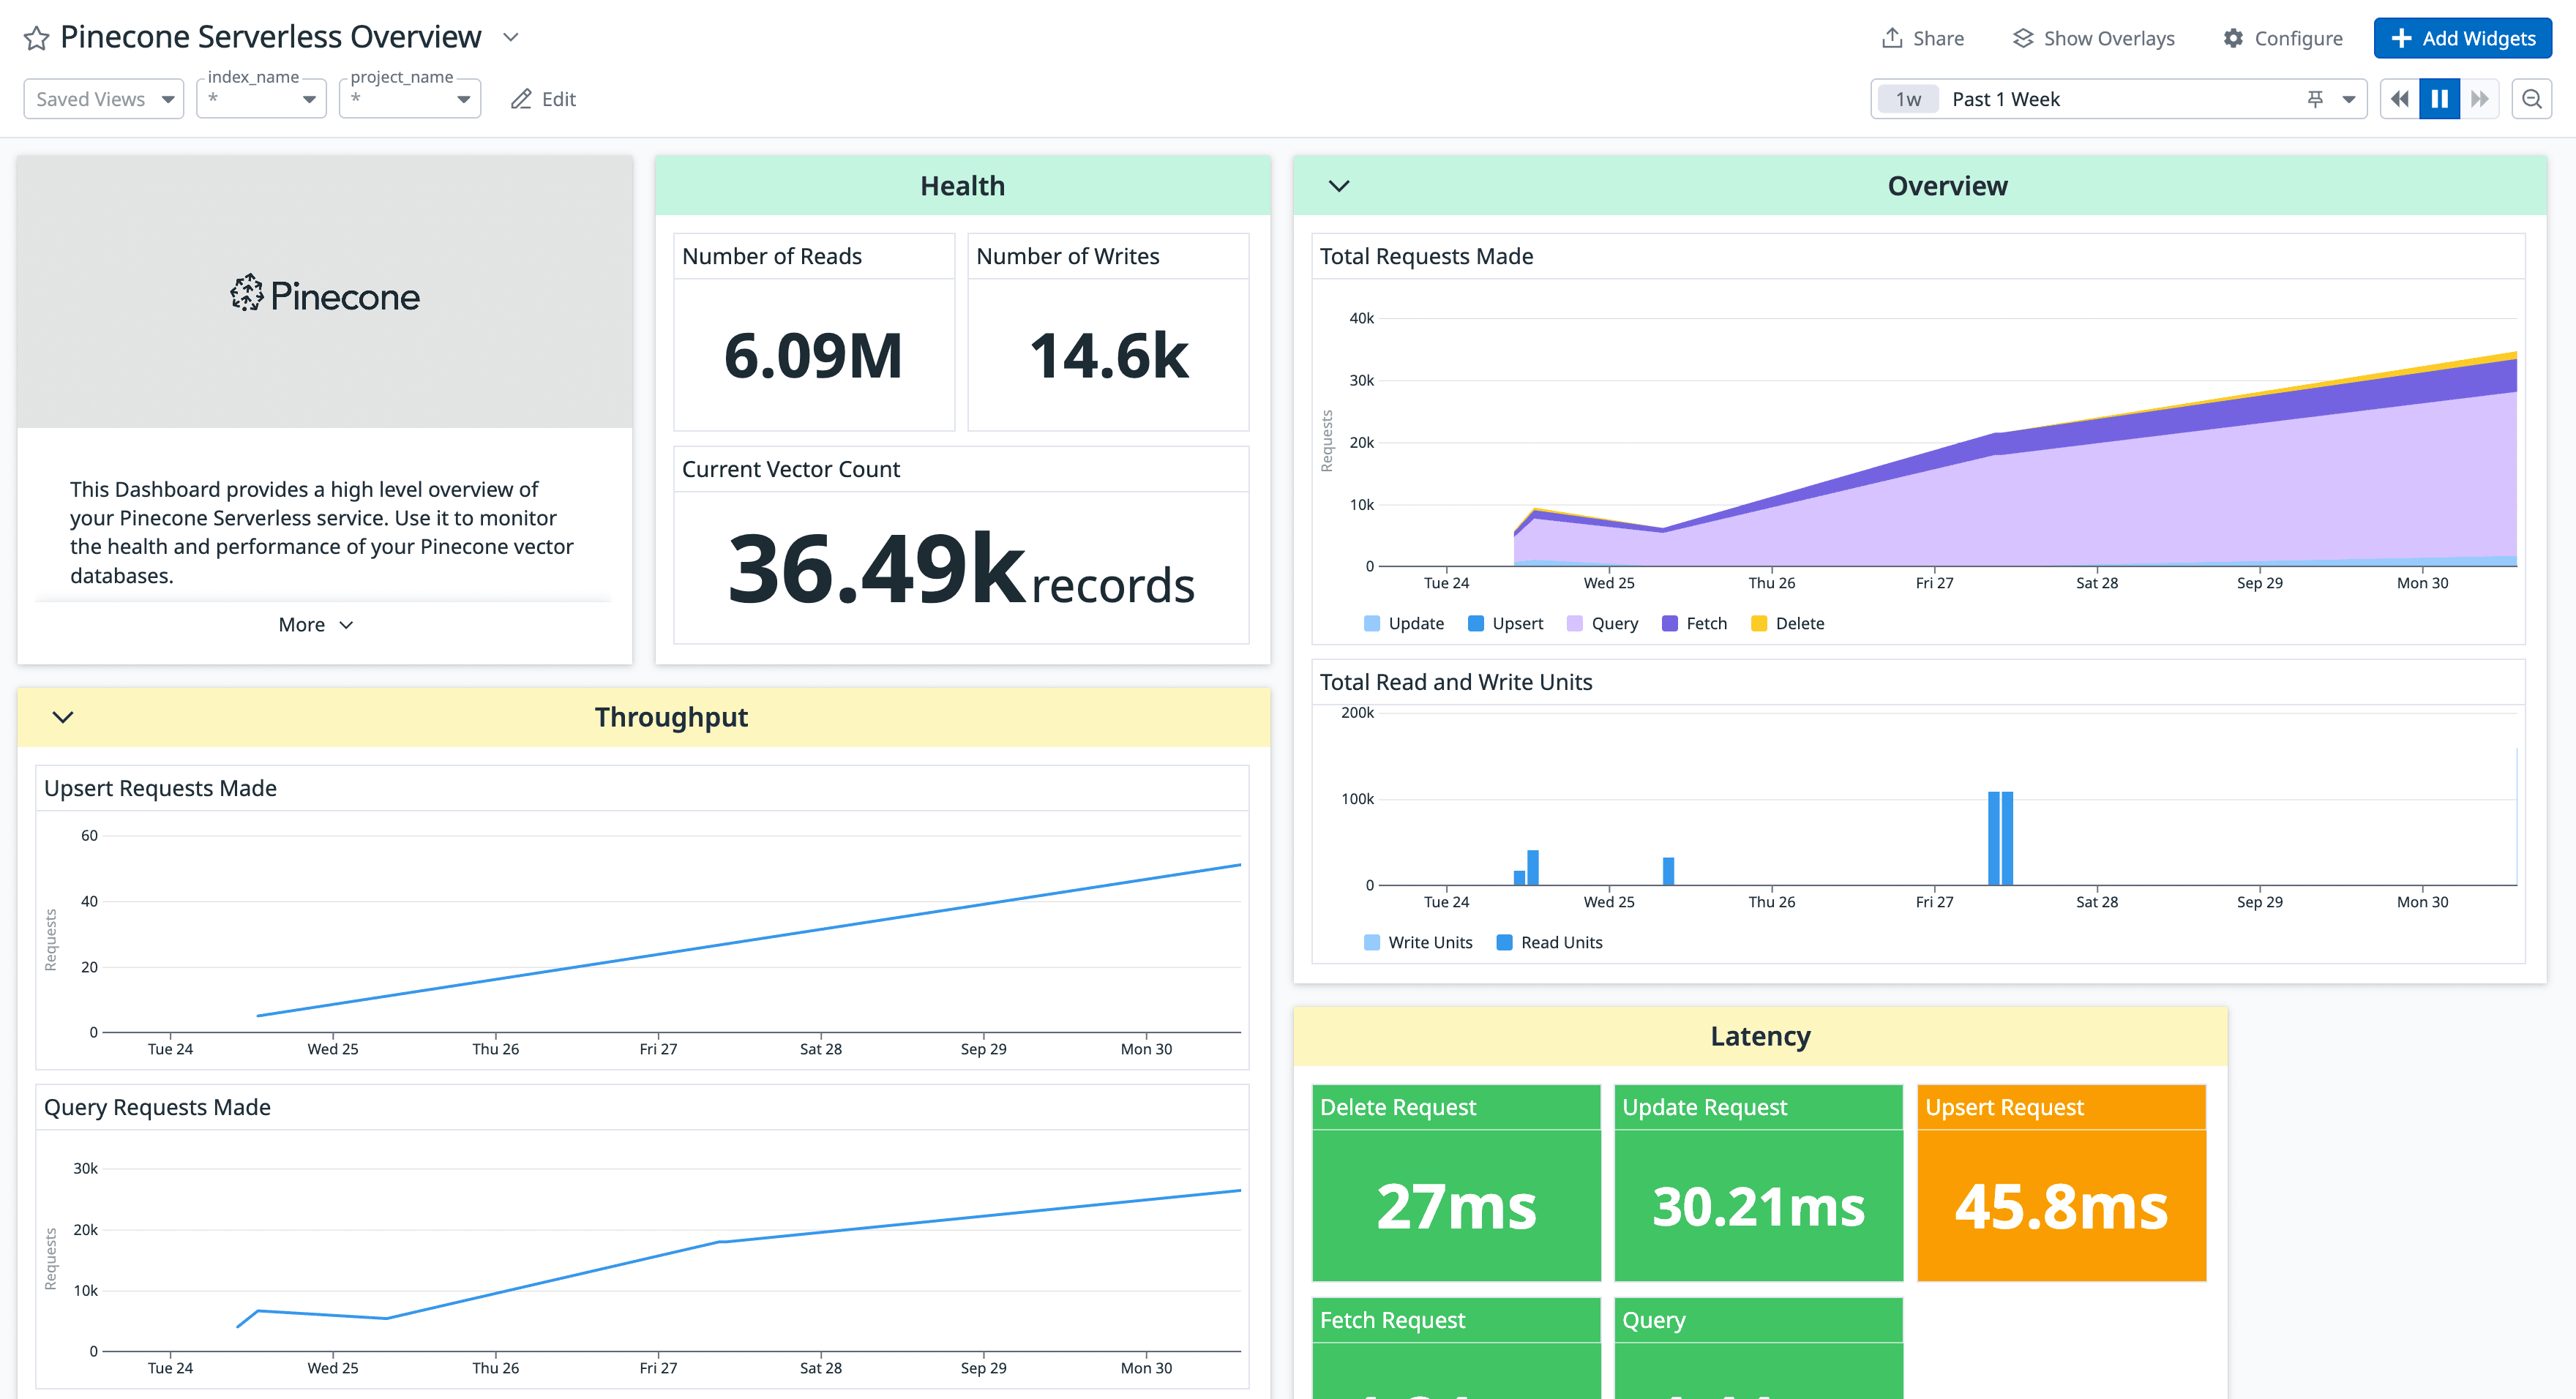
Our out-of-the-box Datadog dashboard for serverless surfaces health metrics on throughput, latency, read and write units, and more.
To set up the Datadog integration, go to Datadog's Pinecone integration page. In the Configure tab, simply add your project ID and API Key for the project you want to monitor. Under Monitoring Resources, you'll find the dashboard and recommended monitors, with a full list of available metrics in the Data Collected tab.
For non-Datadog users, these new metrics are fully accessible via Prometheus. The endpoints are designed with HTTP service discovery to automatically detect and target all serverless indexes across regions within a project, making it easy to monitor the health and performance of your entire environment — no matter how it’s distributed.
To set up monitoring directly with Prometheus, you'll need your Pinecone API Key and project ID. Update the scrape_configs section of your prometheus.yml file with this information to start querying. For step-by-step instructions, a list of available metrics, and example queries, check out our Monitor with Prometheus guide.
Prometheus metrics and our Datadog integration are available to all users on Standard and Enterprise plans. Visit our documentation to learn more and start up-leveling your observability today.
此内容由惯性聚合(RSS阅读器)自动聚合整理,仅供阅读参考。 原文来自 — 版权归原作者所有。